
August 10 , 2021 .
Italy / Sicily , Etna :
Press release on ETNA’s activity, August 09, 2021, 03:13 (01:13 UTC).
The National Institute of Geophysics and Volcanology, Osservatorio Etneo, announces that from 12:40 a.m. there is a gradual increase in strombolian activity underway at the Southeast Crater. The lava flow directed towards the Valle del Bove appears to be well fed and has reached an estimated altitude of around 2900 m.
The activity generates an ash emission which, according to the forecast model, is directed towards the Southeast.
The phase of increasing the mean amplitude of the volcanic tremor continues, which has reached very high values. The source centroid is located in the Southeast Crater area at a depth of about 2900 m above sea level. The infrasound activity has also experienced a gradual increase and from 00:40 UTC shows high values, both in reference to the rate of occurrence and the amplitude of events, which are located at the Southeast Crater.
The time series of the stations in the inclinometric network show modest fluctuations of a few microradians. No variation in the time series of the GNSS network.
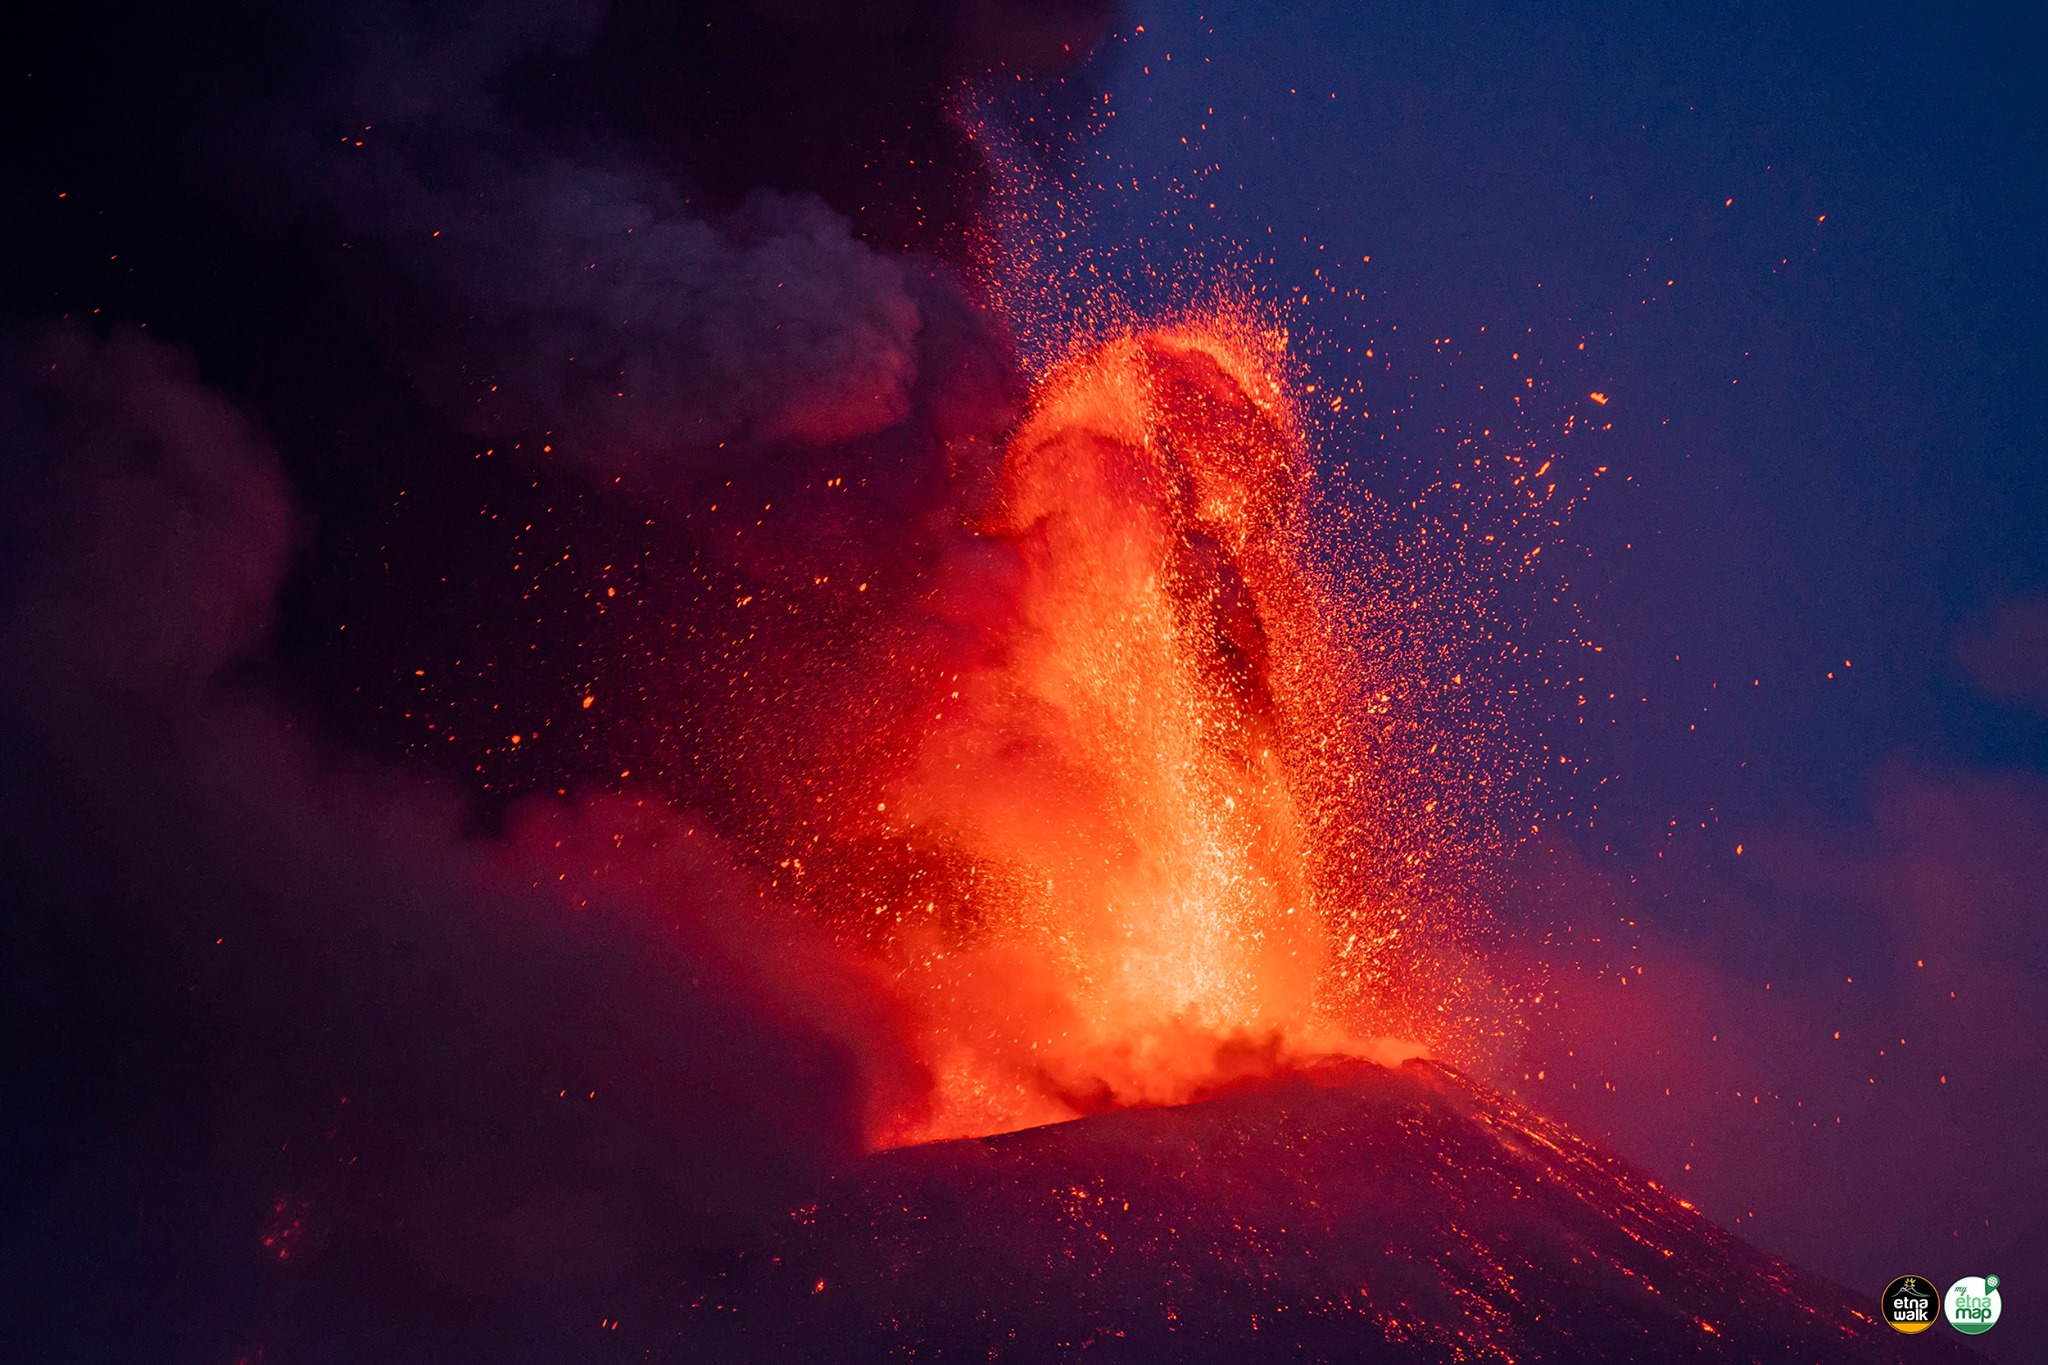
04:09 (02:09 UTC): We observe the gradual shift of Strombolian activity to the lava fountain stage at the Southeast Crater. The lava flow of the Valle del Bove continues to be well fed. In addition, from around 01:50 UTC, a second lava flow is observed which propagates in a southwest direction.
According to the forecast model, the eruptive cloud produced by the current activity disperses in the south-eastern sector of the volcano.
Press release on ETNA’s activity, August 09, 2021, 06:48 (04:48 UTC).
The National Institute of Geophysics and Volcanology, Osservatorio Etneo, reports that at around 04:00 UTC, the Southeast Crater lava fountain gradually ceased.
There remains a modest emission of ash which, on the basis of the forecast model, is dispersed towards the Southeast. The lava flow which extends towards the Valle del Bove and the direct flow of the Southwest continue to be fed. Another modest lava flow is also observed on the southeast side of the Southeast Crater.
As for the average amplitude of the volcanic tremor, after reaching the maximum value at 03:50 UTC, it suffered a sudden decrease until it reached medium-low values. The centroid of the sources is located in the area of the Southeast Crater at an altitude of about 2800 m above sea level. The infrasound activity, from about 04:05 UTC also suffered a decrease rapid, both in the rate of occurrence and in the magnitude of events. Currently, it shows values comparable to those which preceded the resumption of Strombolian activity at the Southeast Crater.
The time series of the upper stations of the inclinometric network show variations contained in two microradians. No significant change was observed in the GNSS network data.
08:01 (06:01 UTC): At 05:40 UTC, there was a collapse of cold material from the eastern flank of the Southeast Crater, towards the Valle del Bove.
Press release on ETNA’s activity, 09 August 2021, 22:13 (20:13 UTC):
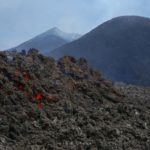
The National Institute of Geophysics and Volcanology, Osservatorio Etneo, reports that the analysis of the CCTV network shows that a weak emission of lava continues from the East and Southeast base of the Southeast Crater, as reported in the previous press release. The lava flows remain confined to an altitude of about 2900 m.
The last ash emission from the Southeast Crater occurred around 13:30 UTC.
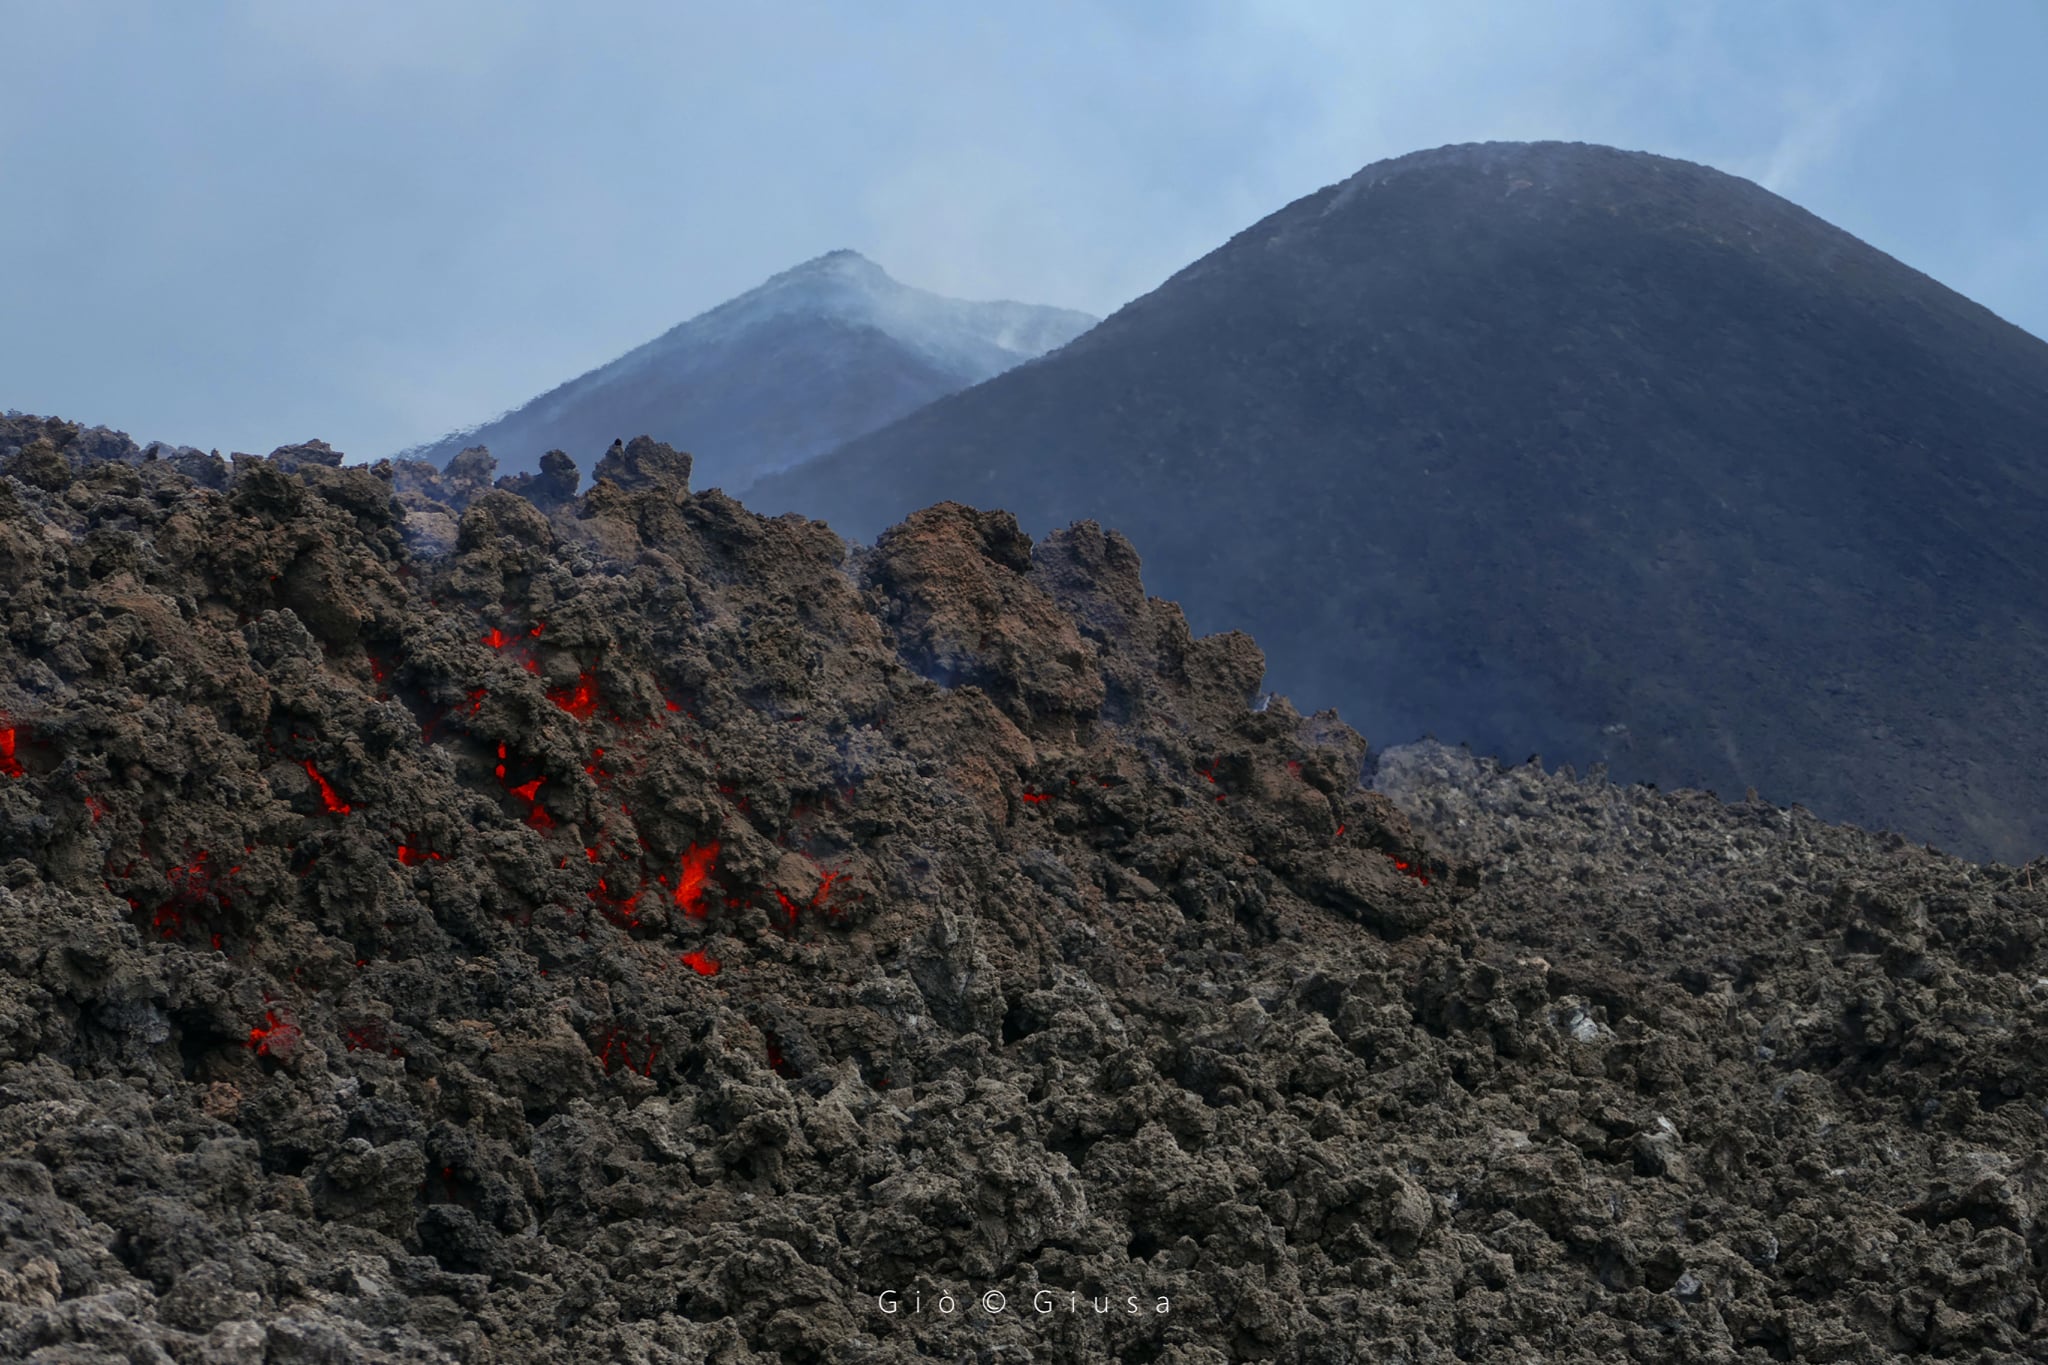
The Southeast cone and its lavas emitted during the last Paroxysm of the last few hours. The lava arm rises a few hundred meters above Monte Frumento Supino
During the morning, the average amplitude of the volcanic tremor showed significant and sudden fluctuations between medium-low and medium-high values, related to the appearance of low-frequency transient phenomena associated with explosive activity at the level of the Southeast Crater and whose infrasound traces are also clearly visible. Currently, the amplitude shows average values and the centroid of the sources is located in the area of the Voragine crater at an altitude of about 2700 m above sea level. With regard to the infrasound activity, with the exception of the phases, mentioned above, of rapid increase in the rate of occurrence and the amplitude of the events of the Southeast Crater, it remained at an average level. -bas with sources in the area of the Crater of the Bocca Nuova. The infrasound activity is currently low. Since the last update, no significant changes have been observed in the time series of soil deformation monitoring stations.
Further updates will be communicated shortly.
Source : INGV.
Photos : Giuseppe Distefano / Marco Restivo ( Etnawalk : https://www.facebook.com/photo/?fbid=361943315373793&set=ms.c.eJw1zcENwEAIA8GOIrC5GPpvLAoHzxHWwtcrkAELO6aH17qOa~%3BI9FJU5RqVMjrX3PrR74N~_nYXvV5hnXaaO2790vzl3W~%3B~_FzN3Y~%3B8wMwwyNu.bps.a.361941878707270) , Gio Giusa .
Vidéo : Michele Mammino , https://youtu.be/keNu1Htqq9A
United States , Yellowstone :
44°25’48 » N 110°40’12 » W,
Summit Elevation 9203 ft (2805 m)
Current Volcano Alert Level: NORMAL
Current Aviation Color Code: GREEN
Recent work and news
The month of July saw the most energetic swarm of earthquakes in the region since the Maple Creek earthquake swarm of June-September 2017. While above average, this level of seismicity is not unprecedented, and it does not reflect magmatic activity. Earthquakes at Yellowstone are dominantly caused by motion on preexisting faults and can be stimulated by increases in pore pressure due to groundwater recharge from snow melt. If magmatic activity were the cause of the quakes, we would expect to see other indicators, like changes in deformation style or thermal/gas emissions, but no such variations were detected.
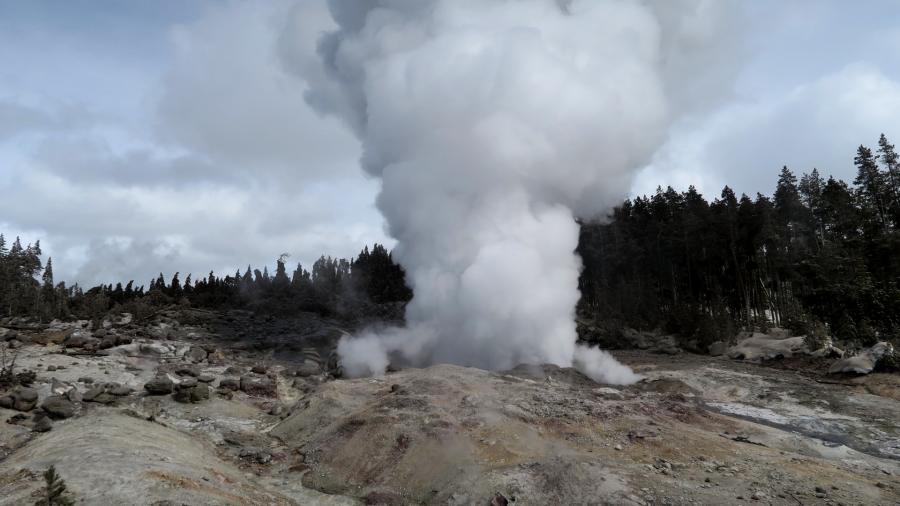
There was only one eruption of Steamboat Geyser in July 2021, so the total number of eruptions for the year is now 13. Over the past few months, the time between eruptions has increased, which may indicate that the present period of frequent eruptions is coming to a gradual close.
July was a busy time for field work by Yellowstone Volcano Observatory scientists. Seismologists recovered 140 temporary seismic stations in Norris Geyser Basin, and they will use the data they collected over the month that the stations were installed to understand patterns of subsurface water flow and geyser activity. Geologists spent time mapping hydrothermal explosion craters in Lower Geyser Basin, trying to better determine their timing and style of formation, and also collected samples from nearby lava flows to improve age constraints on Yellowstone volcanism. Finally, geochemists installed gas-monitoring equipment in the Mud Volcano area in a first-of-its-kind experiment to provide continuous concentration data for several gas species. Once the data are calibrated and satellite telemetry is established, the data will be available via the Yellowstone Volcano Observatory monitoring page.
Seismicity
During July 2021, the University of Utah Seismograph Stations, responsible for the operation and analysis of the Yellowstone Seismic Network, located 1008 earthquakes in the Yellowstone National Park region. This number is preliminary and will likely increase, since dozens more small earthquakes, from July 16, require further analysis. This is the most earthquakes in a month since June 2017, when over 1100 earthquakes were located. Earthquakes like these are associated with movement on preexisting faults that can be triggered by pore pressure increases as groundwater levels rise due to recharge from snow melt. The largest event of the past month was a minor earthquake of magnitude 3.6 located 11 miles beneath Yellowstone Lake, 7.4 miles south-southeast of Fishing Bridge. Yellowstone National Park, on July 16 at 6:45 PM MDT. This event was part of an energetic sequence of earthquakes in the same area that began on July 16.
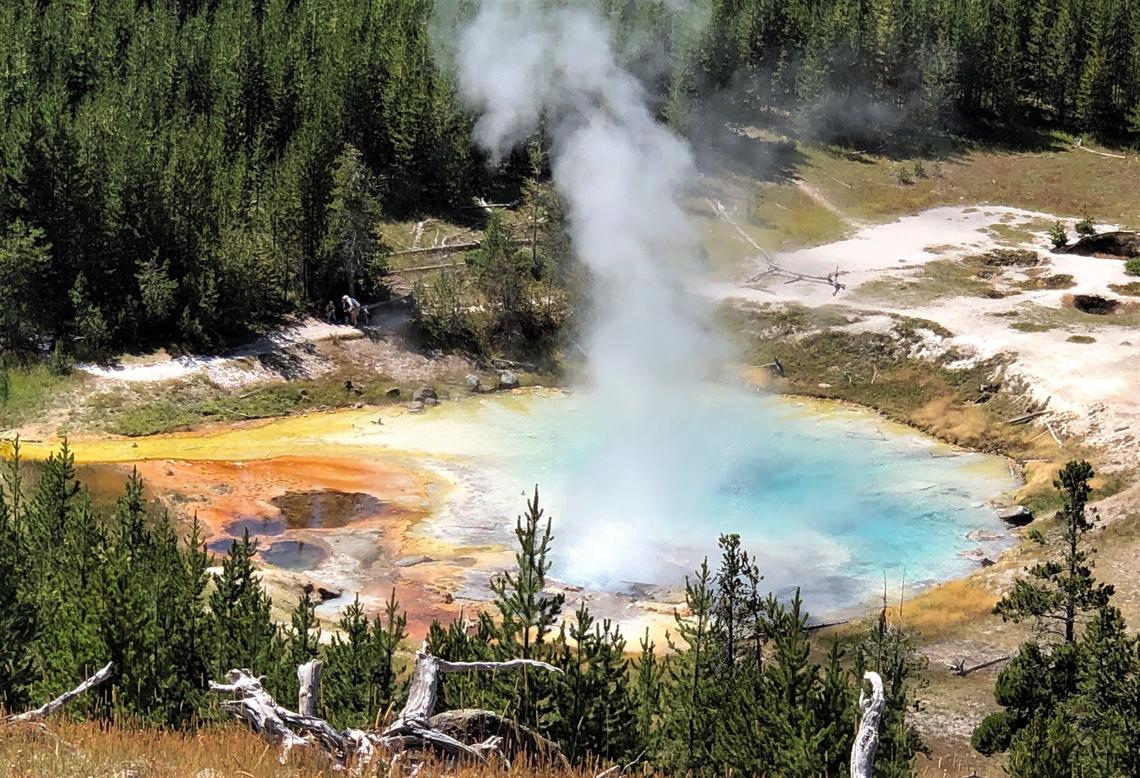
The Imperial Geyser in Yellowstone National Park is approximately 30m (about 100ft) in diameter and contains Cl alkaline water with a steam vent in the pool and sludge outside the pool (in the upper section). right of this photo). USGS Photo by Pat Shanks, 2019.
July seismicity in Yellowstone was marked by seven earthquake swarms:
1) A swarm of 764 earthquakes occurred beneath Yellowstone Lake (with several small earthquakes from July 16 still requiring analysis). It began on July 16 and includes the largest event of the month (magnitude 3.6, detailed above). This swarm consists of four earthquakes in the magnitude 3 range and 85 in the magnitude 2 range. These numbers will be updated upon completion of the analysis. This sequence has decreased to only a few earthquakes per day but may continue into August.
2) A swarm of 40 earthquakes, ~12 miles east-northeast of West Yellowstone, MT, began on July 19, with the largest event (magnitude 2.1) occurring on July 23 at 10:20 PM MDT.
3) A series of 34 earthquakes ~11 miles northeast of West Yellowstone, MT, continued into July from a swarm that began on June 19. The largest July event (magnitude 1.5) occurred on June 30 at 07:12 PM MDT (July 1 at 01:12 AM UTC), ~11.5 miles northeast of West Yellowstone, MT.
4) A series of 24 earthquakes ~11 miles northeast of West Yellowstone, MT, continued up to July 3rd (MDT) from a swarm that began June 9. The largest July event (magnitude 2.6) occurred on July 3 at 07:31 AM MDT, ~14.5 miles north-northeast of Old Faithful, Yellowstone National Park.
5) A swarm of 20 earthquakes occurred July 29–31 north of Norris Geyser Basin in Yellowstone National Park. The largest event (magnitude 1.9) was on July 29 at 9:31 AM MDT, ~3 miles north of Norris Geyser Basin.
6) A small swarm of 14 earthquakes occurred July 9–10. The largest, M 2.0, took place at 12:08 PM MDT on July 10, located 15.5 miles south of Old Faithful, Yellowstone National Park.
7) A small swarm of 12 earthquakes occurred July 10–15. The largest, M 2.7, was on July 12 at 11:34 AM MDT, located 15 miles north-northeast of Old Faithful, Yellowstone National Park.
Earthquake sequences like these are common and account for roughly 50% of the total seismicity in the Yellowstone region.
Yellowstone earthquake activity is currently above background levels.
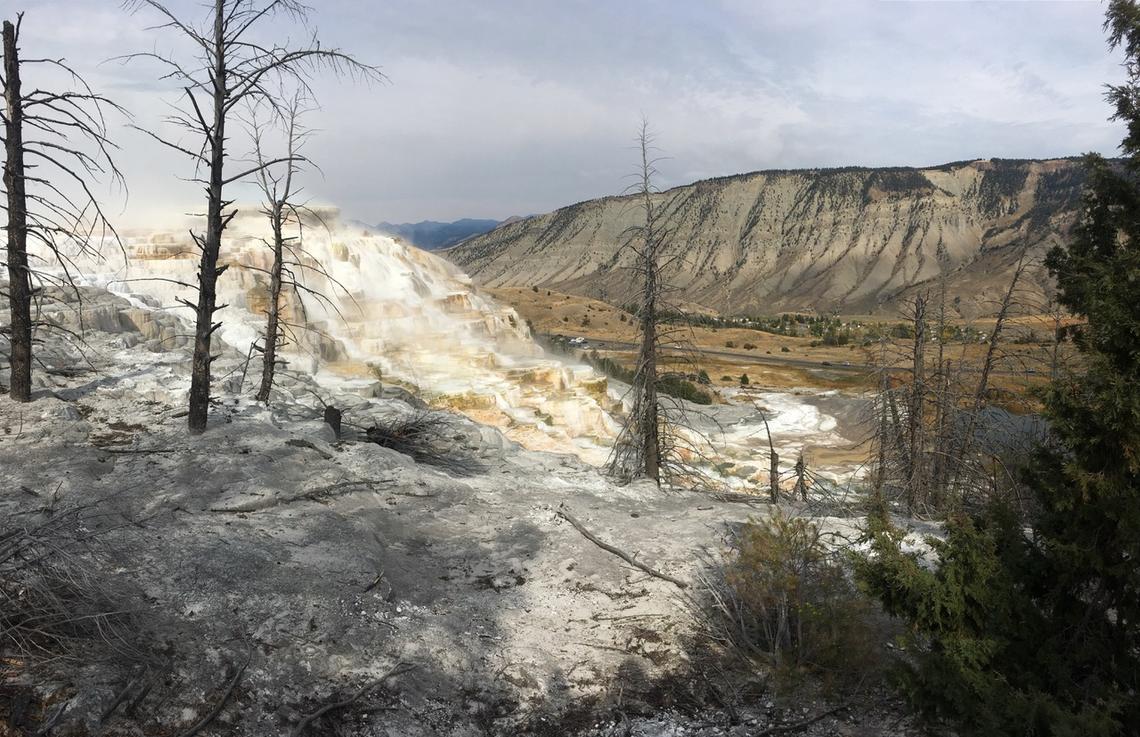
Angel Terrace, Mammoth Hot Springs, Yellowstone National Park.
Ground deformation :
Subsidence of Yellowstone Caldera, which has been ongoing since 2015, has paused during the summer months, reflecting seasonal groundwater recharge. Every summer, water from snow melt causes the ground to swell slightly, resulting in a pause in subsidence trends or even a minor amount of uplift (less than 1 cm / fraction of an inch). In the area of Norris Geyser Basin, no significant uplift or subsidence has been detected by a nearby GPS station since the start of 2020. No deformation associated with the energetic earthquake swarm beneath Yellowstone Lake was noted.
Source : YVO.
Photos : streamboat / Behnaz Hosseini , Pat Shanks. Public domain , JoAnn Holloway. Public domain.
Indonesia , Raung :
Decrease in the activity level of the Raung volcano, August 09, 2021.
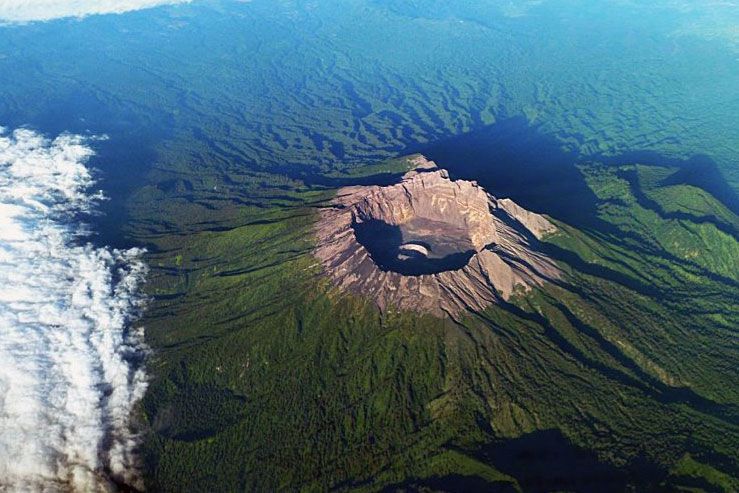
Raung volcano (other name: Rawon) is one of the active volcanoes in East Java, with a maximum height of 3332 meters above sea level. This volcano is a stratum-caldera volcano, with the main crater at the elliptical summit with a size of 1750 x 2250 m2, and a depth of 400-550 m from the edge of the crater.
On January 21, 2021, Mount Raung’s activity level rose from level I (normal) to level II (alert) after a significant increase in visual activity and seismicity was observed. The monitoring of the volcanic activity of Mount Raung was carried out from the Raung Volcano Observation Post (PGA) located in the village of Mangaran,.
I. Visual observation
Visual observations of Raung volcano from July 1 to August 8, 2021: The volcano was clearly visible until it was covered in fog. No smoke from the crater was observed. Gas emissions or effusive or explosive eruptions have not been observed since February 2021.
II. Instrumental observation
Seismicity after the January-February 2021 series of eruptions was dominated by emission earthquakes and tectonic earthquakes. The vibrations of tremor are always recorded with a decreasing amplitude. Volcanic earthquakes (Deep Volcanics, Shallow Volcanics) are not recorded.
Seismic energy observations via the RSAM (Real Seismic Amplitude Measurement) graph show a downward trend until August 8, 2021.
The measurement of the deformation through the inclinometers shows a model of deflation (deflation of the body of the volcano).
III. Potential danger
The potential danger of a Mount Raung eruption is the lava flows and the ejection of glowing rocks from the bottom of the crater. As the eruption increases, the ejection distance of glowing rock material can reach the edge of the crater. Currently, the potential threat of danger is in the form of volcanic gas emissions, the distribution of which is limited to the bottom of the crater.
IV. Conclusion
Based on the results of visual and instrumental monitoring as well as potential threats of danger, the activity level of Mount Raung was lowered from level II (alert) to level I (normal) from August 9, 2021 at 1:00 p.m. WIB.
Monitoring of Mount Raung activity continues to be carried out intensively to anticipate symptoms of increasing volcanic activity leading to eruptions or changes in potential hazards.
Source : PVMBG.
Photo : Paula Caiado
Russia / Northern Kurils , Chirinkotan :
VOLCANO OBSERVATORY NOTICE FOR AVIATION (VONA)
Issued: August 9 , 2021
Volcano: Chirinkotan (CAVW #290260)
Current aviation colour code: ORANGE
Previous aviation colour code: orange
Source: KVERT
Notice Number: 2021-82
Volcano Location: N 48 deg 58 min E 153 deg 28 min
Area: Northern Kuriles, Russia
Summit Elevation: 724 m (2374.72 ft)
Volcanic Activity Summary:
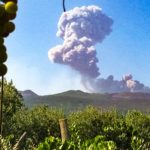
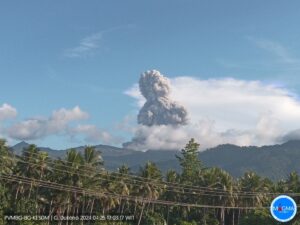
The moderate explosive event of the volcano Chirinkotan (Chirinkotan Island) occurred at 08:15 UTC on 09 August. Ash cloud 13×10 km in size is drifting for about 26 km to the south-southeast of the volcano.
The moderate eruptive activity of the volcano continues. Ash explosions up to 10-15 km (32,800-49,200 ft) a.s.l. could occur at any time. Ongoing activity could affect international and low-flying aircraft.
Volcanic cloud height:
2300-2500 m (7544-8200 ft) AMSL Time and method of ash plume/cloud height determination: 20210809/0850Z – Himawari-8
Other volcanic cloud information:
Distance of ash plume/cloud of the volcano: 26 km (16 mi)
Direction of drift of ash plume/cloud of the volcano: SSE / azimuth 151 deg
Time and method of ash plume/cloud determination: 20210809/0850Z – Himawari-8
Start time of explosion and how determined: 20210809/0815Z – Satellite data
Remarks:
Last explosive eruption of the volcano was in 2013-2015; explosions sent ash up to 4 km a.s.l.
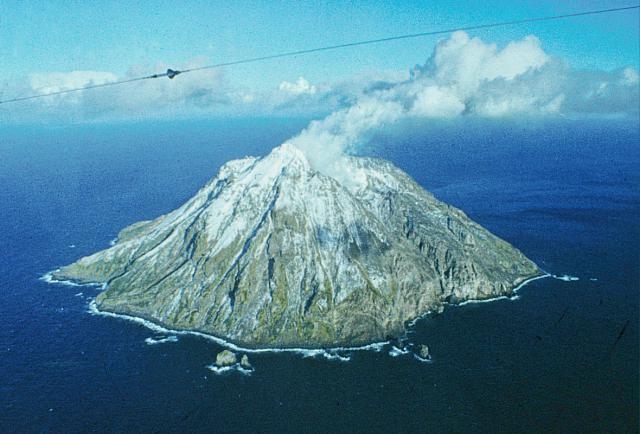
The small, mostly unvegetated 3-km-wide island of Chirinkotan occupies the far end of an E-W volcanic chain that extends nearly 50 km W of the central part of the main Kuril Islands arc. It is the emergent summit of a volcano that rises 3000 m from the floor of the Kuril Basin. A small 1-km-wide caldera about 300-400 m deep is open to the SW. Lava flows from a cone within the breached crater reached the shore of the island. Historical eruptions have been recorded since the 18th century. Lava flows were observed by the English fur trader Captain Snow in the 1880s.
Sources : Kvert. GVP.
Photo : Kvert.
Guatemala , Pacaya :
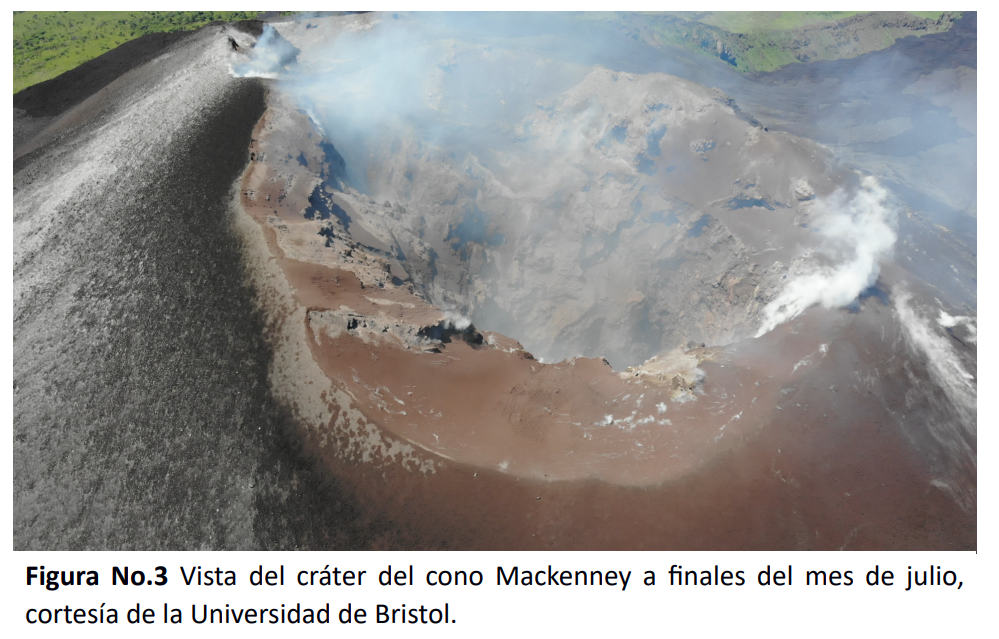
SPECIAL VOLCANOLOGICAL BULLETIN BEPAC-103-2021, UPDATE ON THE ACTIVITY OF THE PACAYAN VOLCANO.
The Pacaya volcano presents the characteristics of a new phase of activity after almost four months of relatively low activity, which generates a constant degassing of weak characteristics and for certain times abundant. Today (August 4), there were 3 moderate explosions (9:05 a.m., 1:40 p.m. and 2:21 p.m. local time), which expelled columns of ash at an altitude of 3,500 m (11,482 feet) with a displacement towards the North, over a distance of about 12 kilometers.

Ash falls are reported in the communities of Mesías Altas, Mesías Bajas and Villa Canales. The Mackenney Cone crater has undergone significant changes since the last eruptive phase, having destroyed the cinder cones and lava flows that filled its interior, showing a large crater about 10 0 meters deep, hence emanates gas and ashes. Around the crater there are some cracks, so it is considered an unstable area.
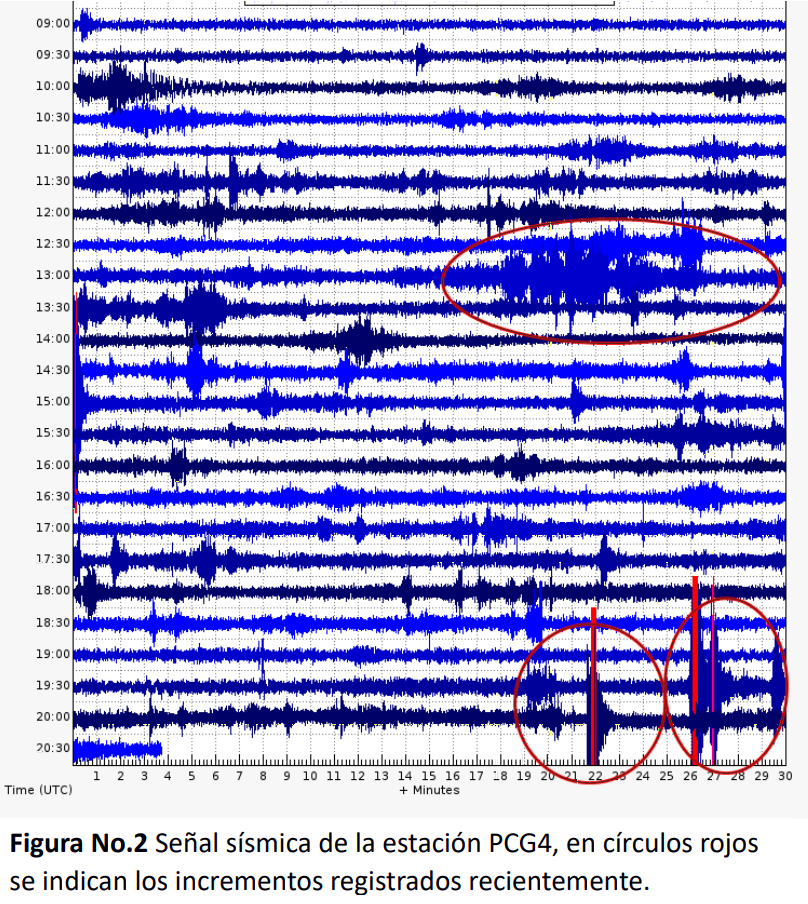
The seismic stations of PCG2 and PCG4 maintain the recording of tremor (internal vibration) with episodes of increase in amplitude, this is associated with the gas pressure and a possible rise of magma, it is therefore not excluded that this activity is the start of another period of activity characterized by continued explosive behavior and the formation of lava fountains that project material into the crater, as well as the likelihood of tall eruptive columns being generated.
INSIVUMEH maintains visual and instrumental monitoring of the evolution of the activity of the Pacaya volcano with seismic stations and OVPAC observers.
Source : Insivumeh
No comment yet, add your voice below!