January 26 , 2020 .
Ecuador / Galapagos , Fernandina :
Special report n ° 3 on the Fernandina volcano – 2020. Eruptive activity update
Summary:
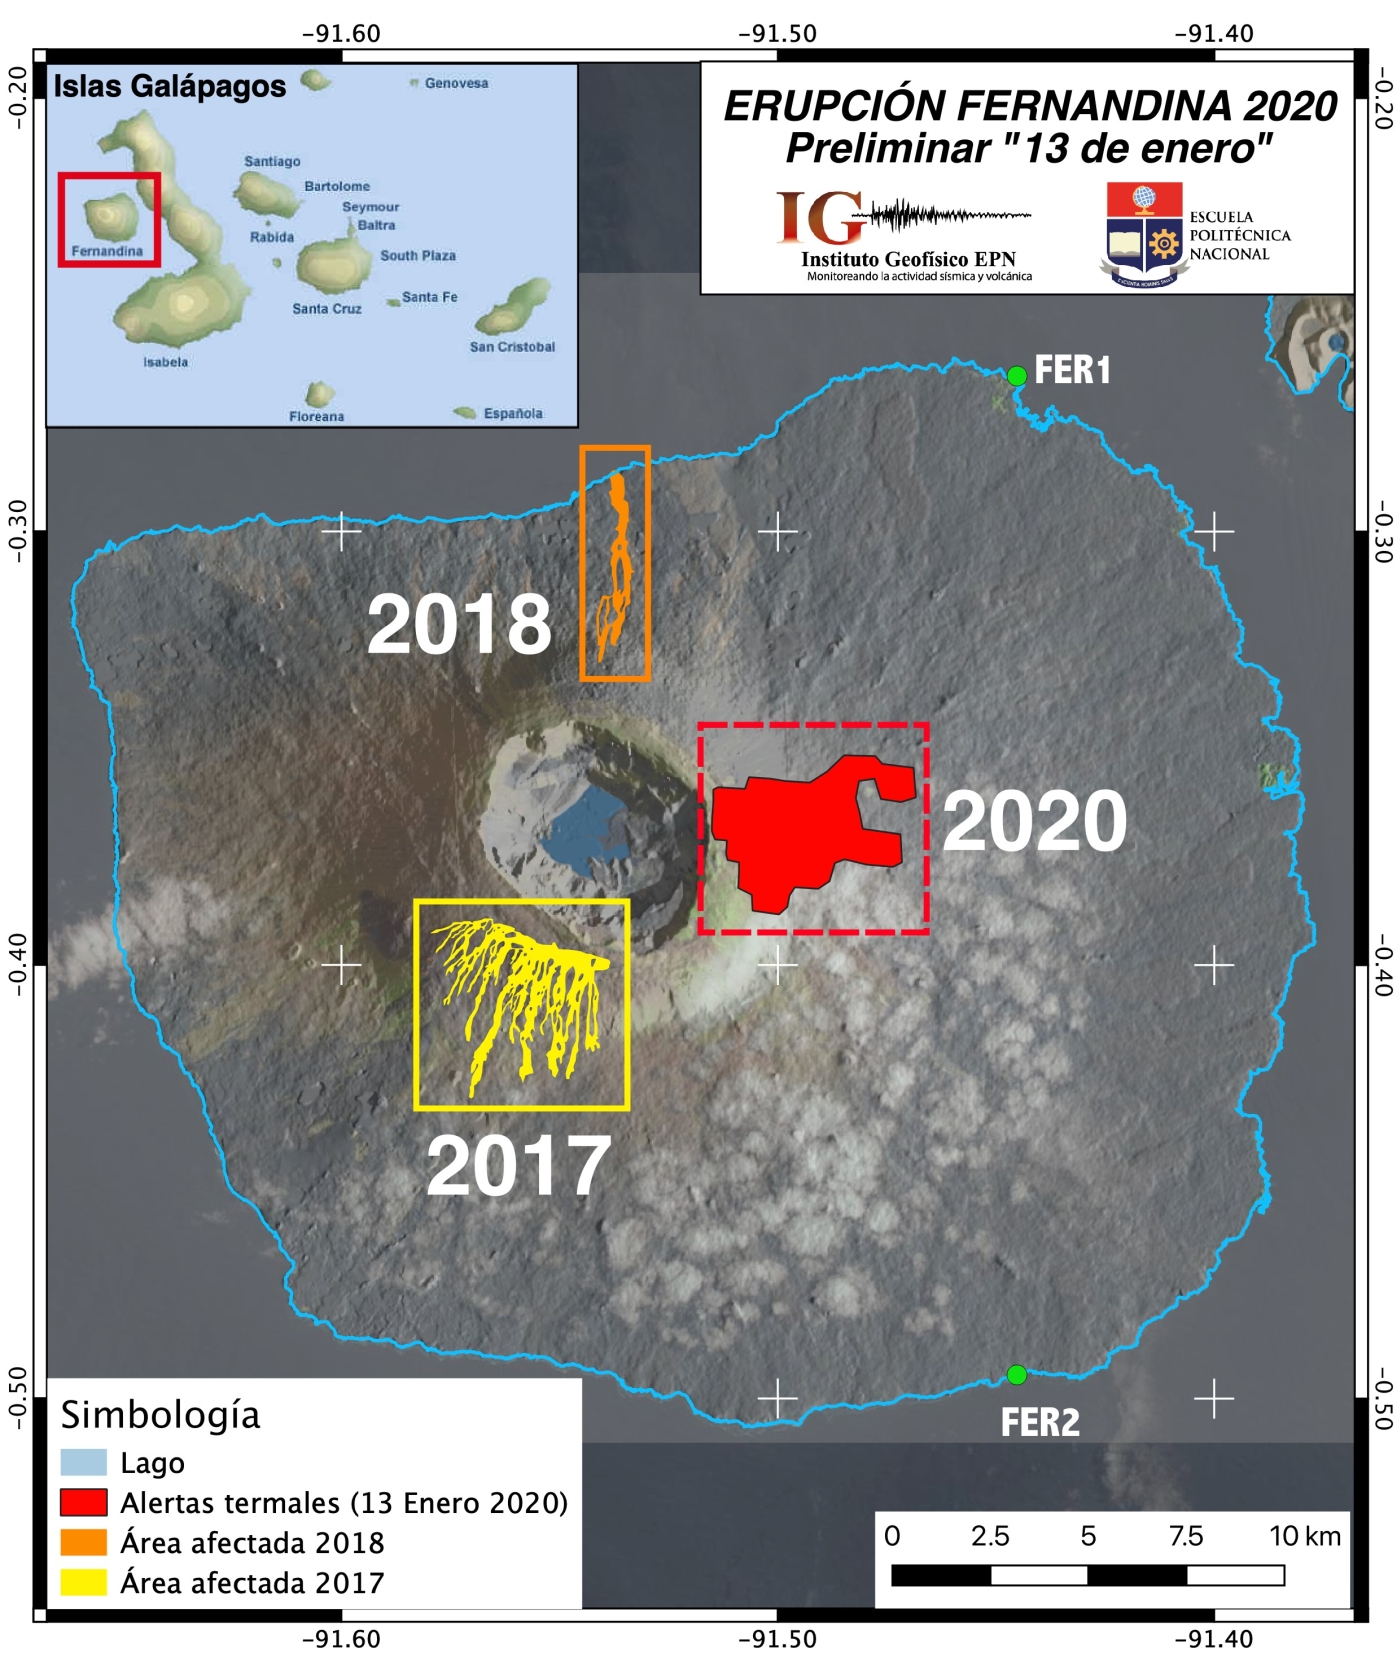
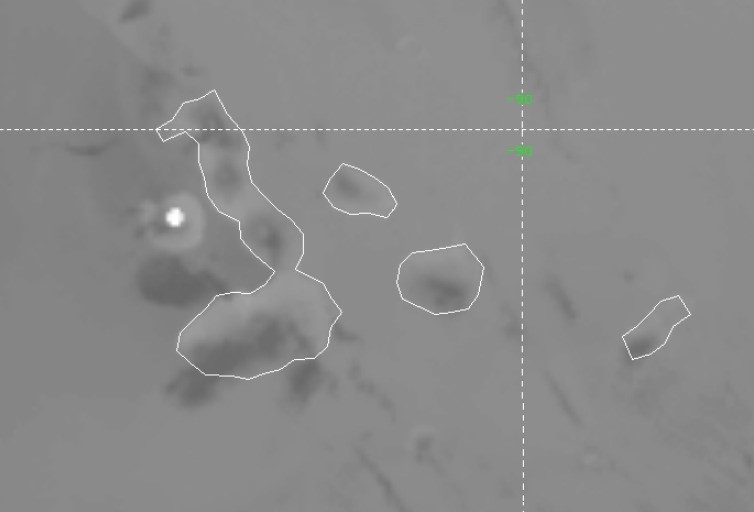
The seismic activity after the January 12, 2020 eruption has not returned to its basic levels (pre-eruption); on the contrary, it increased, presenting sporadic earthquakes of magnitude greater than M 3.0 and small seismic swarms which have evolved over time. The strongest earthquake was recorded on January 21, 2020 with a magnitude of 4.2. In addition, a ground deformation of about 35 cm was detected in the emission zone of the lava flows. The preliminary estimate of the lava flows emitted on January 12, 2020, located east of the volcano, indicates that they cover an area of approximately 3.8 km2 (Fig. 1), a value lower than the estimates of previous circumferential eruptions (2017 and 2005). At the time of publication of this report, no new thermal anomalies or gas emissions have been recorded. In some of the previous volcano eruptions in the Galapagos Islands (Fernandina 2009, Wolf 2015, Sierra Negra 2018), the absence of surface activity after a first eruptive pulse can be followed by a second eruptive phase, it is not therefore not excluded that something similar could happen on this occasion on Fernandina. IG-EPN is continuing volcanic monitoring and will inform if there are changes in the internal or external activity of the volcano.
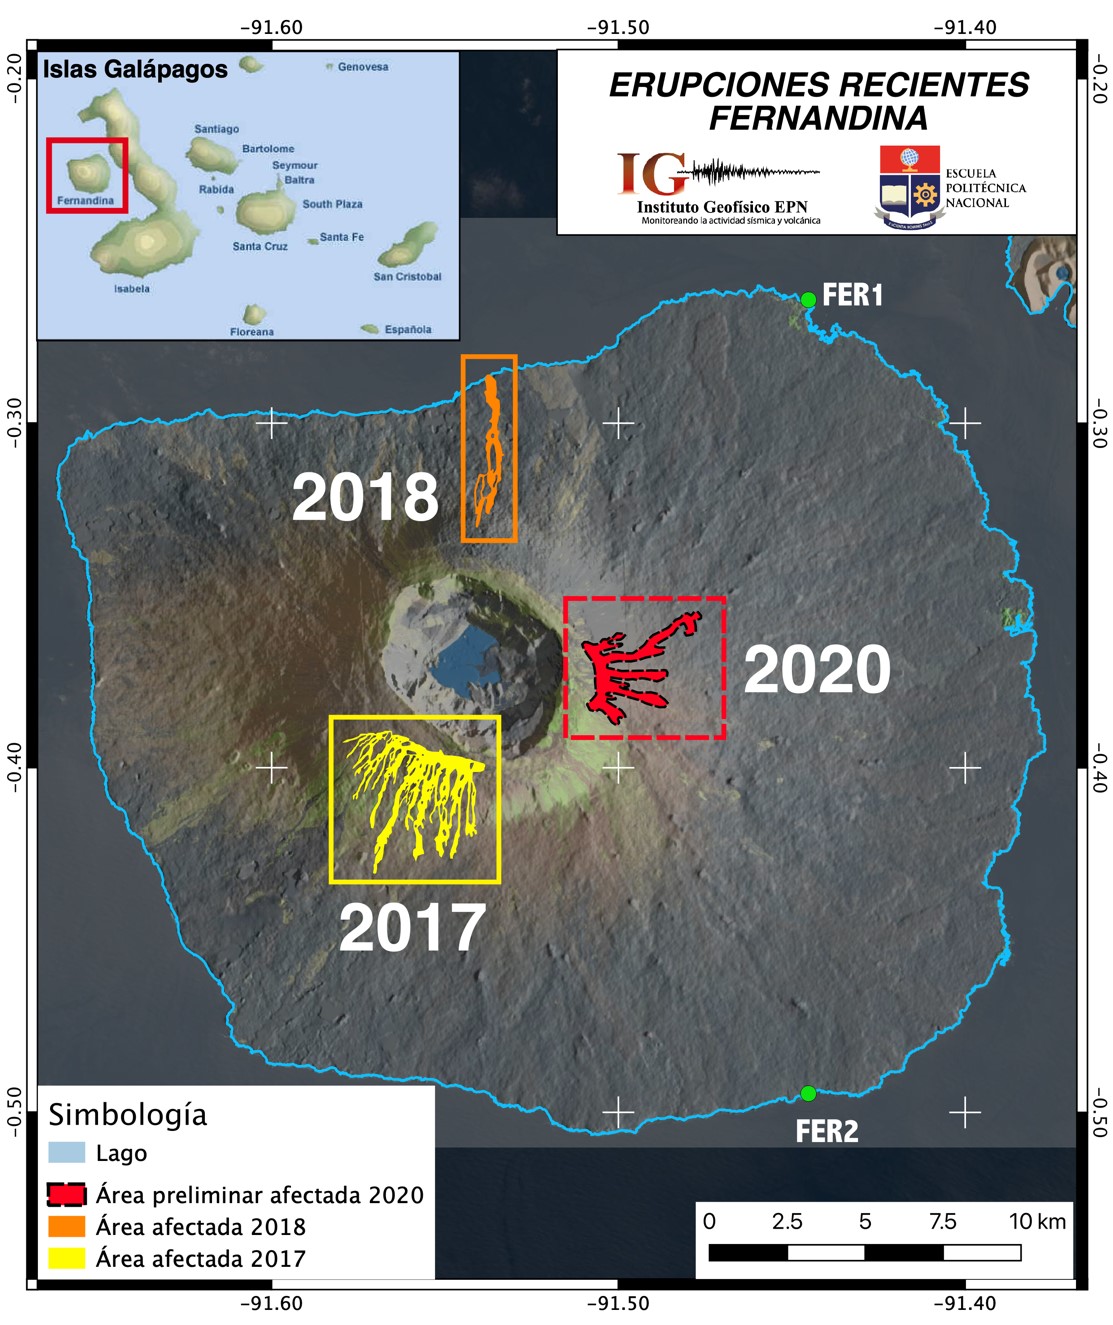
Figure 1. Map of the recent eruptions of the Fernandina volcano, which highlights in red the area previously affected by the lava flows produced on January 12, 2020 (red area), which covers an area of approximately 3.8 km2. Map obtained thanks to InSAR coherence images (processed with ISCE, P. Espín, prepared by FJ. Vásconez).
Background
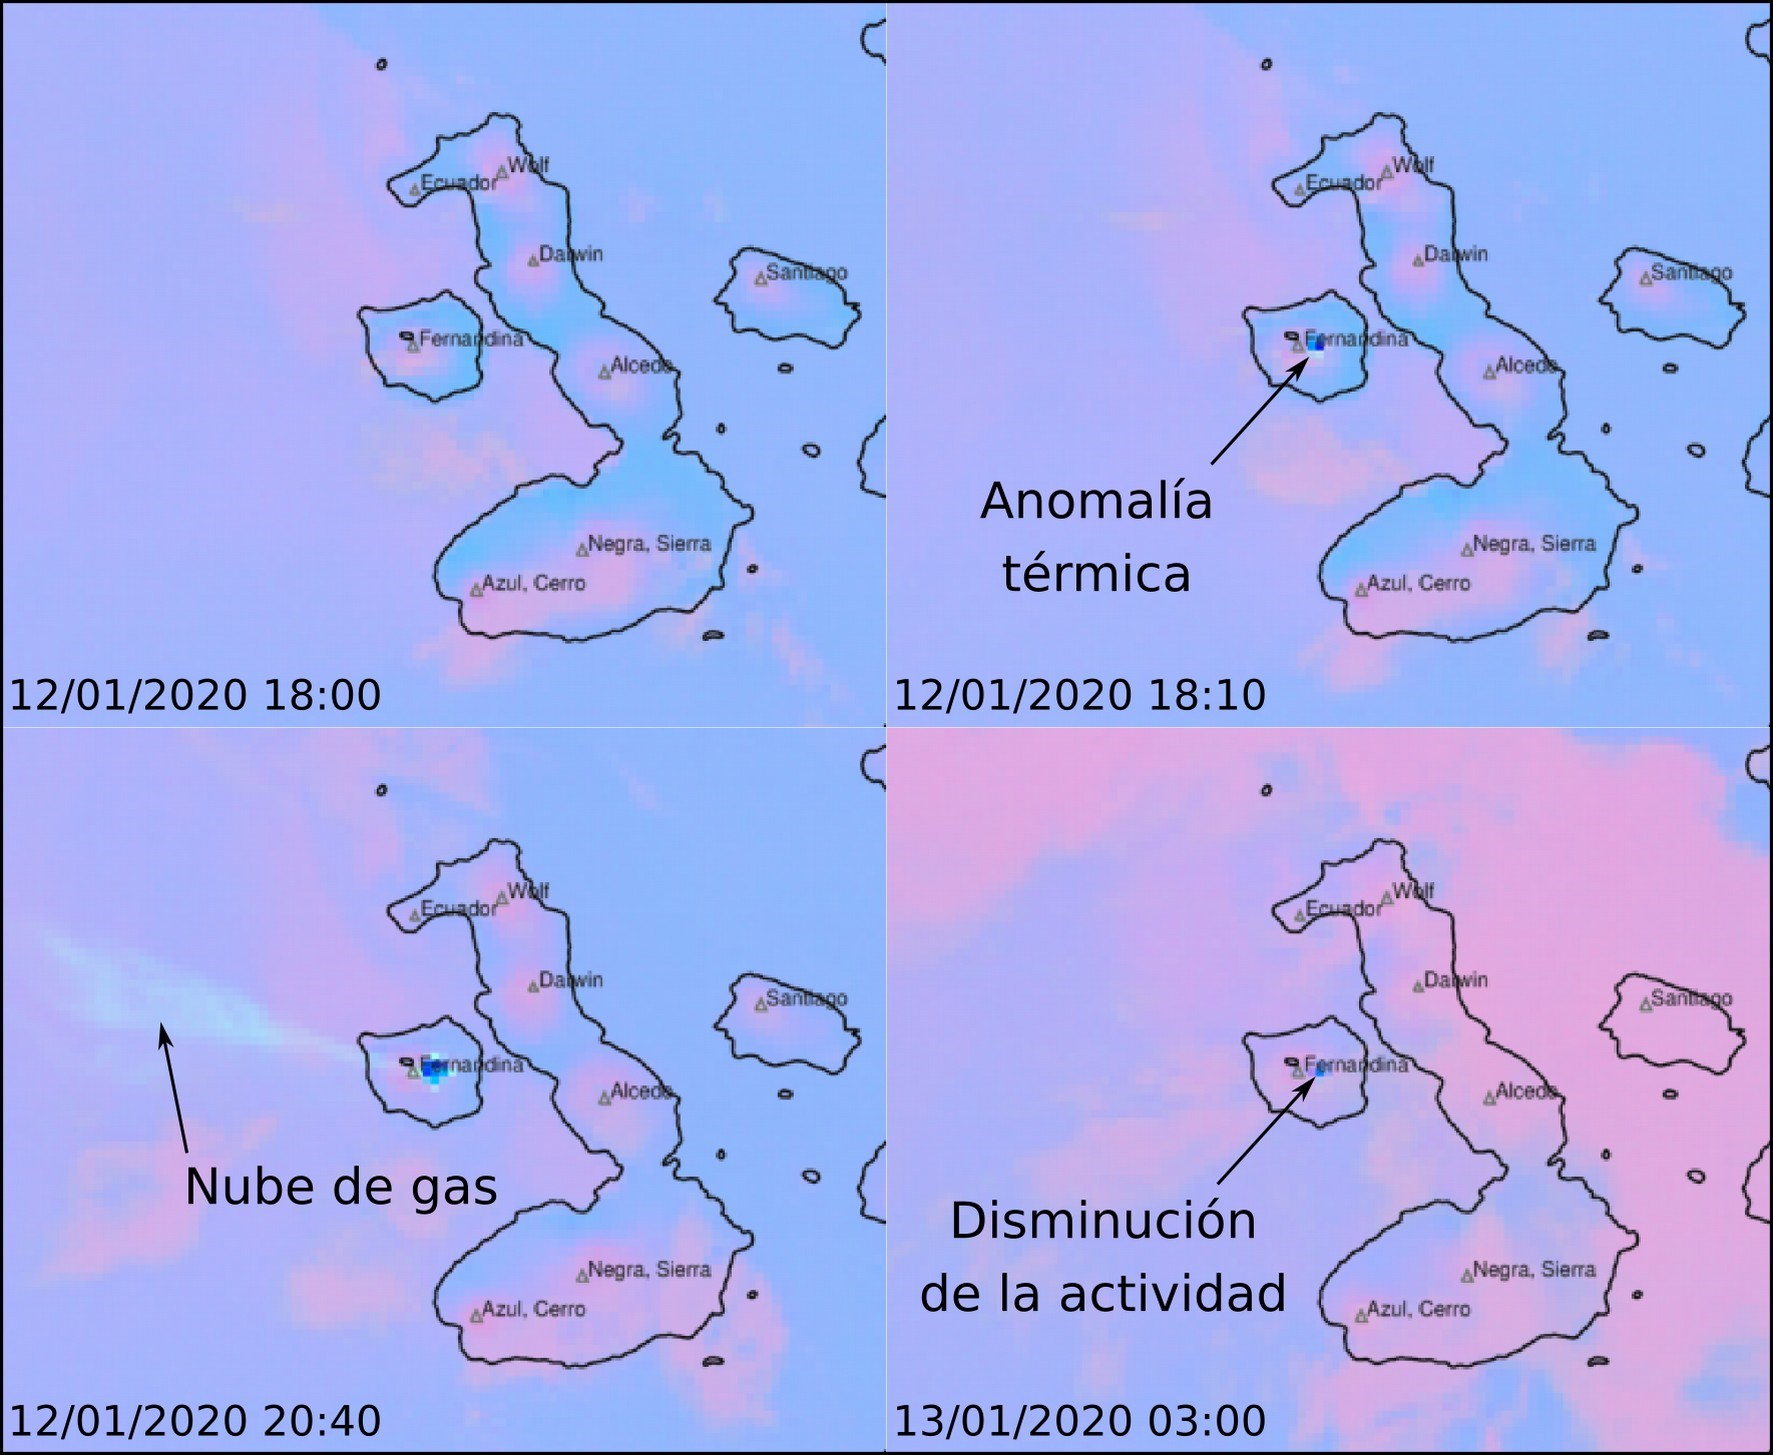
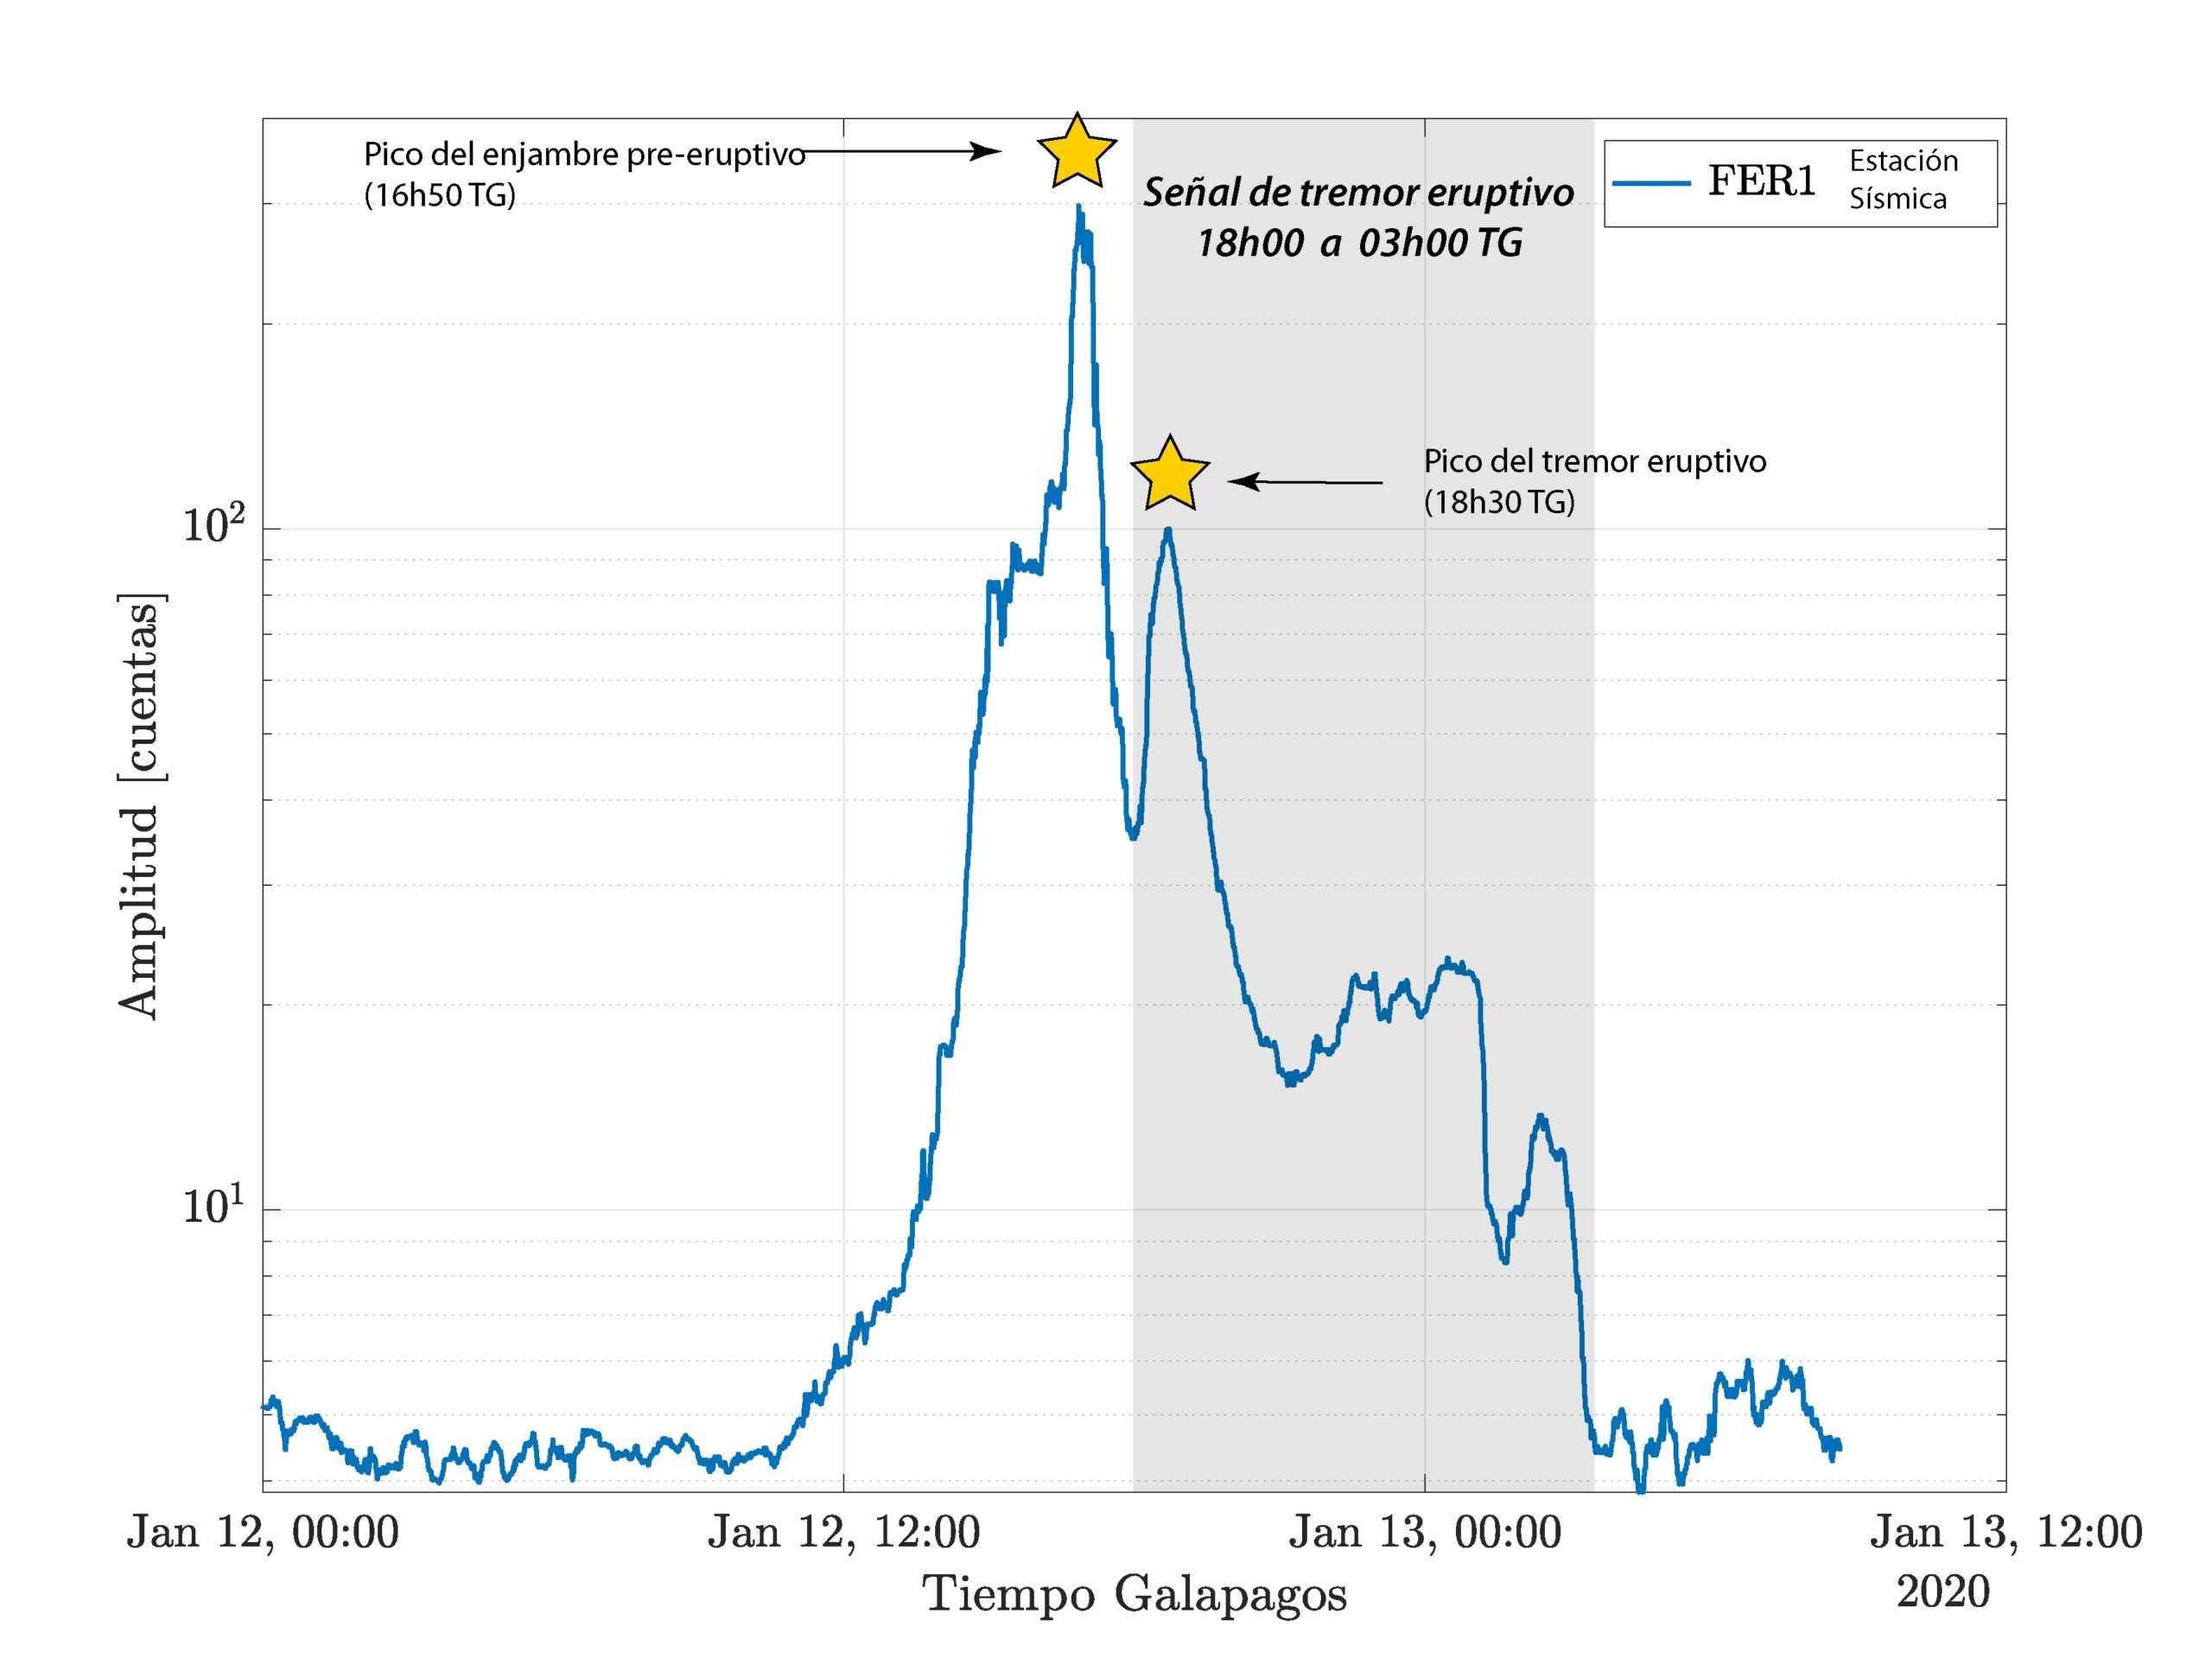
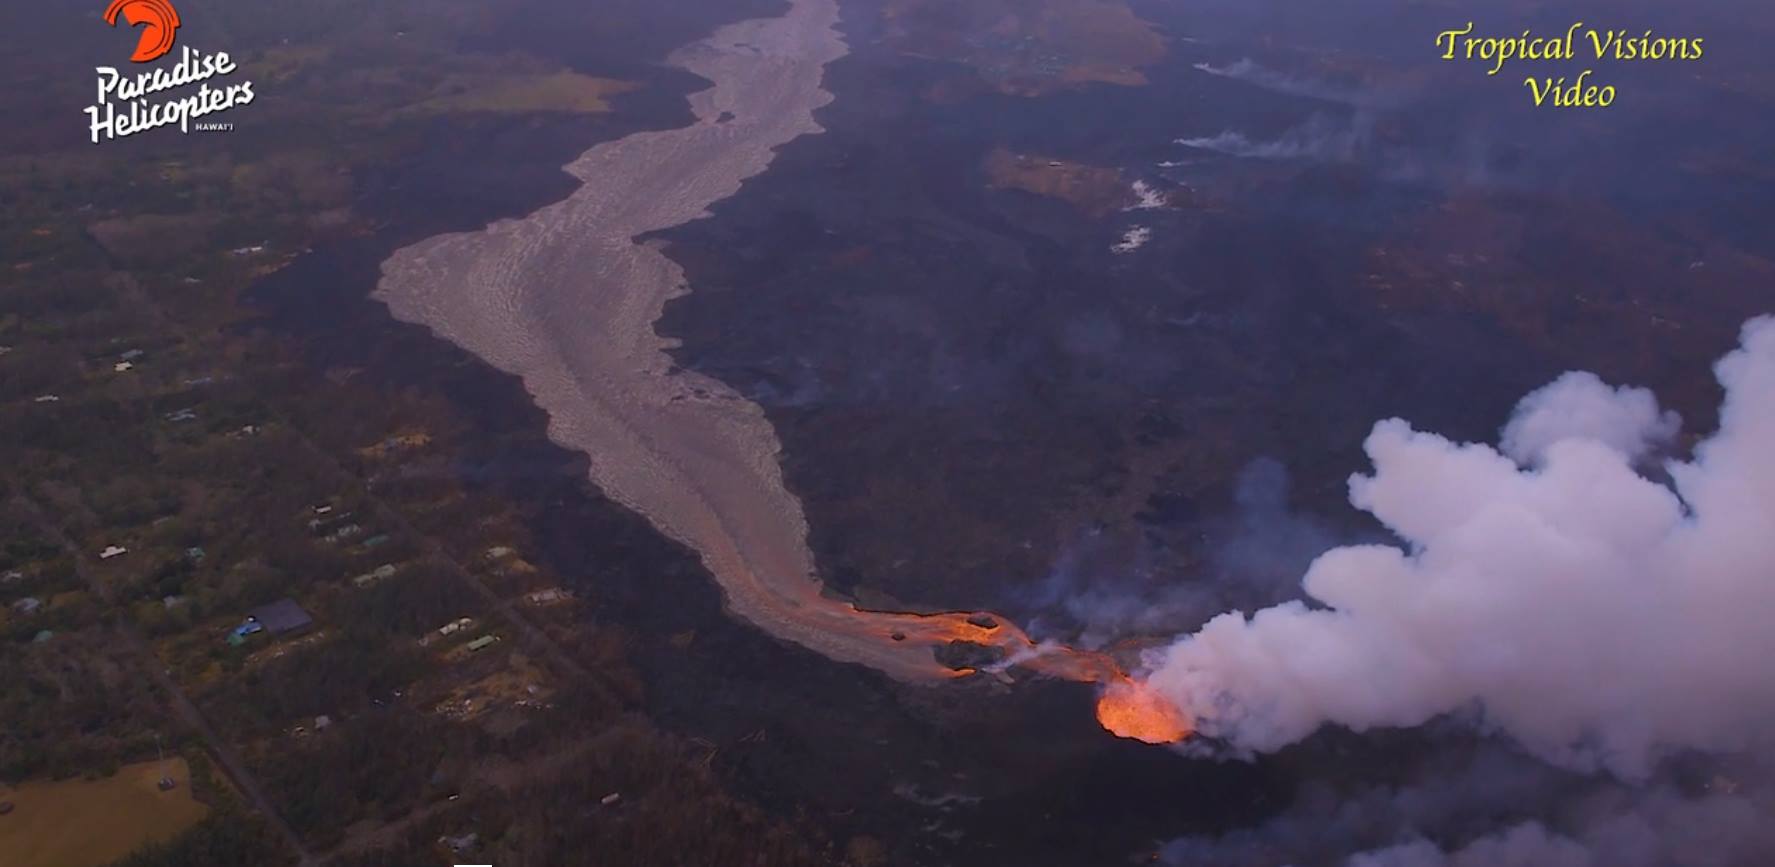
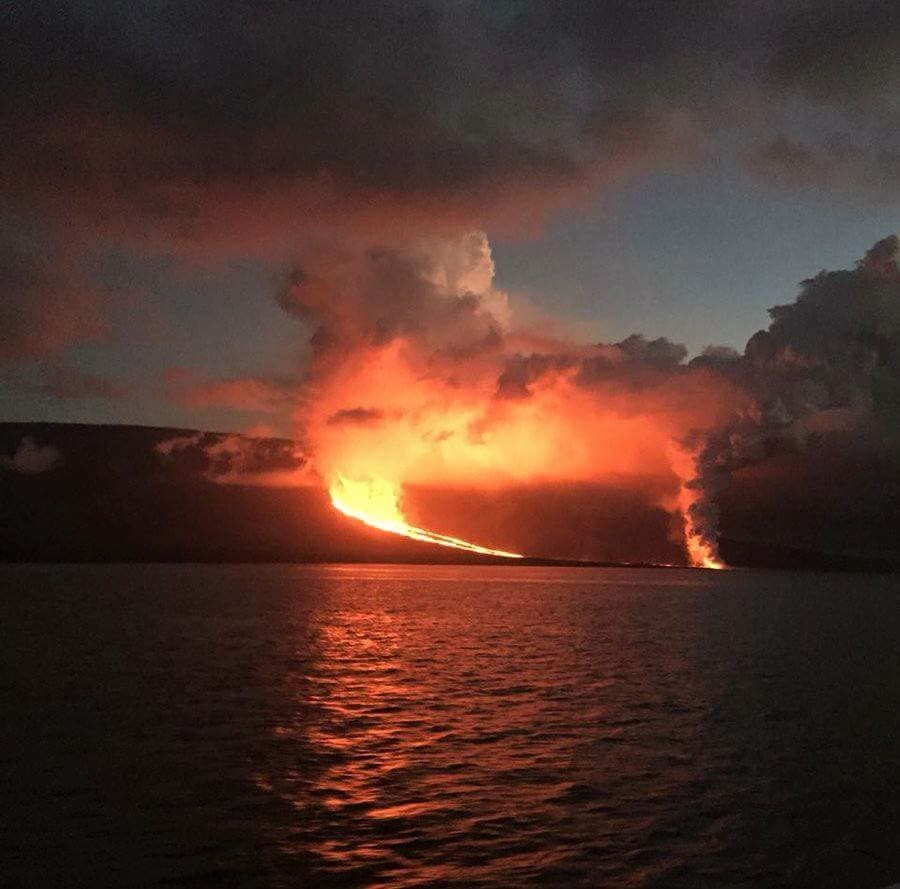
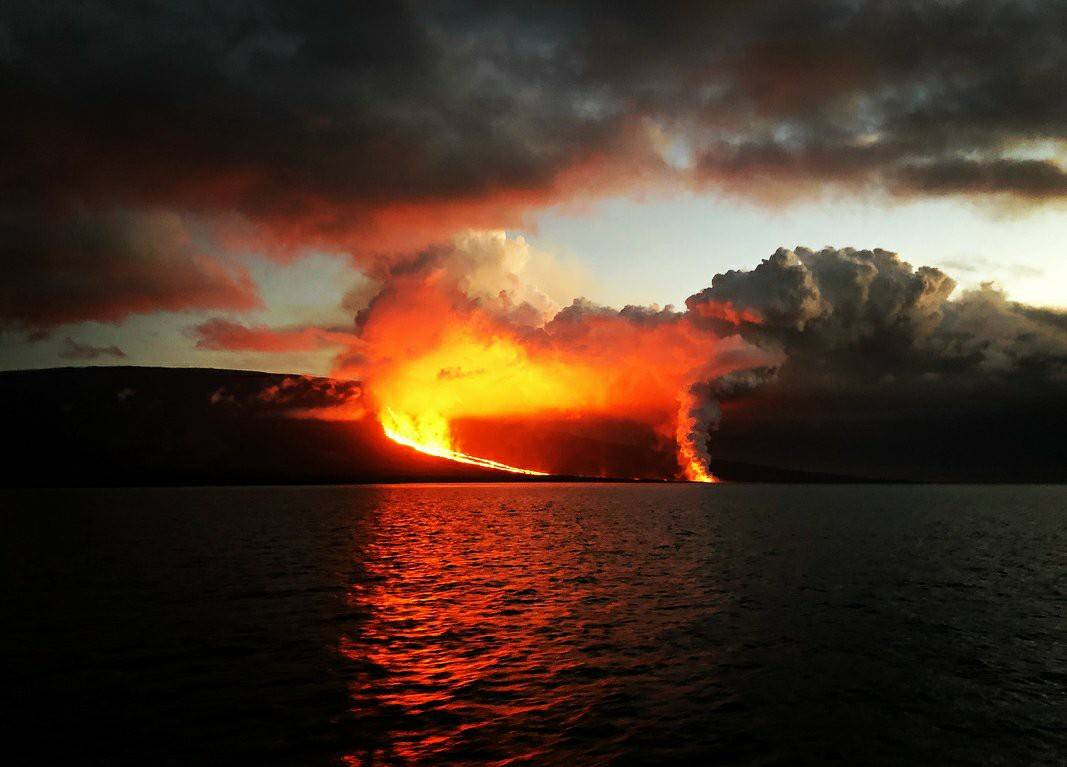
The Fernandina volcano presented its last eruptive process on January 12, 2020, which lasted about 9 hours and was characterized by the opening of a circumferential crack located under the eastern edge of the caldera where lava flows were emitted towards the eastern flank. In addition, a cloud of gas was generated which reached a maximum height of 3.5 km above sea level, as reported in Special Report No 2-2020.
Technical-scientific annex
Seismicity.
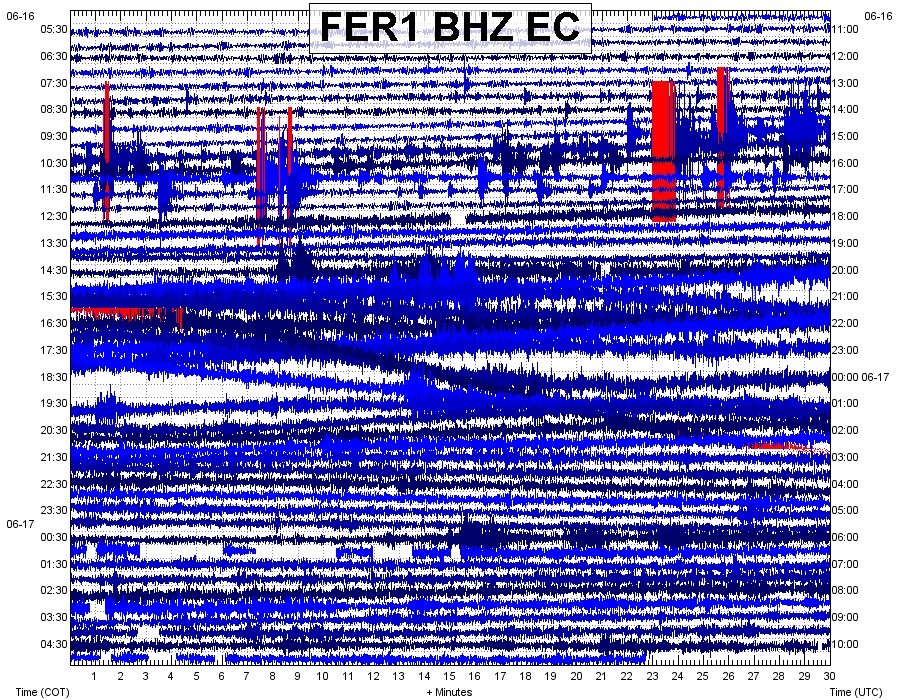
The temporal evolution of the magnitude of the earthquakes located under the volcano indicates that Fernandina is still in agitation (Figures 2a-c). Most of the activity is in or near the caldera. The depth of these events is mainly superficial, although there have sometimes been deeper events (more than 10 km deep). So far, the earthquakes detected last week have reached M 4.2, and none have been felt by the closest populations located on Isabela Island.
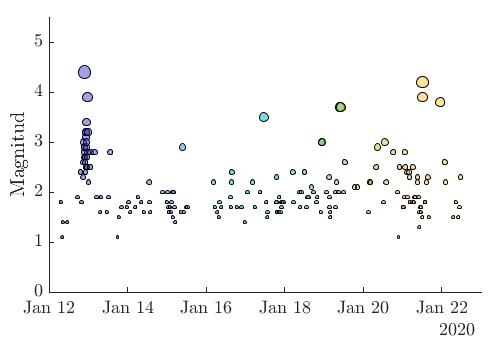
Figure 2a: Temporal evolution of the magnitude of earthquakes detected under the Fernandina volcano. The size of each symbol corresponds to the magnitude of the event. The color of each symbol corresponds to the progression over time of the activity.

Figure 2b: Temporal evolution of the depths of earthquakes located under the Fernandina volcano. The size of each symbol depends on the magnitude of the event. The color of each symbol determines the evolution over time of the activity.
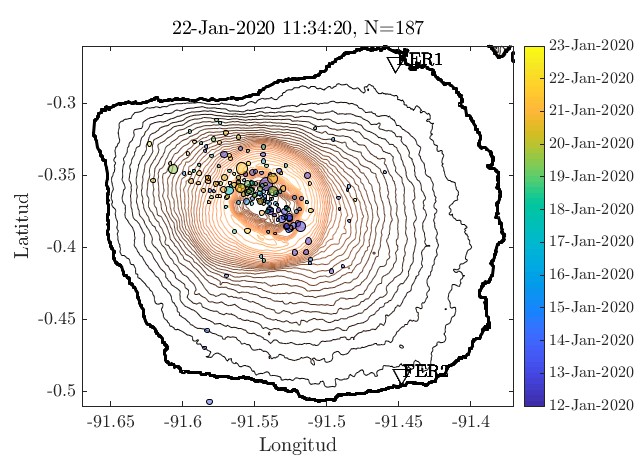
Figure 2c: Location of earthquakes detected under the Fernandina volcano. The size of each symbol depends on the magnitude of the event. The color of each symbol determines the evolution over time of the activity.
Thermal anomalies and gas clouds
Since the climax of the eruption on January 13 at 3 a.m. (Galapagos time), no thermal anomaly or gas emission on the volcano has been detected thanks to the available remote sensors.
Deformation
The processing of Sentinel-1 satellite images between January 2019 and January 2020 indicates inflation patterns with a total displacement greater than 30 cm. In addition, the analysis of the period between December 3, 2019 and January 10, 2020 (two days before the eruption) shows a distortion of 2.3 cm in the satellite line of sight (LOS). The largest deformation, deflation of approximately 35 cm (LOS), was recorded during the eruption in the lava emission zone east of the caldera. During the same period, inflation was observed on the south-southwest flank of the 21.8 cm volcano (Figure 3). For the same sector between January 15 and January 21, there is a deformation of 5.79 cm.
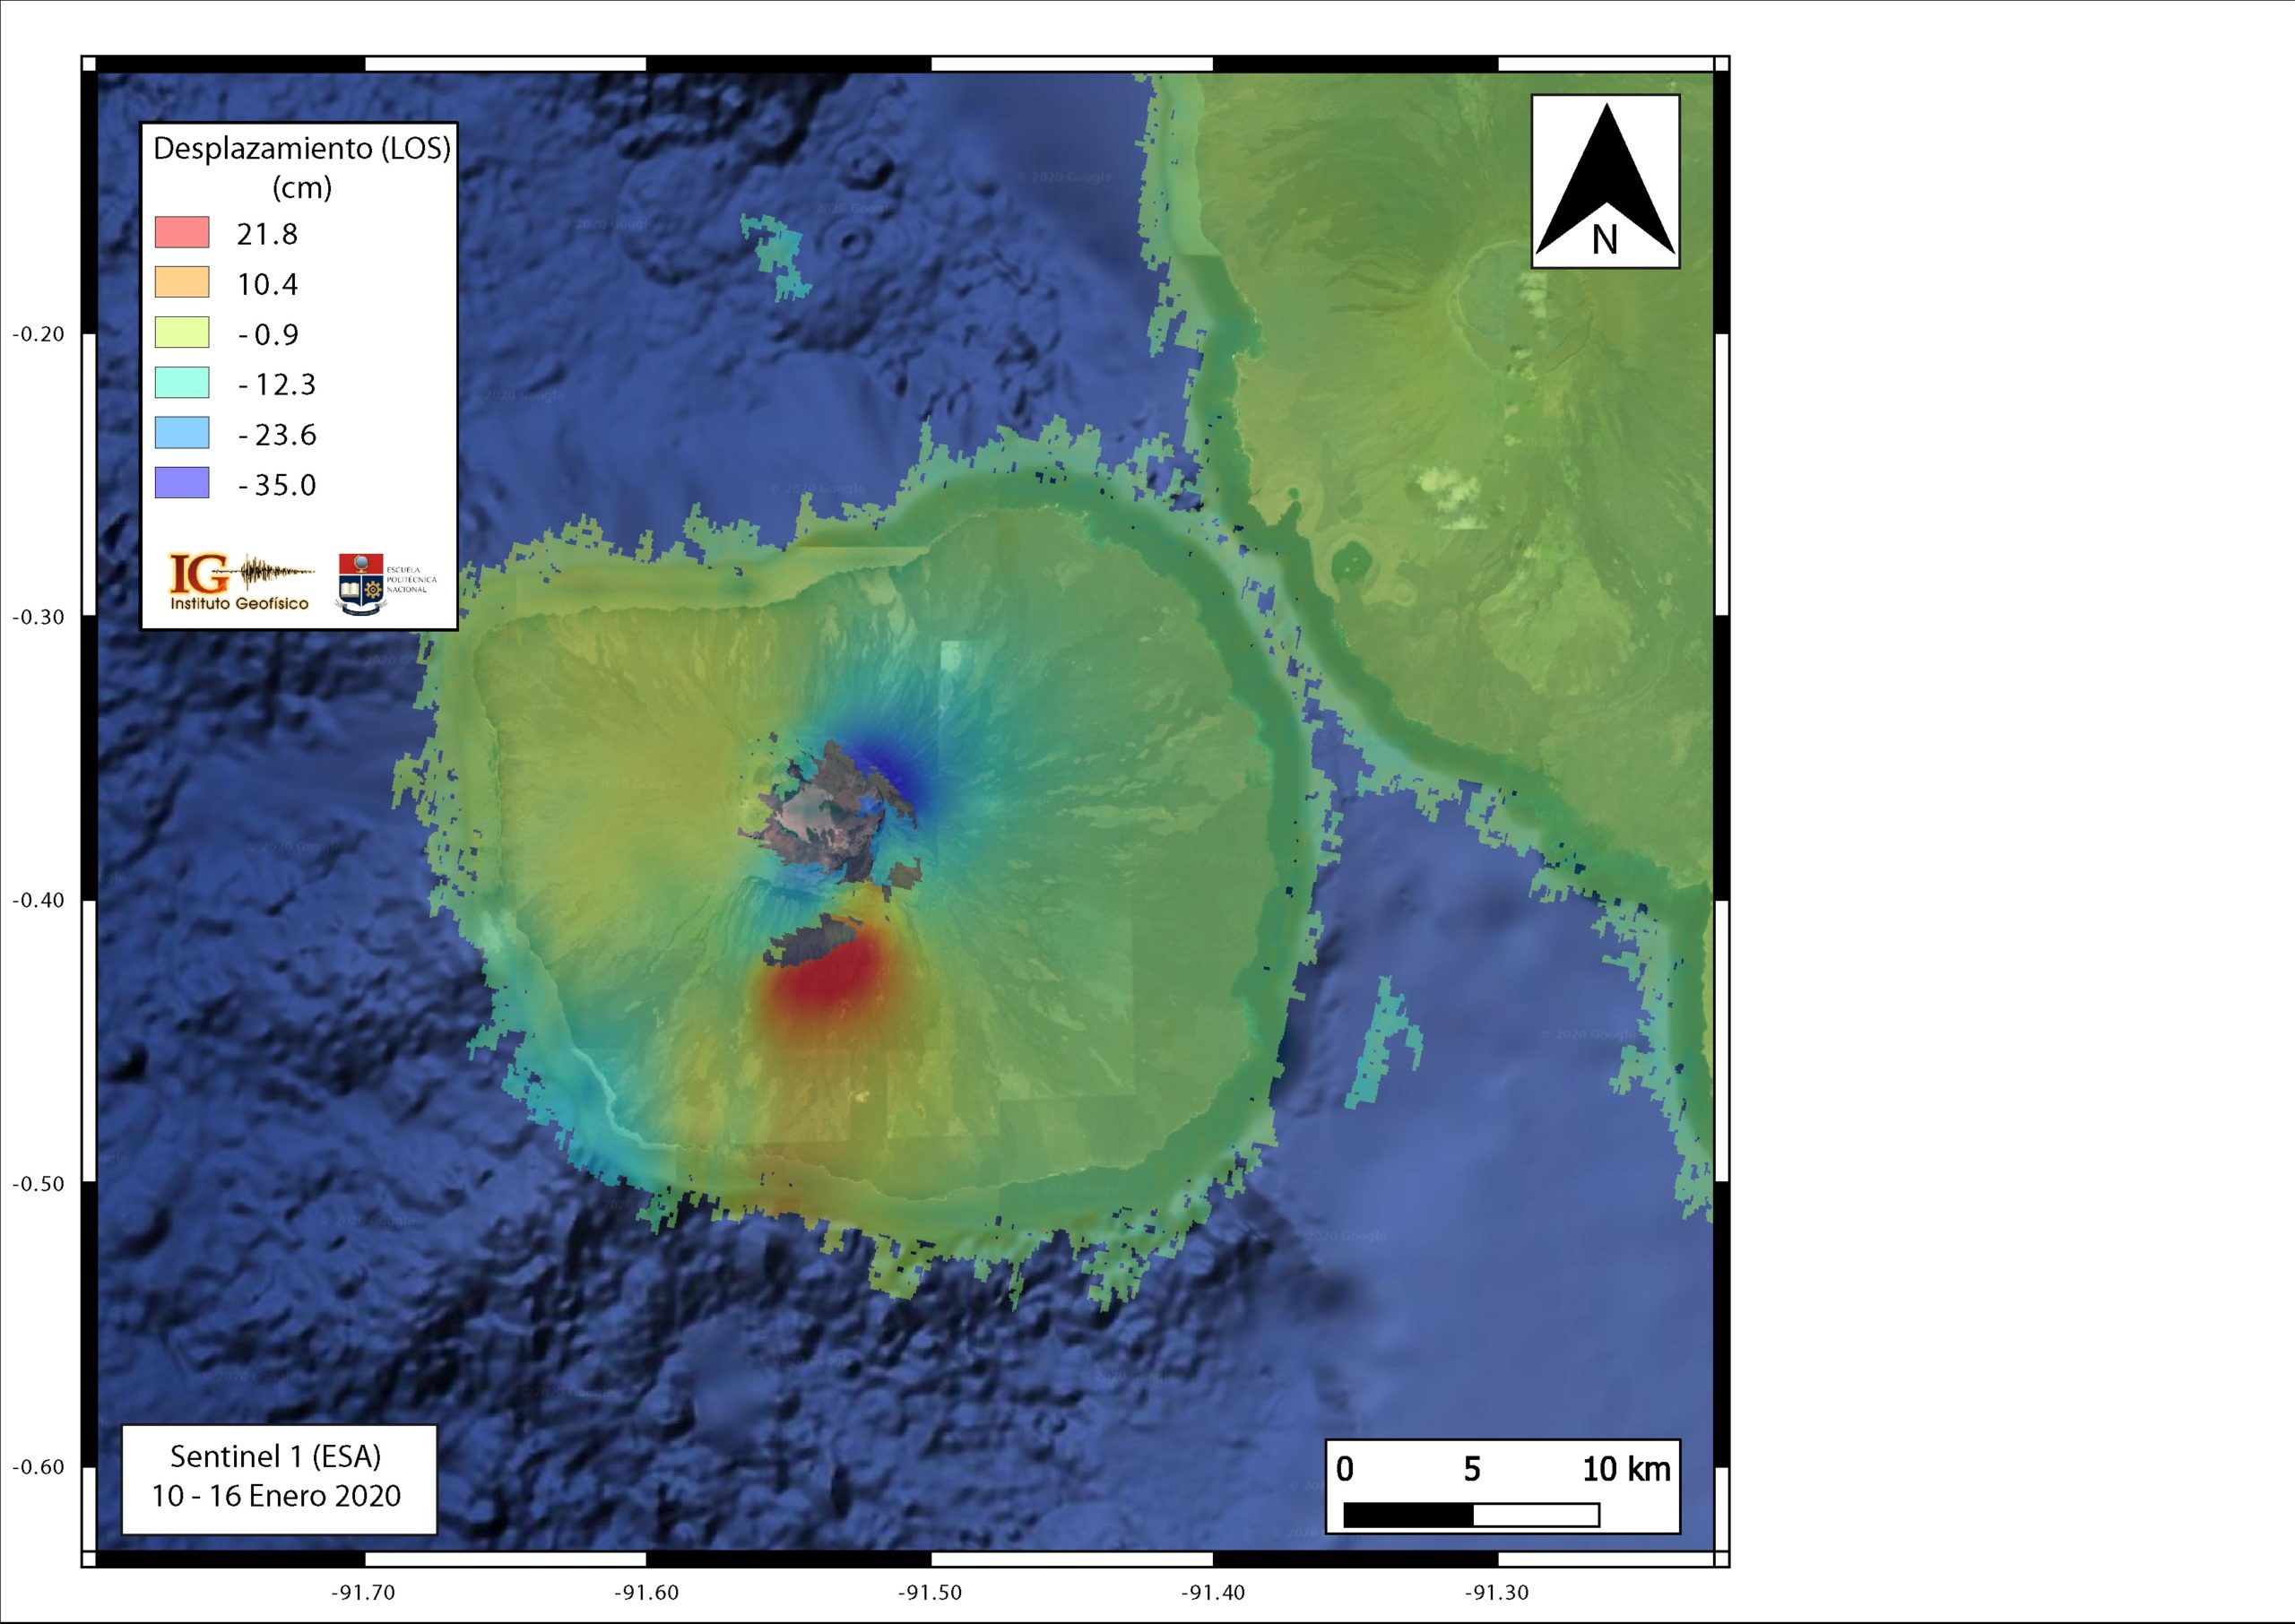
Figure 3. Map of ground displacement in the line of sight (LOS) in the Fernandina Island region between January 10 and 16, 2020, showing the deformation that caused the January 12, 2020 eruption. with ISCE, P. Espín).
Eruptive scenarios:
Based on historical and geological data from the Fernandina volcano eruptions, several scenarios for a possible eruption should be considered. In the case of shield-type volcanoes, such as Fernandina, eruptions are characterized as being mainly Hawaiian, with lava flows that can come from circumferential cracks (parallel to the caldera), radial (perpendicular to the caldera) or vents inside the caldera. In the event of a new eruptive phase on the Fernandina volcano, the following scenarios are considered, classified from most likely to least likely:
1. Location.
1a Historically, the eruptive activity of the Fernandina volcano has alternated between eruptions of circumferential and radial cracks (Bagnardi et al. 2013). The eruption of January 12 to 13, 2020 is circumferential, the next activity is likely to occur due to a radial crack. In addition, according to soil deformation records, it is possible that this crack is open on the south-southwest flank of the volcano where inflation is recorded, an area where the eruptions of 1995 and 2009 occurred.
1.b. The possibility of a new circumferential eruption, inside the caldera or underwater, is not excluded either.
2. Size of the eruption.
2a Most of the historical eruptions in Fernandina are small (<20 million m³). The size of the deformation recorded in the volcano suggests an equally small scenario.
2.b. Medium-sized eruptions (20-200 million m³) have occurred in the past weeks, if not months, but are less frequent.
2.c. Finally, the possibility of a major eruption (> 200 million m3) as happened in 1968 is not excluded, however, the probability of such events is still low.
3. Volcanic phenomena.
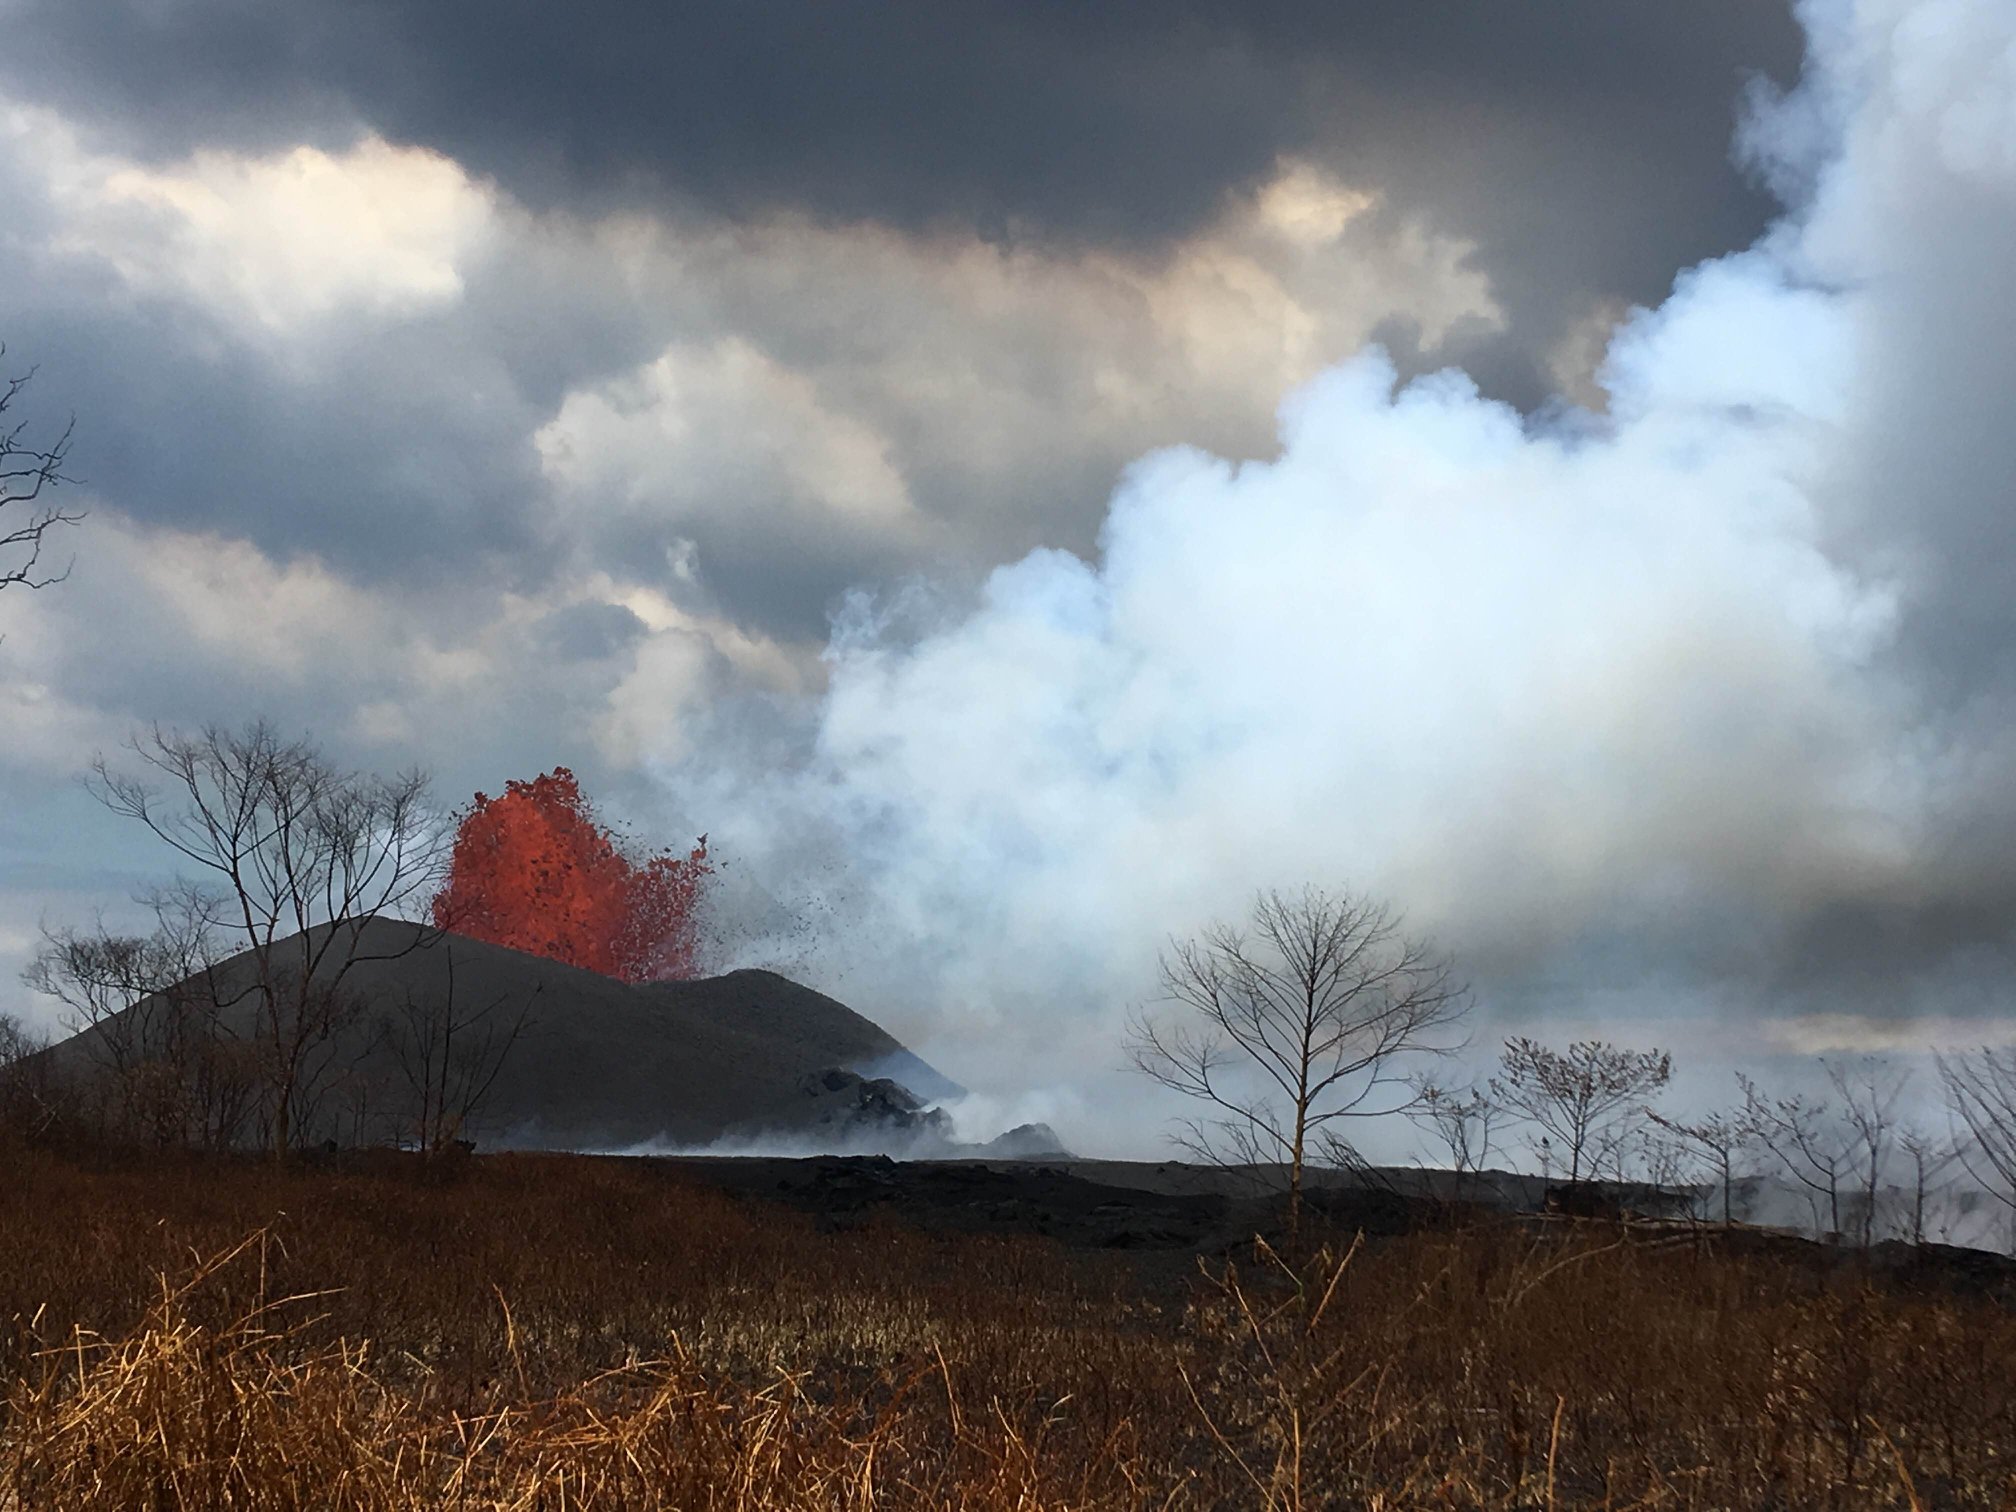
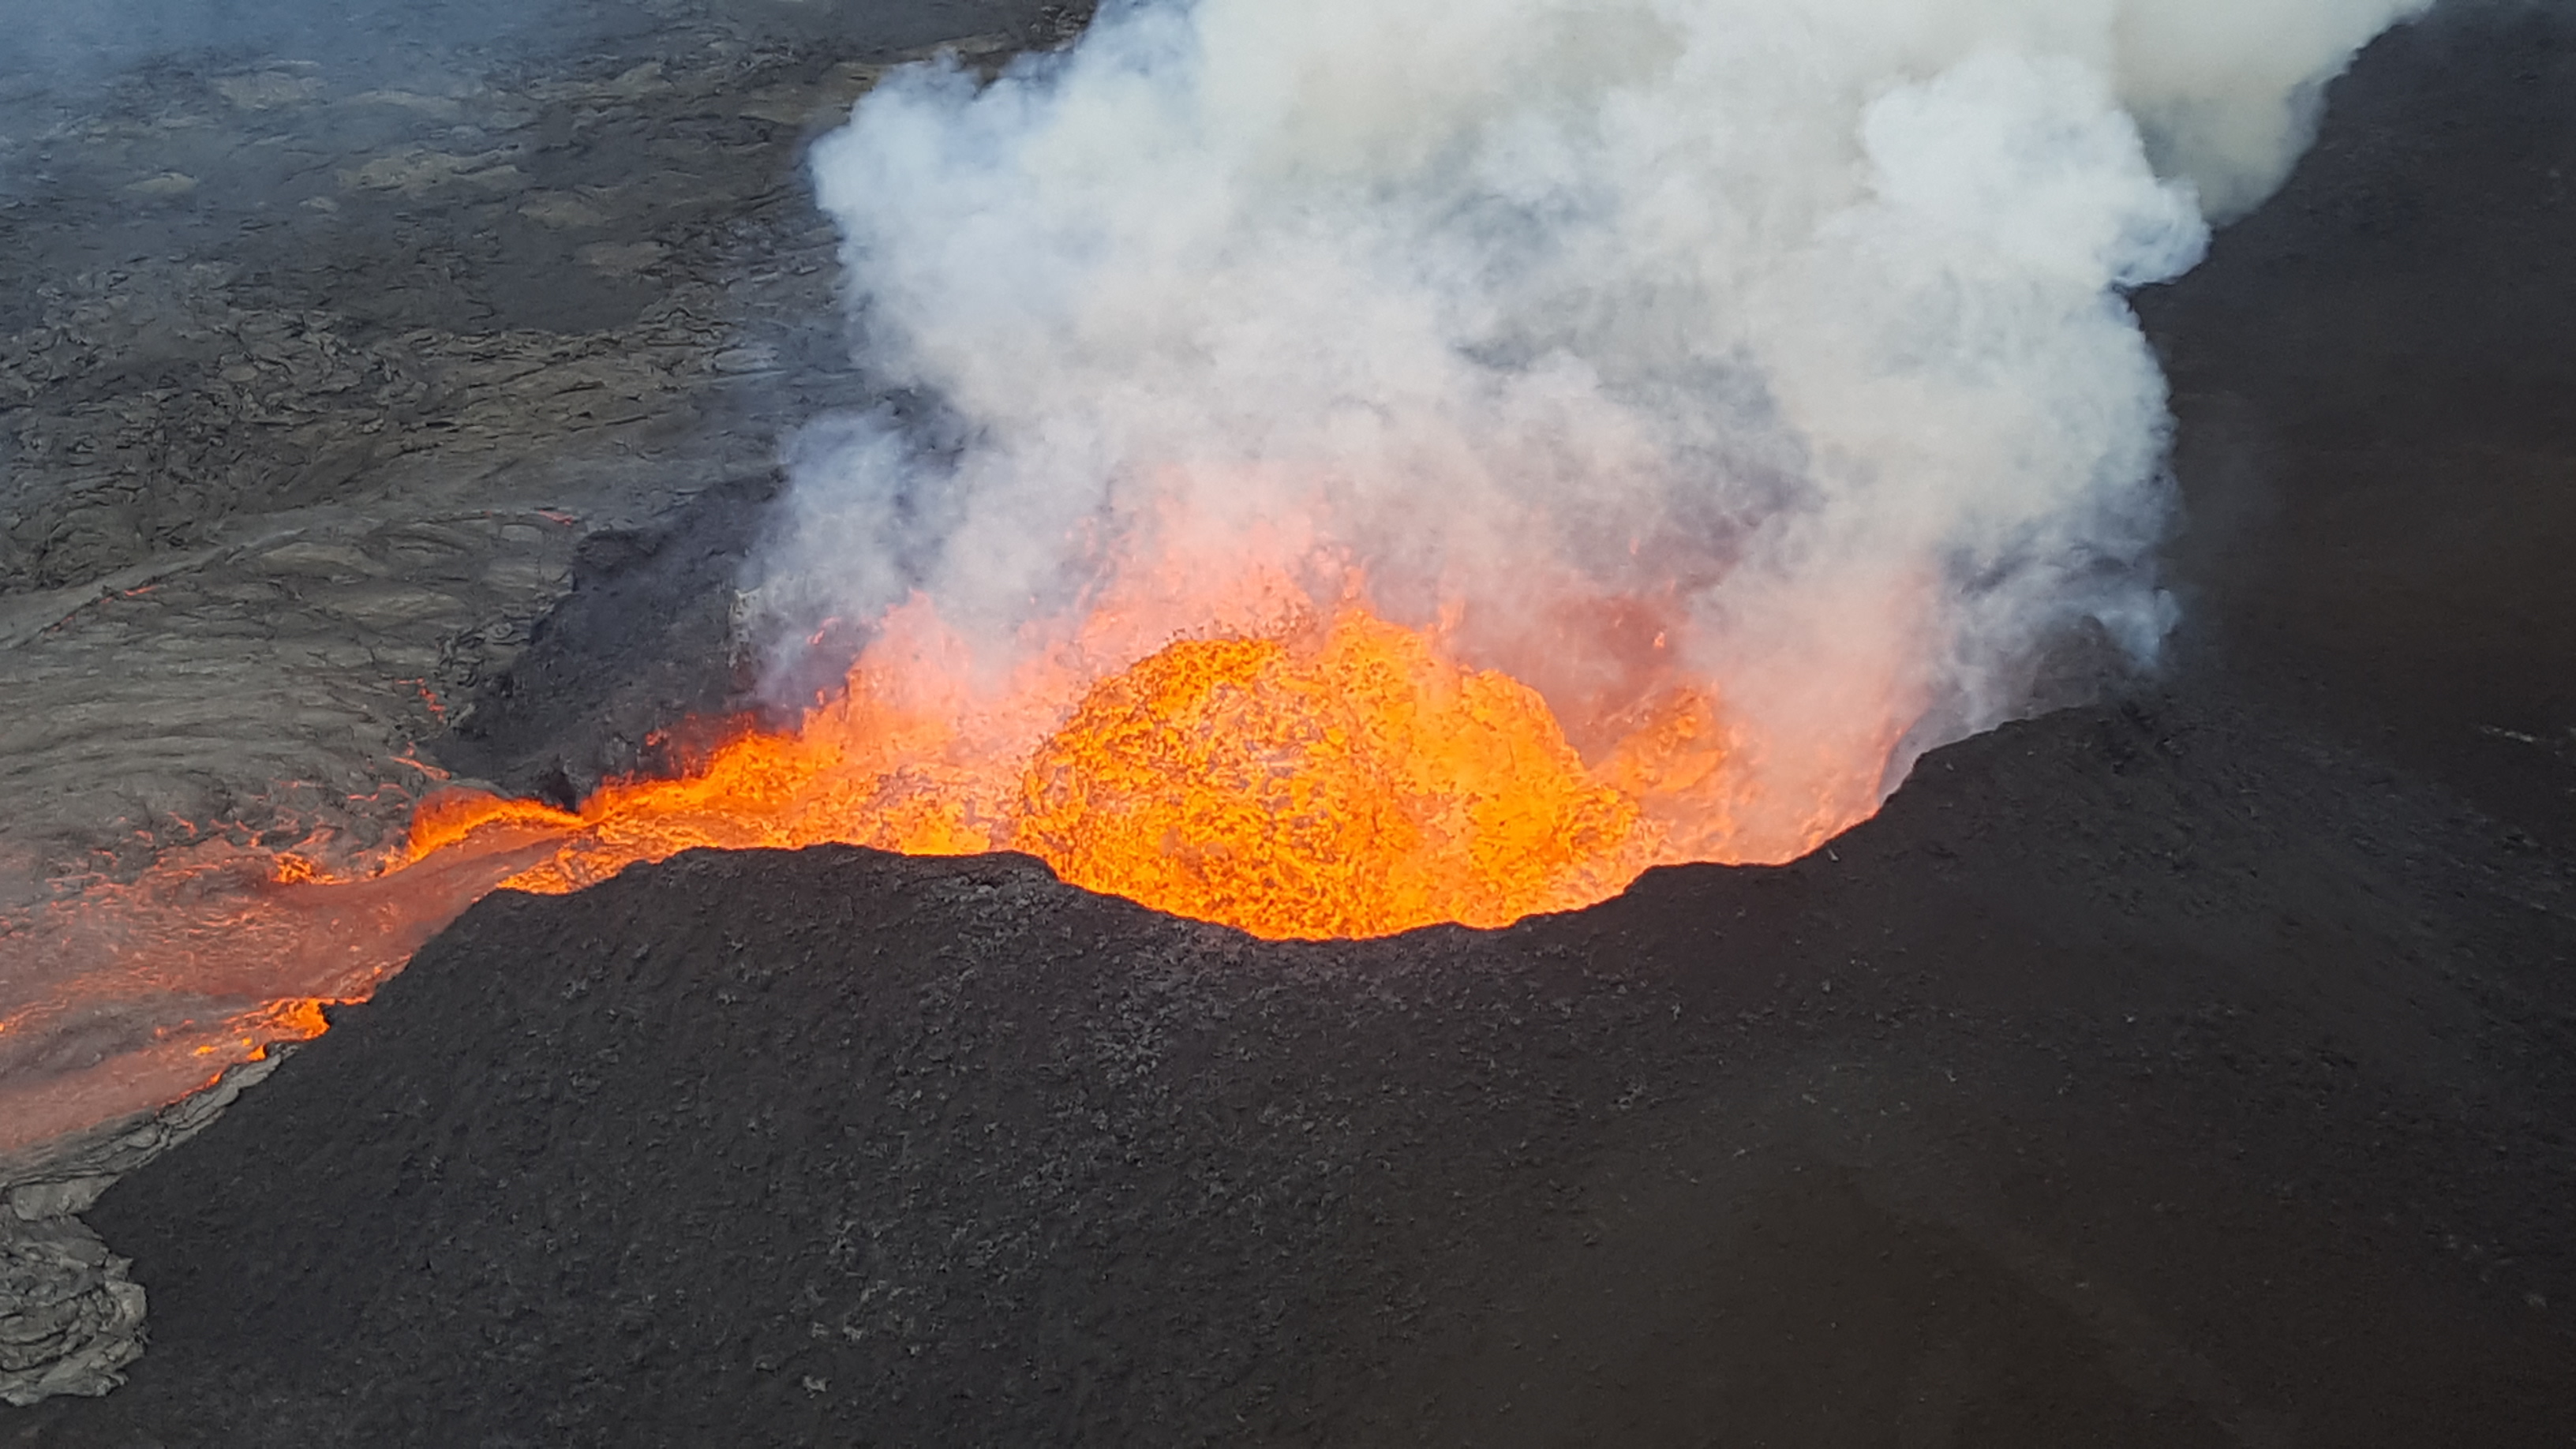
During the Fernandina eruptions, the most common phenomena are fountains, lava flows and clouds of gas with low or moderate ash content. Lava flows can cause fires as happened in 2017.
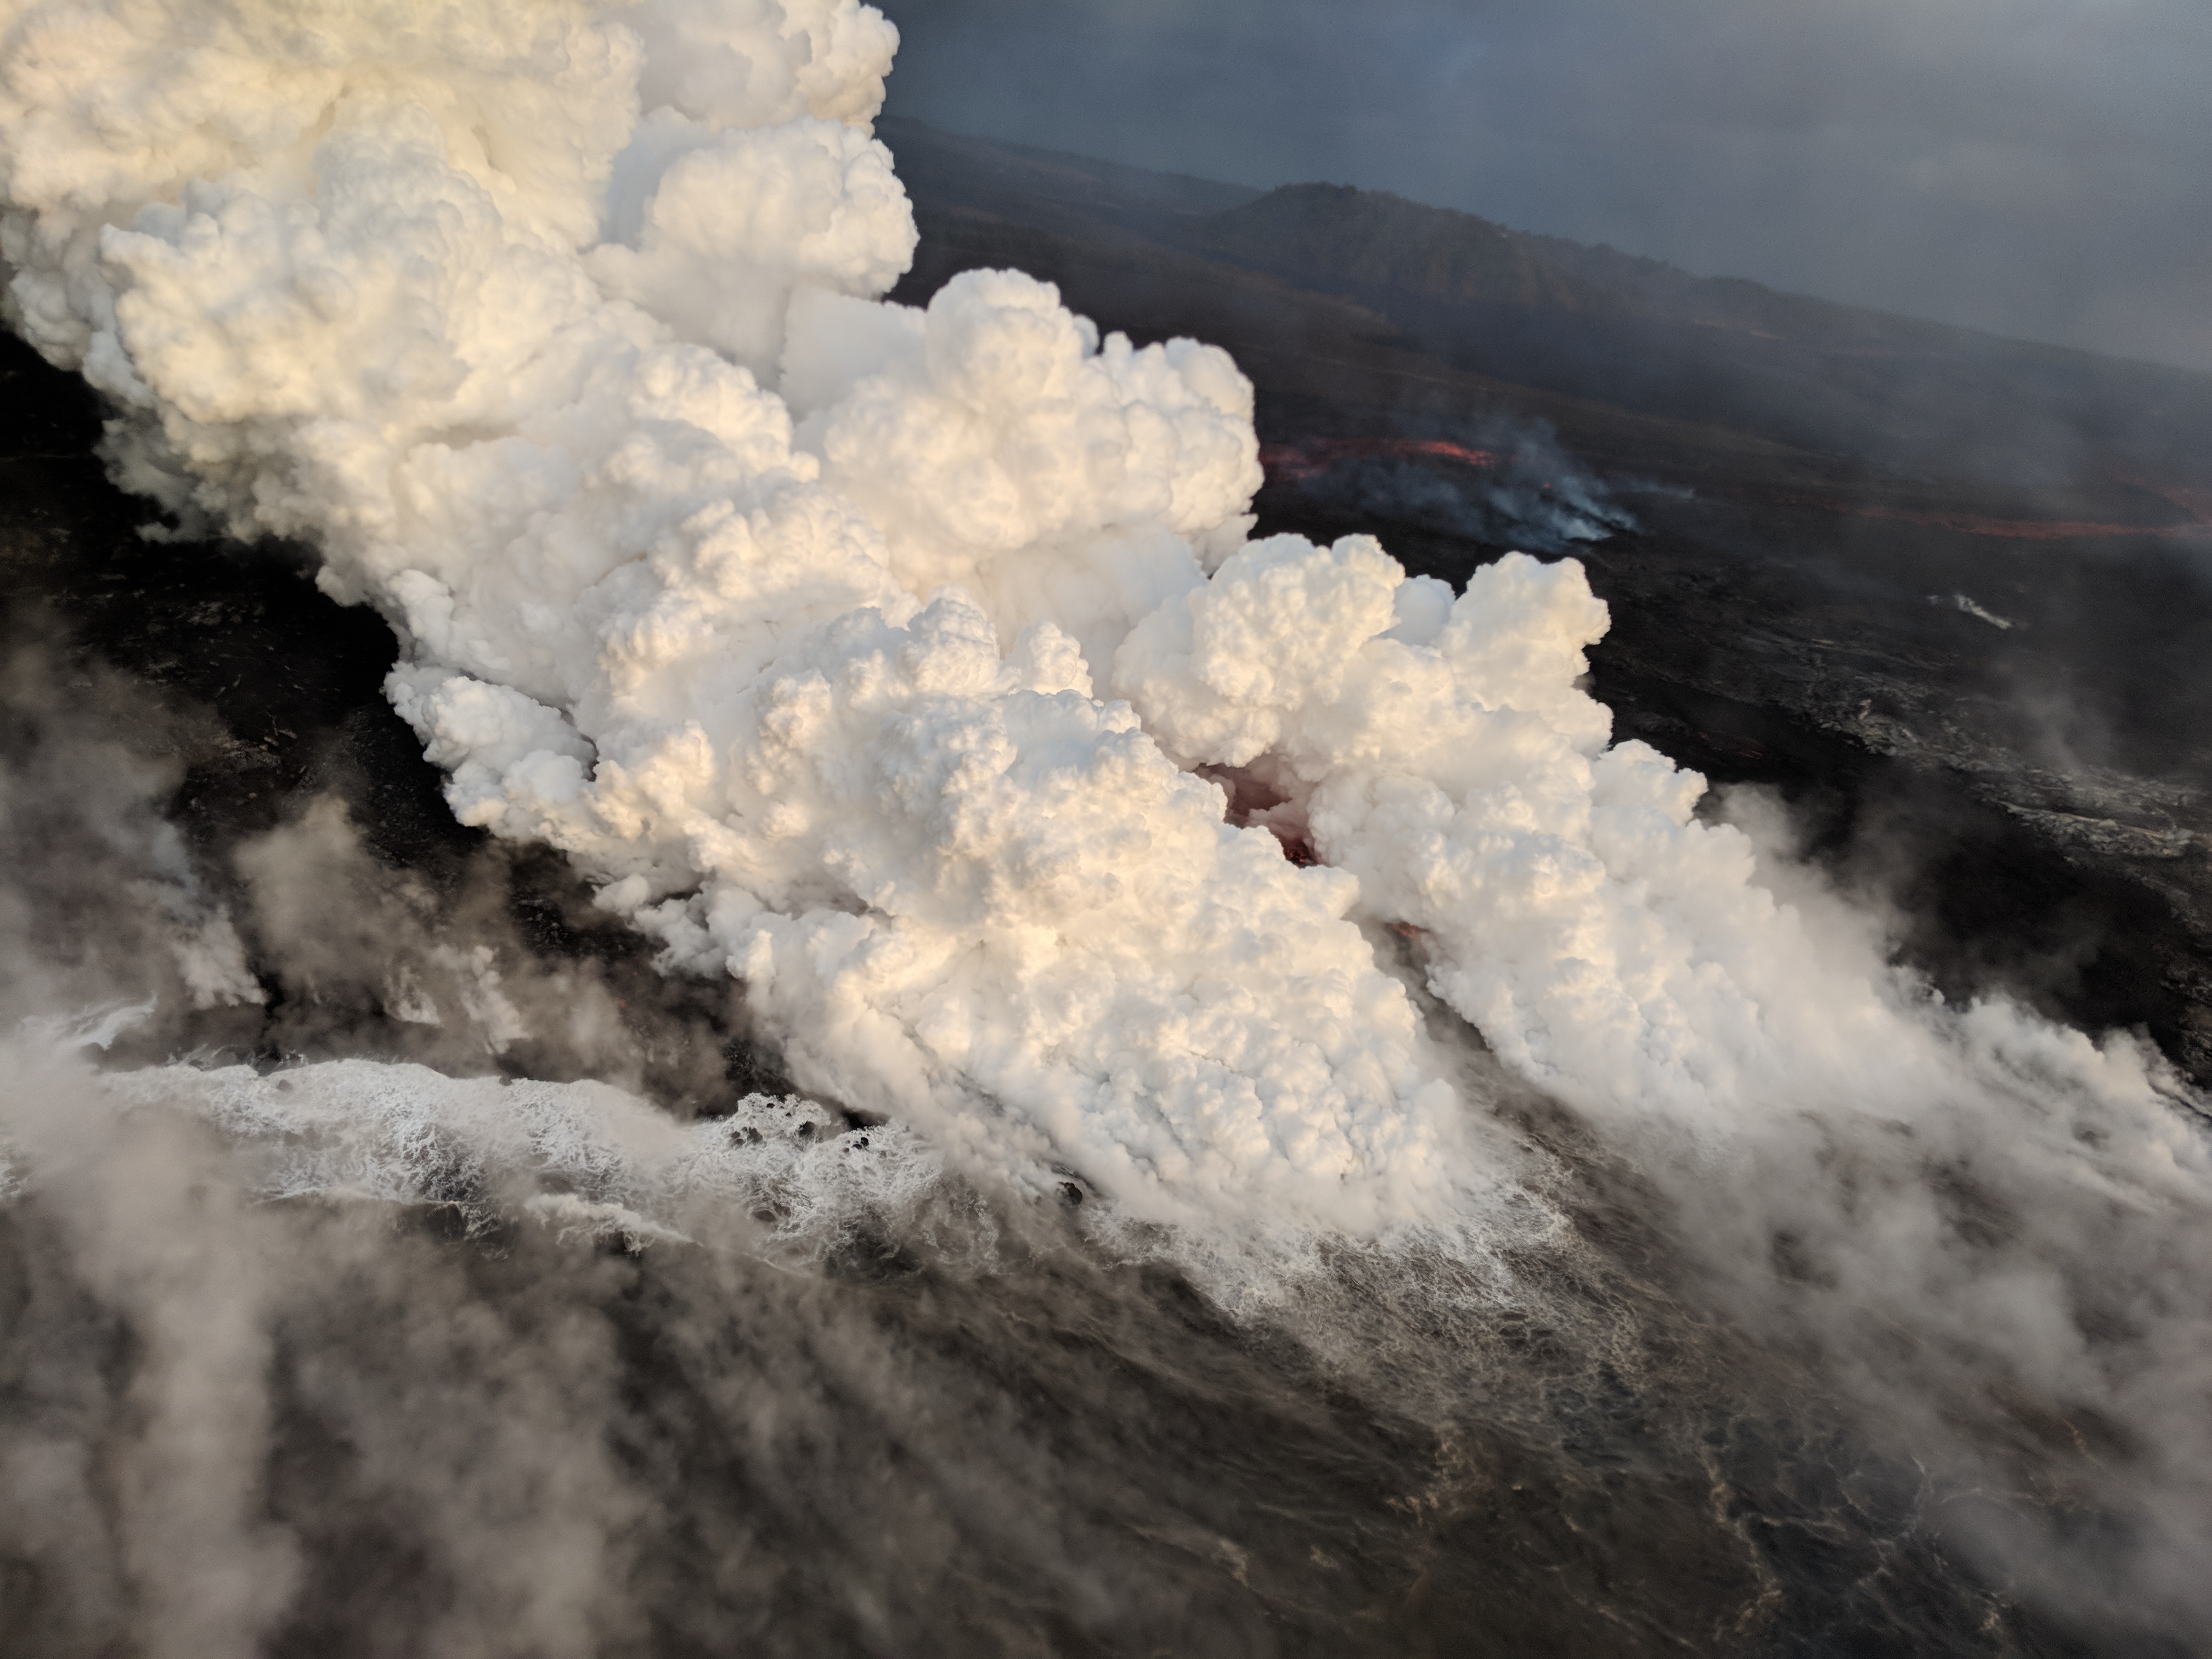
3.a. In the event of a radial eruption on the side of the volcano, lava is likely to reach the coast, as happened in 2018, 2009 and 1995.
3.b. In the event of a circumferential eruption near the caldera, lava is likely to descend from the summit of the volcano until the slope breaks without reaching the sea, as happened in 2020, 2017 and 2005.
3c If the eruption occurs in the caldera, the interaction of the lava with the (existing) lagoon can cause violent hydro-volcanic explosions, the emission of large quantities of ash and the formation of burning clouds (or currents pyroclastic density), as happened in 1968.
3.d There is also the possibility of the appearance of a large sliding of the caldera wall, similar to what happened in 1988. These phenomena are rare and mainly affect the area inside the caldera and the upper part of the volcano, although ash clouds can reach populated areas depending on the direction and speed of the wind.
3.e. Fernandina is a volcanic island and its activity can also cause landslides in the coastal area or on the underwater flanks, which can trigger the formation of tsunamis, as happened on the Anak Krakatau volcano in Indonesia in 2018. This scenario is very unusual and nothing indicates that it can occur as part of this eruptive process, however, if this phenomenon is generated, it could have a significant impact on the Galapagos Islands.
Recommendations:
There are no human settlements on Fernandina Island. Due to the predominant west-northwest wind direction, if new columns of gas and ash occur, the populated islands (Isabela, Santa Cruz, Floreana and San Cristóbal) should not be affected, except if the wind changes direction. If lava flows enter the sea, it is recommended to stay away, as explosions and the release of harmful gases can occur when lava comes into contact with cold sea water. In the event of an eruption, it is not recommended to approach the area of the eruption, due to the risk of being affected by eruptive products or secondary phenomena such as fires.
Source : IGEPN. SV, BB, SH, PE, SA, FJV, PR, MFN, SV / Instituto Geofísico / Escuela Politécnica Nacional.
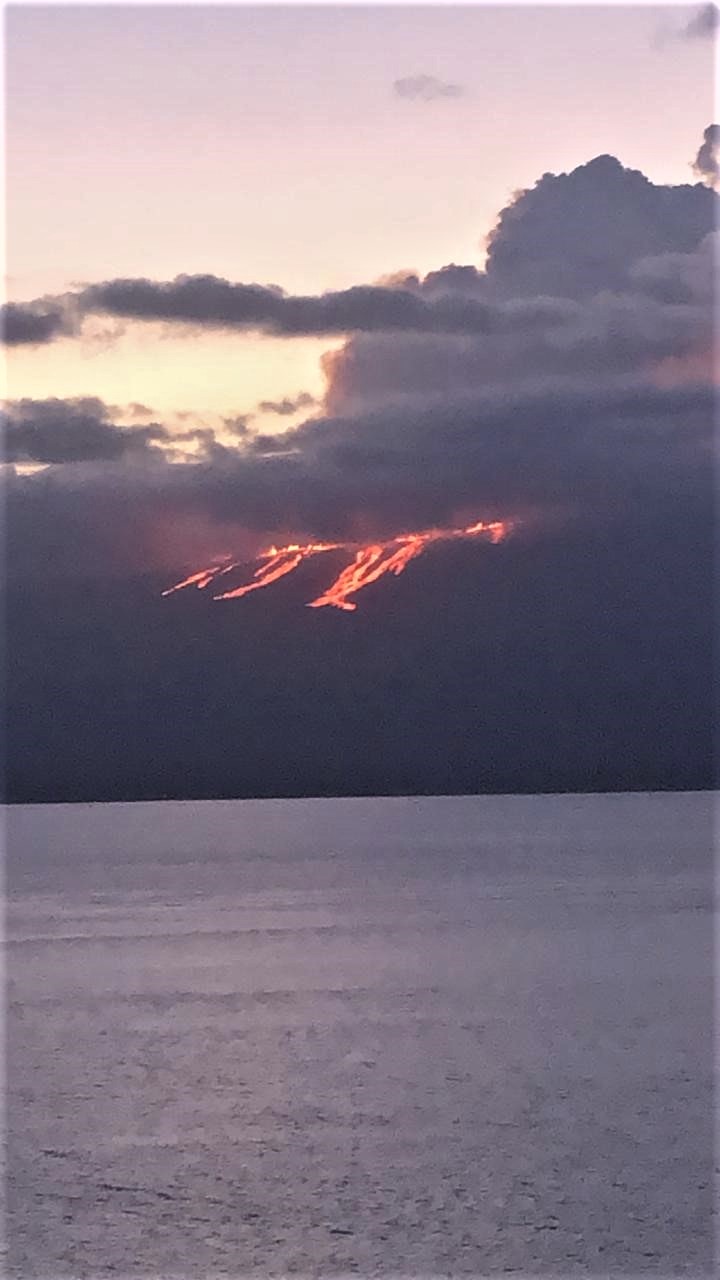
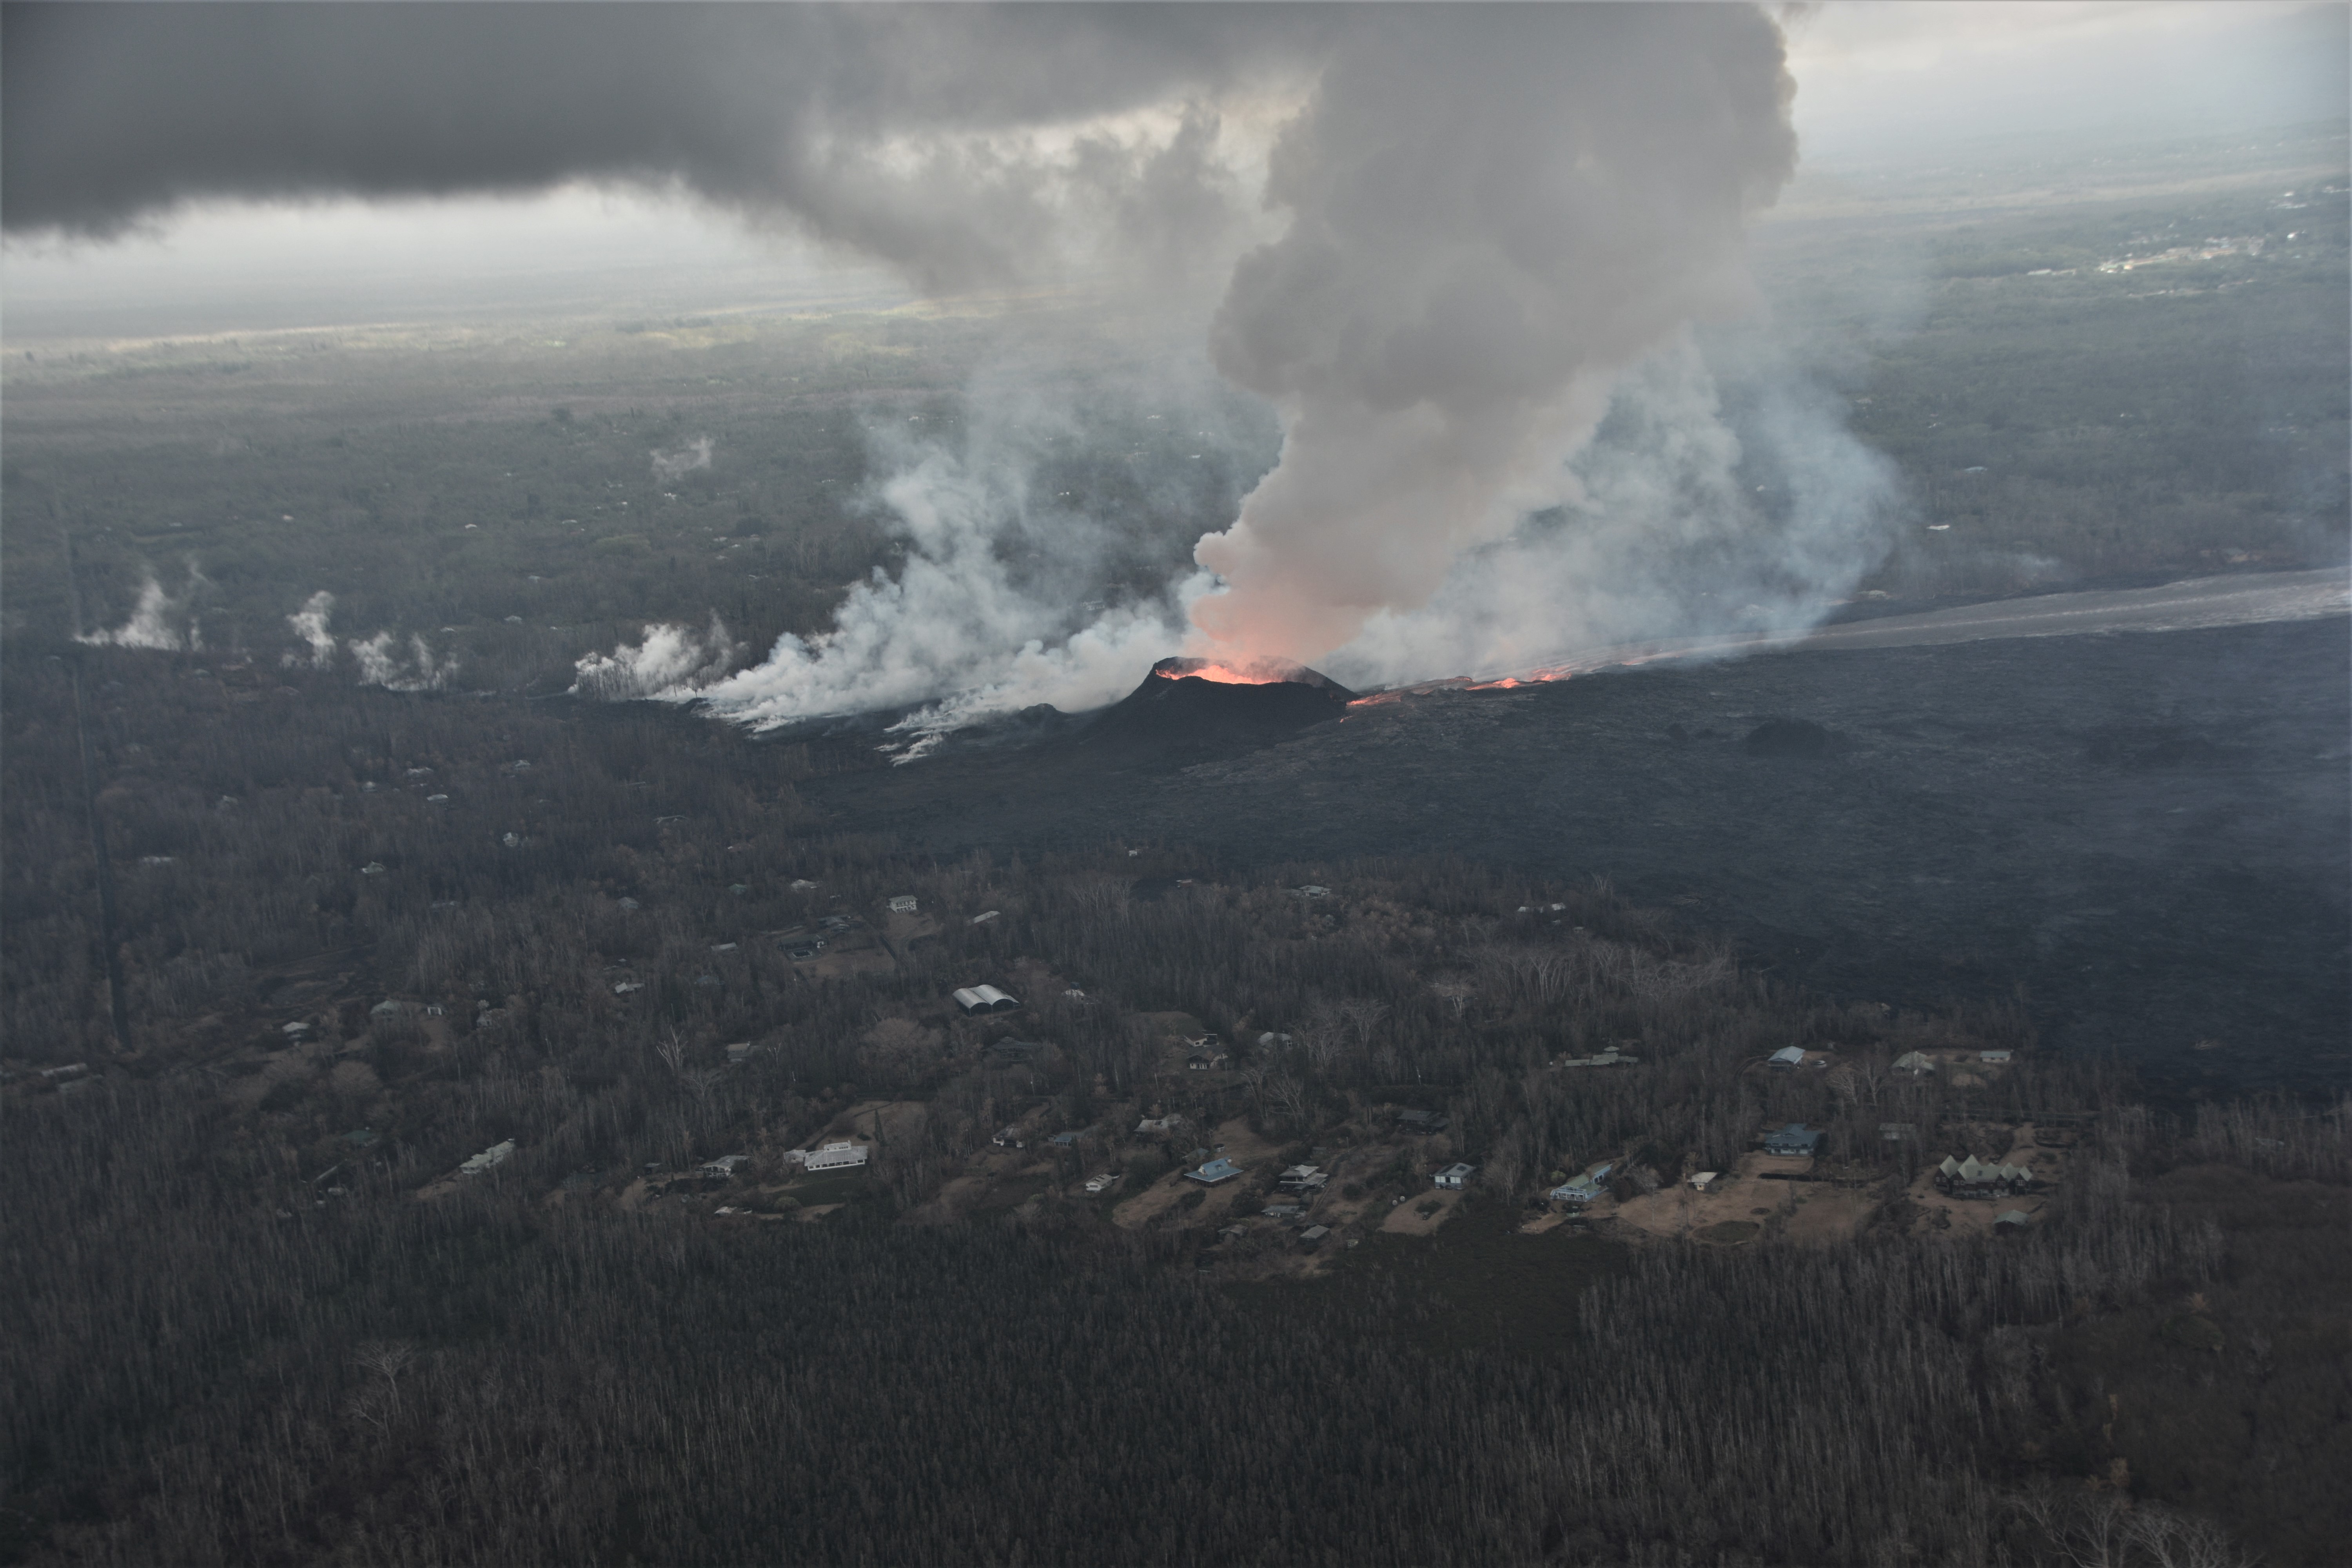
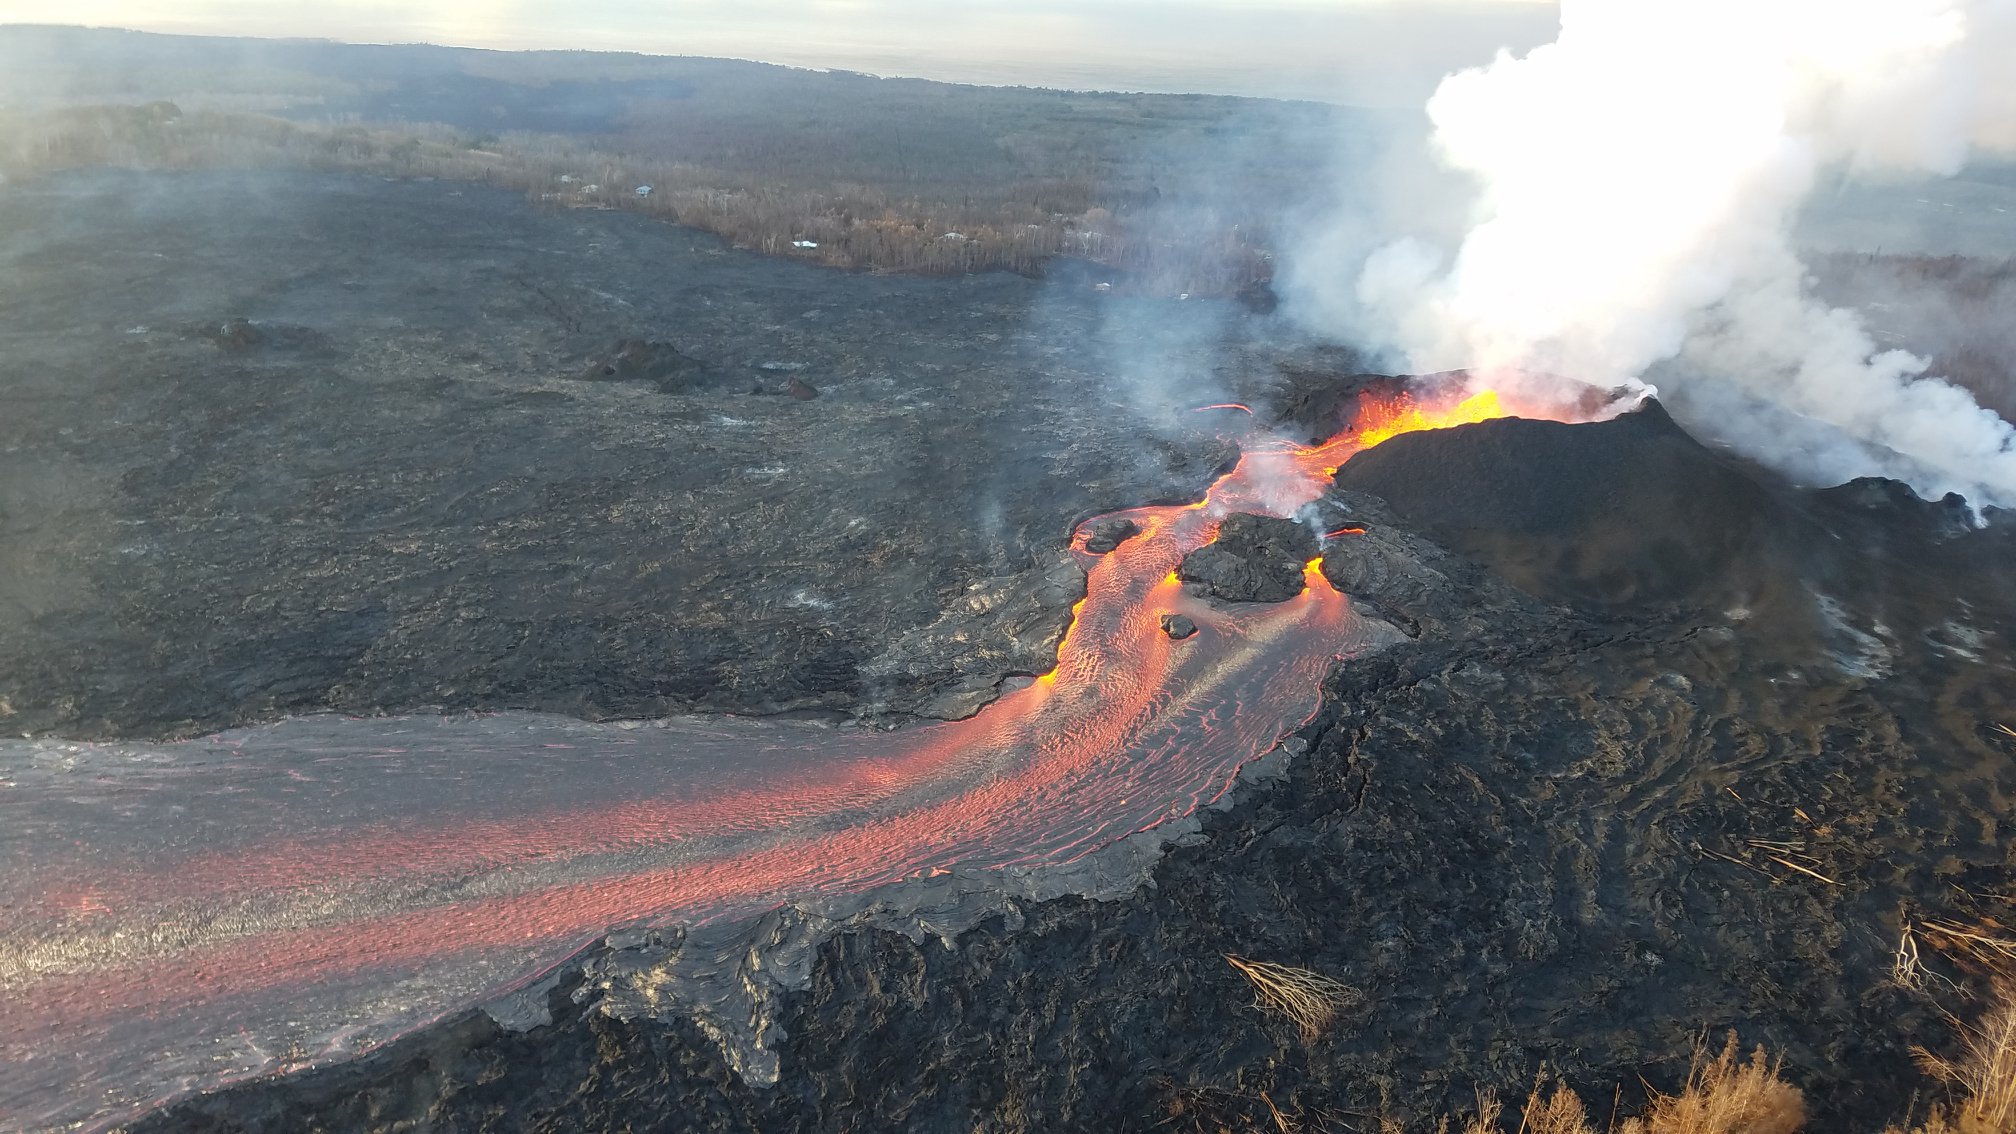
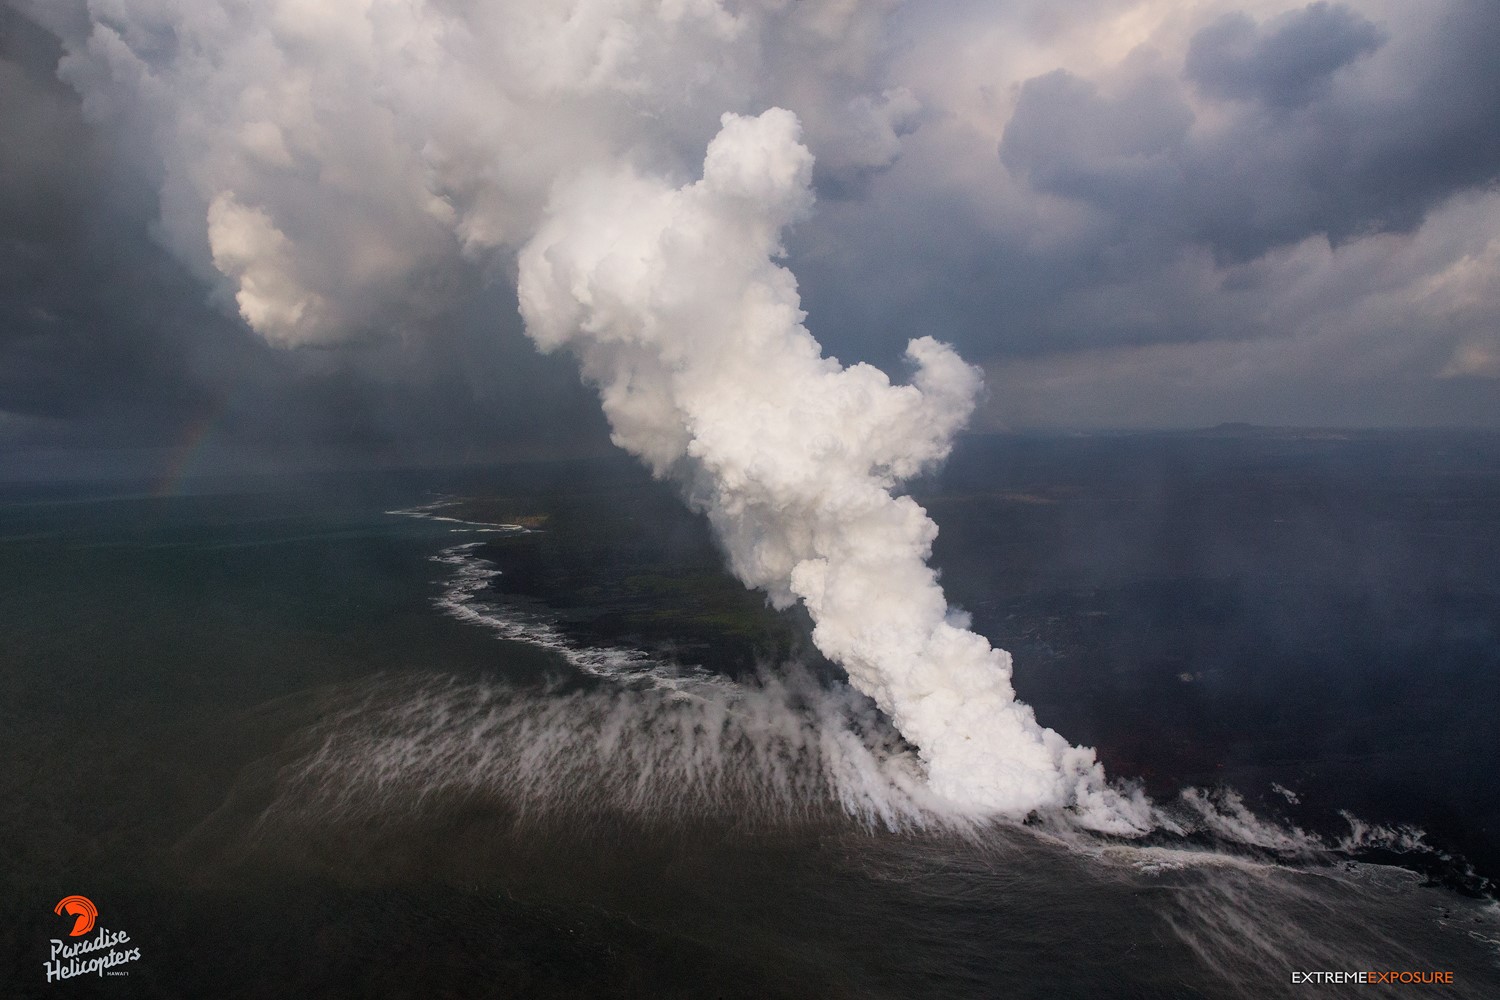
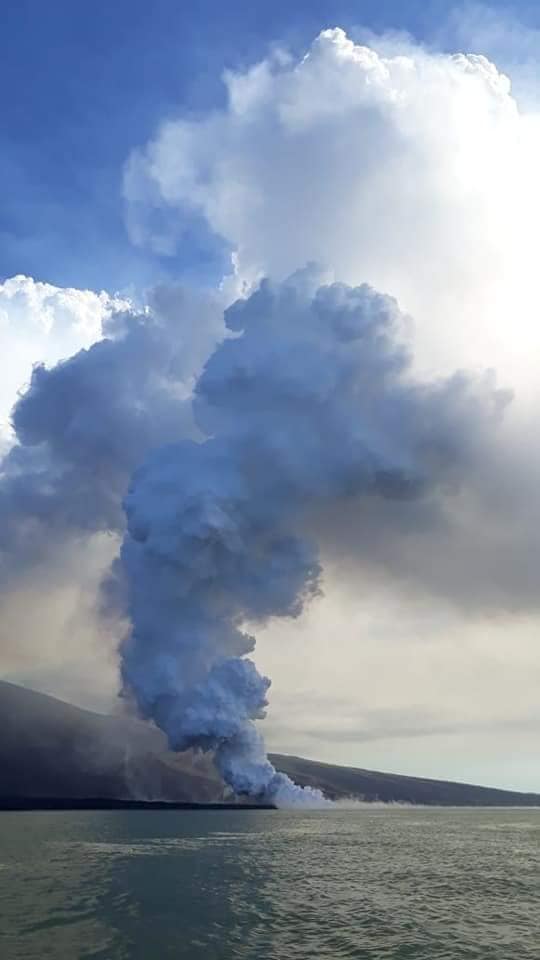
Photo : IGEPN , éruption 2018 .
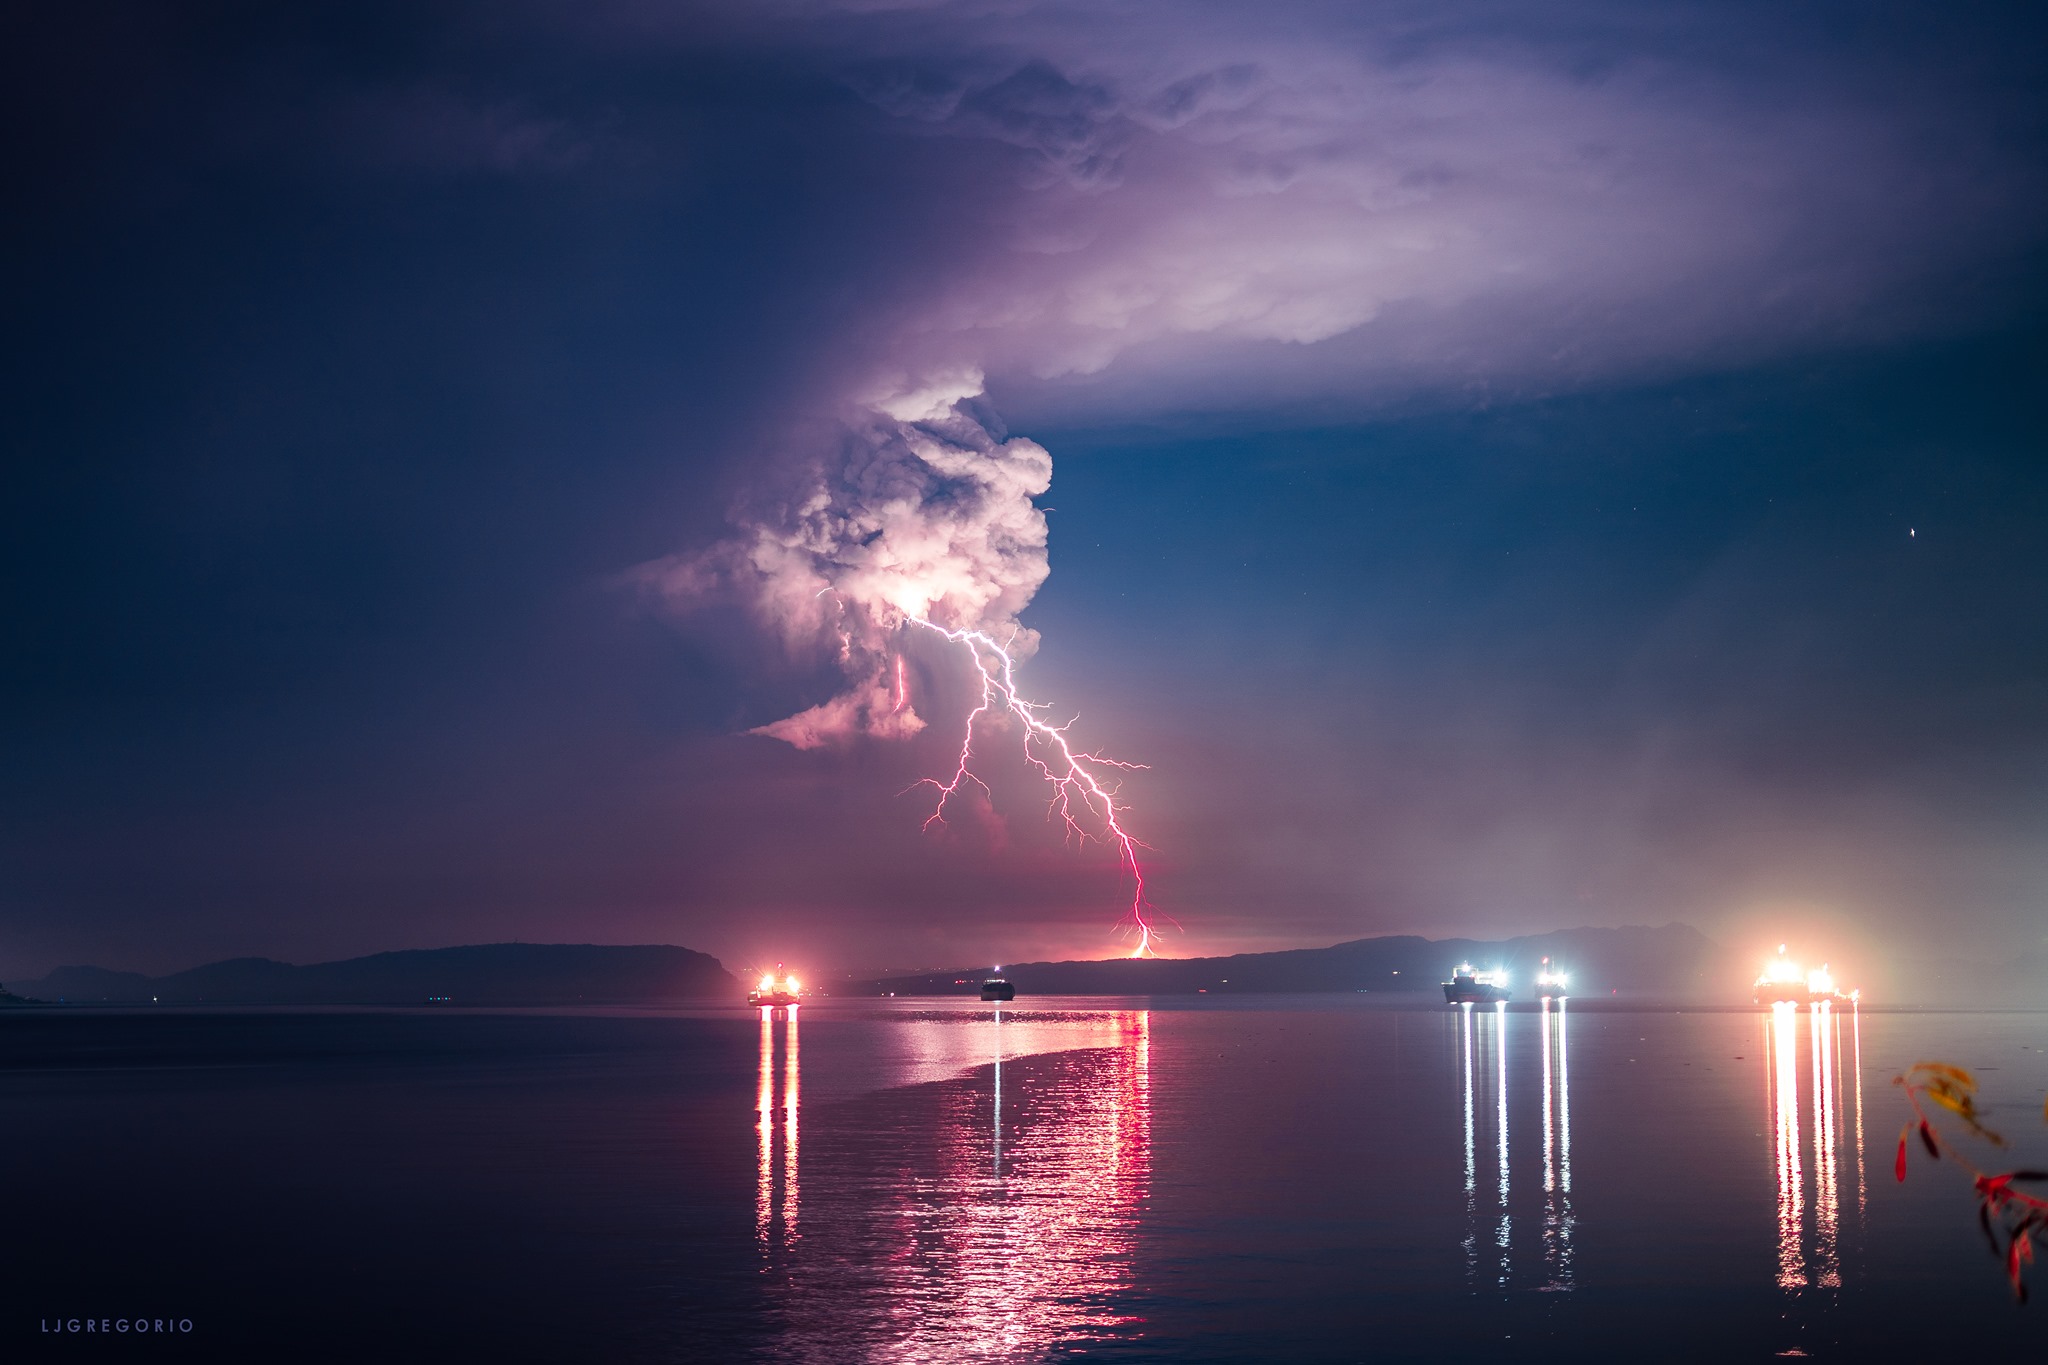
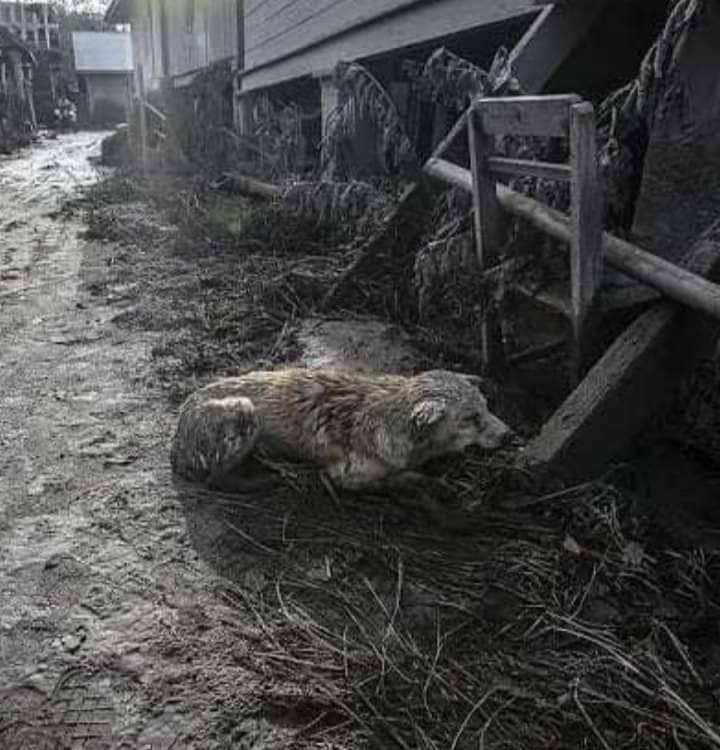
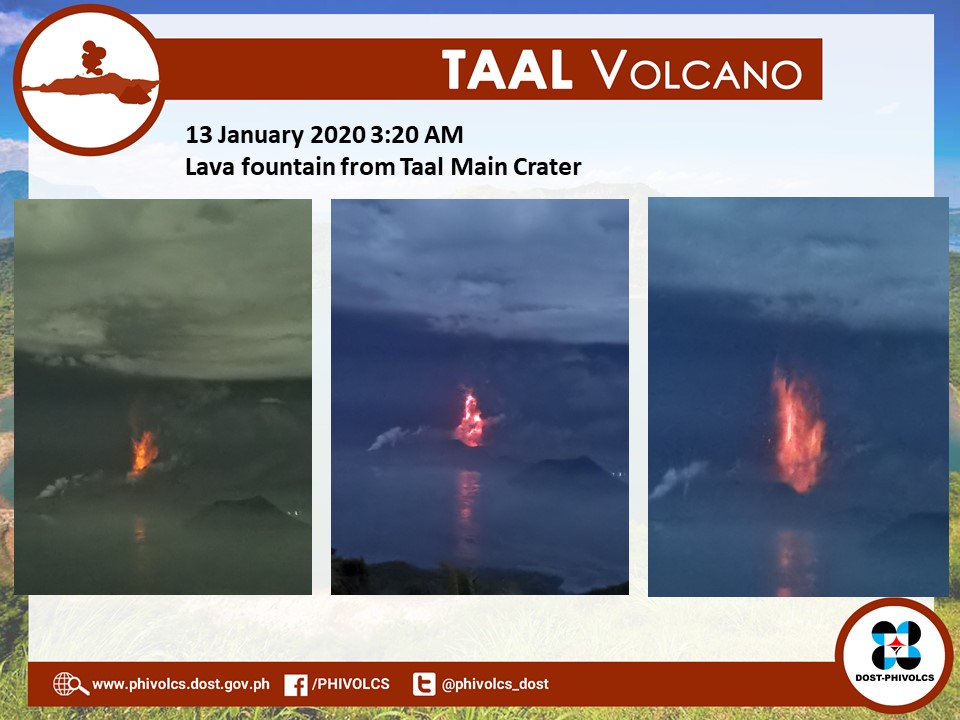
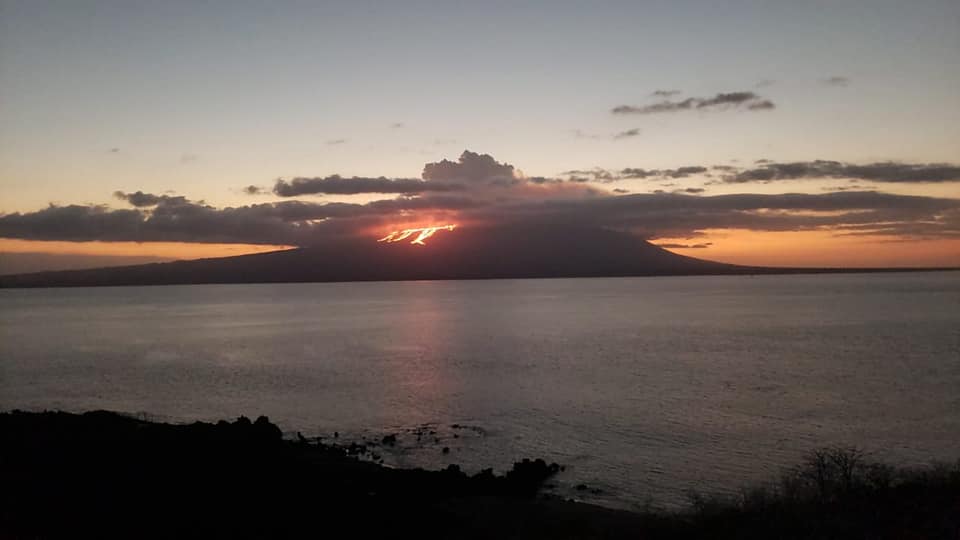
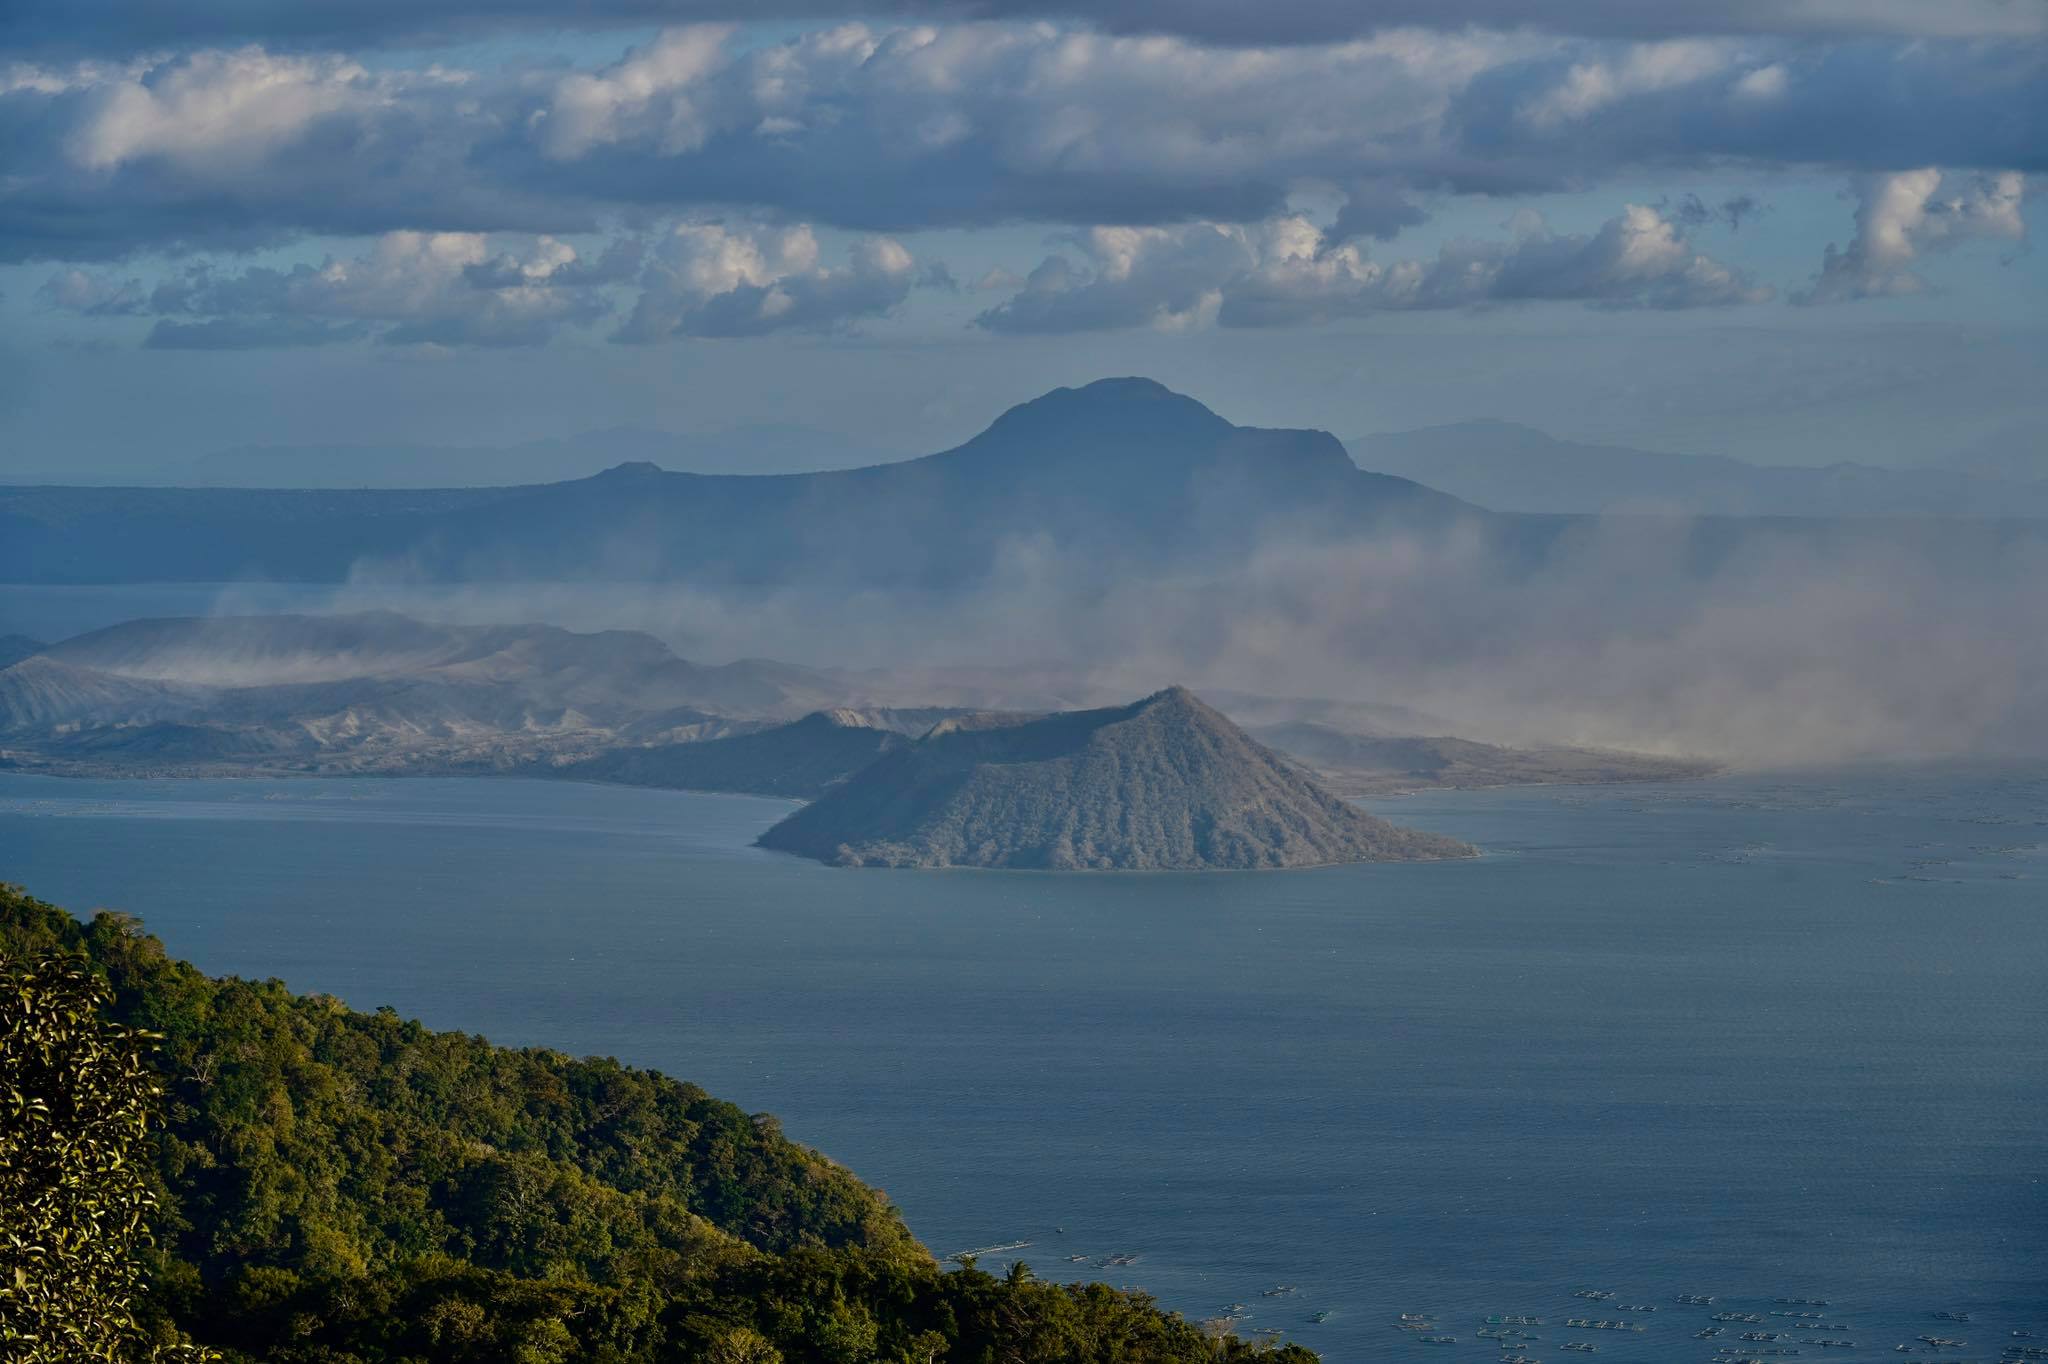
Philippines , Taal :
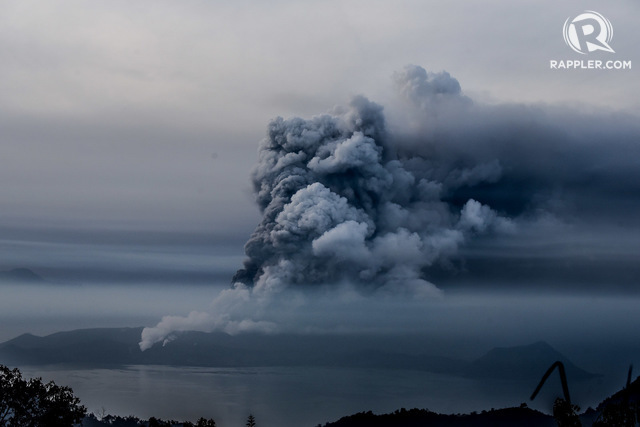
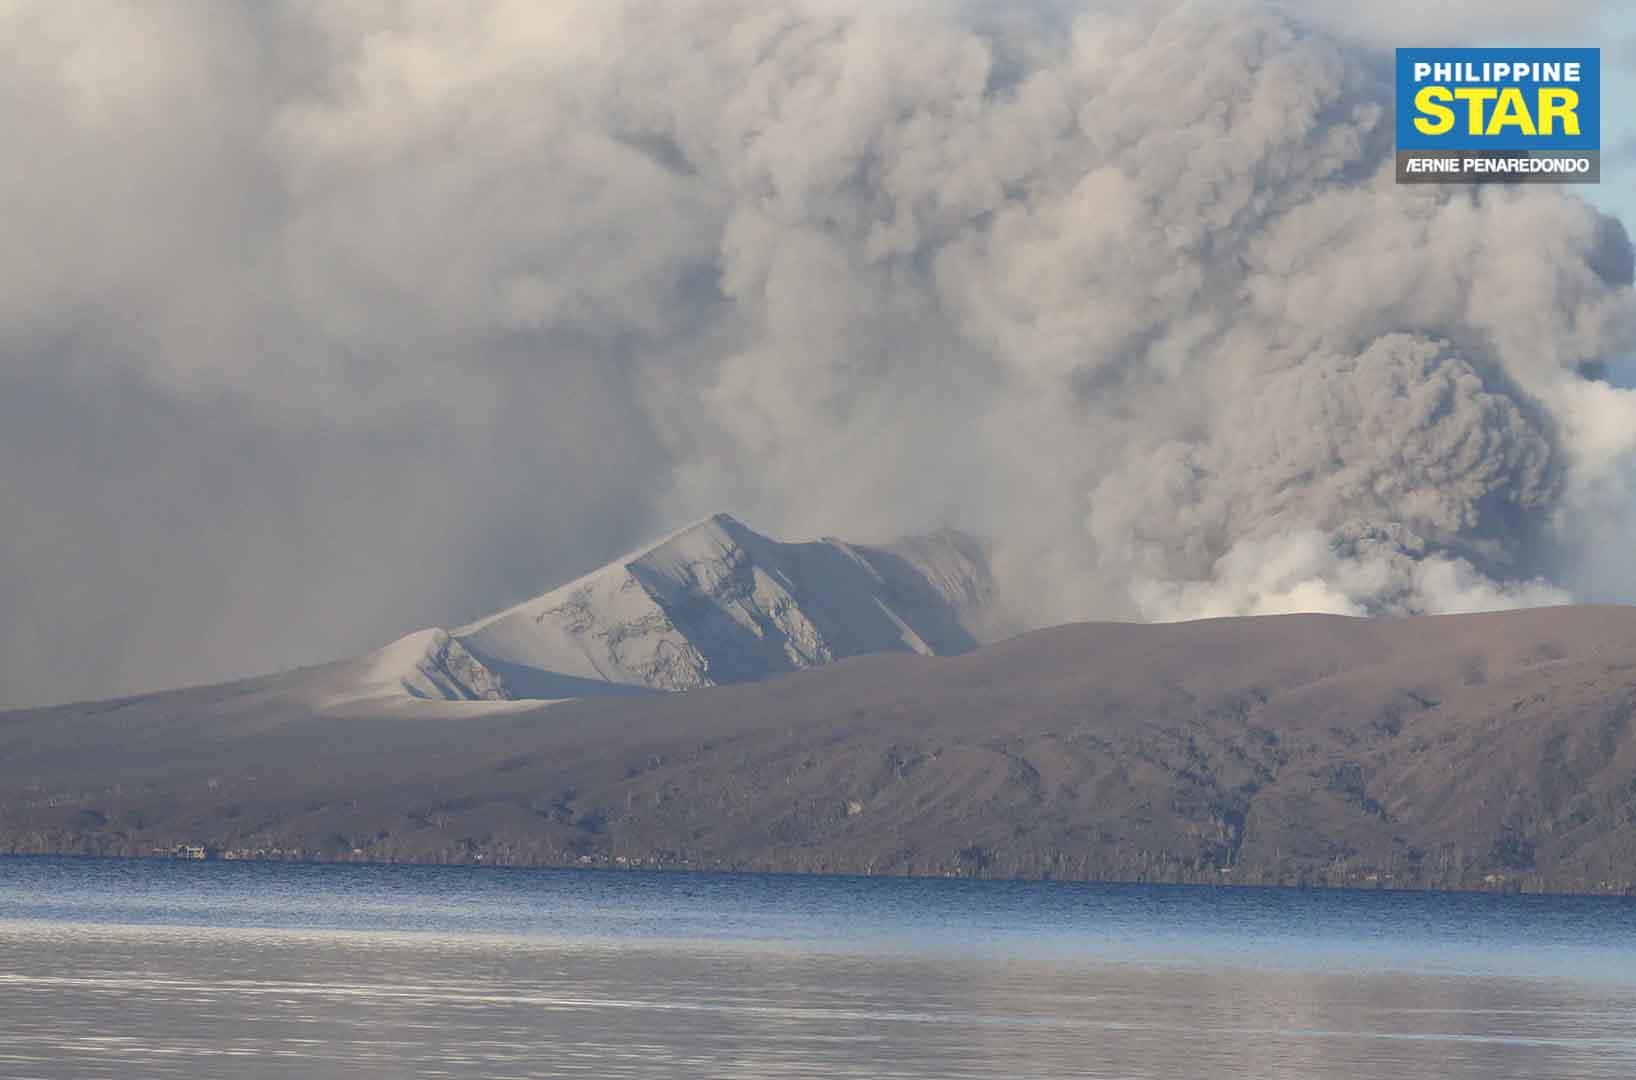
TAAL VOLCANO BULLETIN 26 January 2020 8:00 AM
This serves as a notice for the lowering of Taal Volcano’s status from Alert Level 4 (hazardous eruption imminent) to Alert Level 3 (decreased tendency towards hazardous eruption).
Taal Volcano’s condition in the two weeks following the 12-13 January 2020 phreatomagmatic eruption (main eruptive phase) has generally declined into less frequent volcanic earthquake activity, decelerated ground deformation of the Taal Caldera and Taal Volcano Island (TVI) edifices and weak steam/gas emissions at the Main Crater. These observations are supported by the following monitoring parameters:
Significant earthquakes recorded by the Philippine Seismic Network (PSN) across the Taal region declined from 959 to 27 events/day and peak magnitudes of M4.1 to M2.1 between 12 and 24 January. The Taal Volcano Network (TVN) likewise recorded a downtrend in volcanic earthquakes from 944 to 420 events/day between 17 and 24 January with a corresponding decline in the daily total seismic energy released. In particular, hybrid earthquakes that tracked post-eruptive recharge from Taal’s deep magma reservoir to a shallow magma region beneath TVI ceased on 21 January, while the number and energy of low frequency events associated with activity in the shallow magma region diminished.
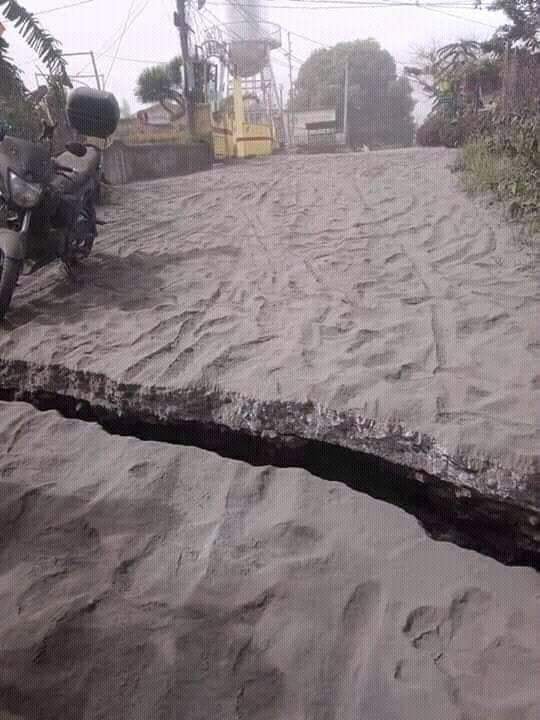
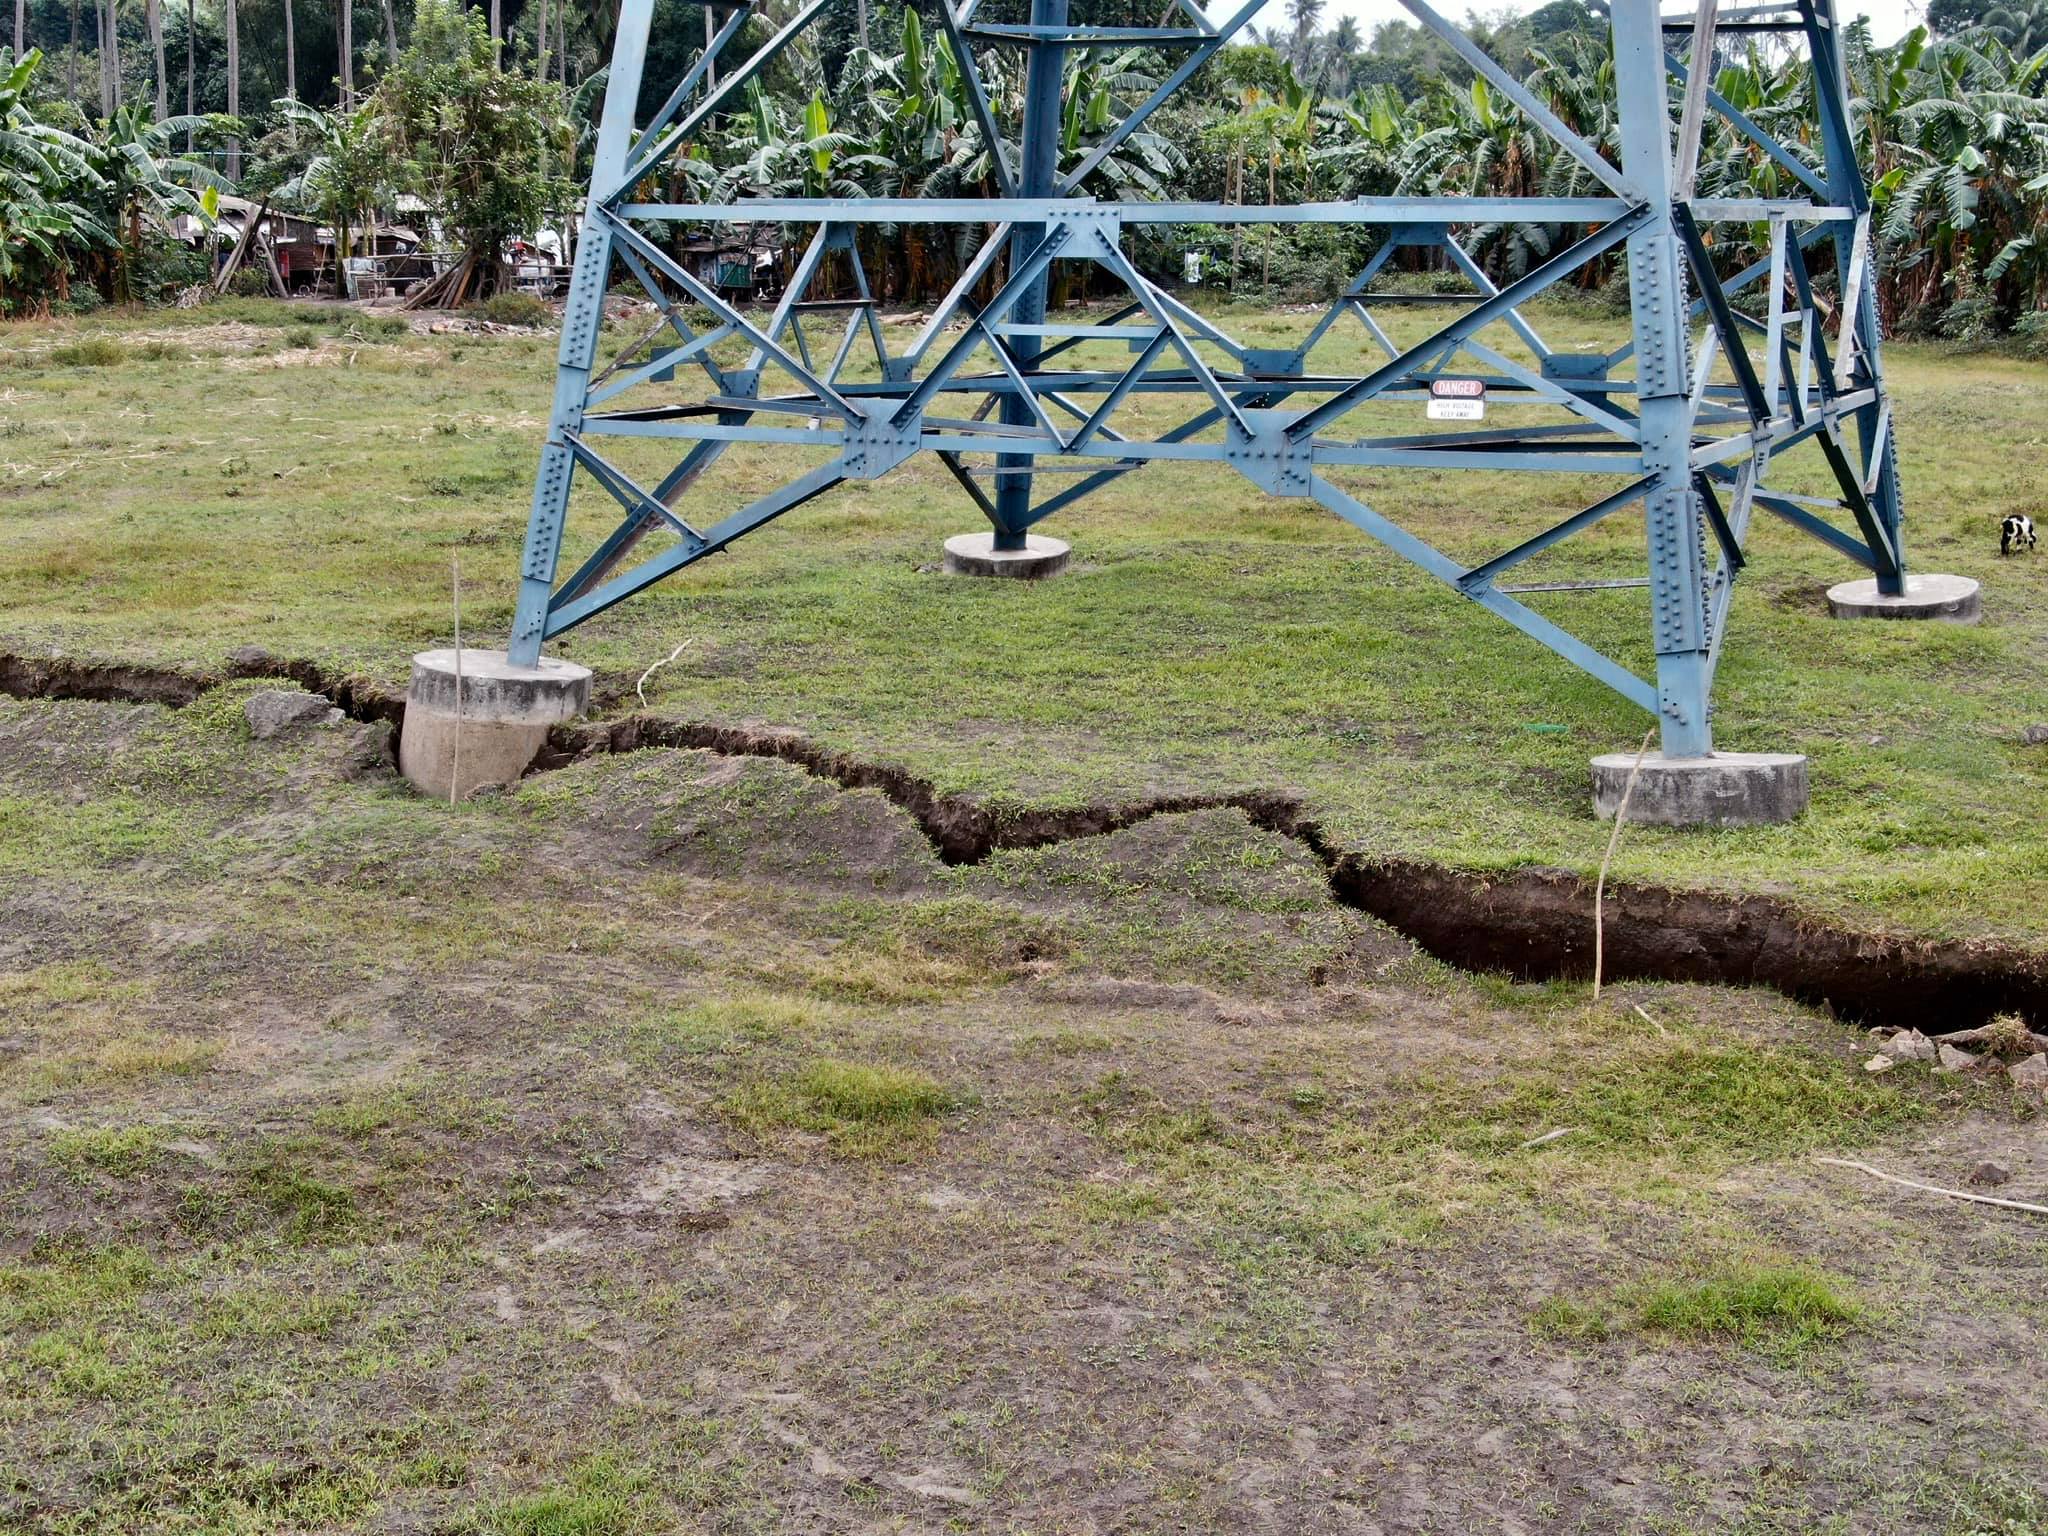
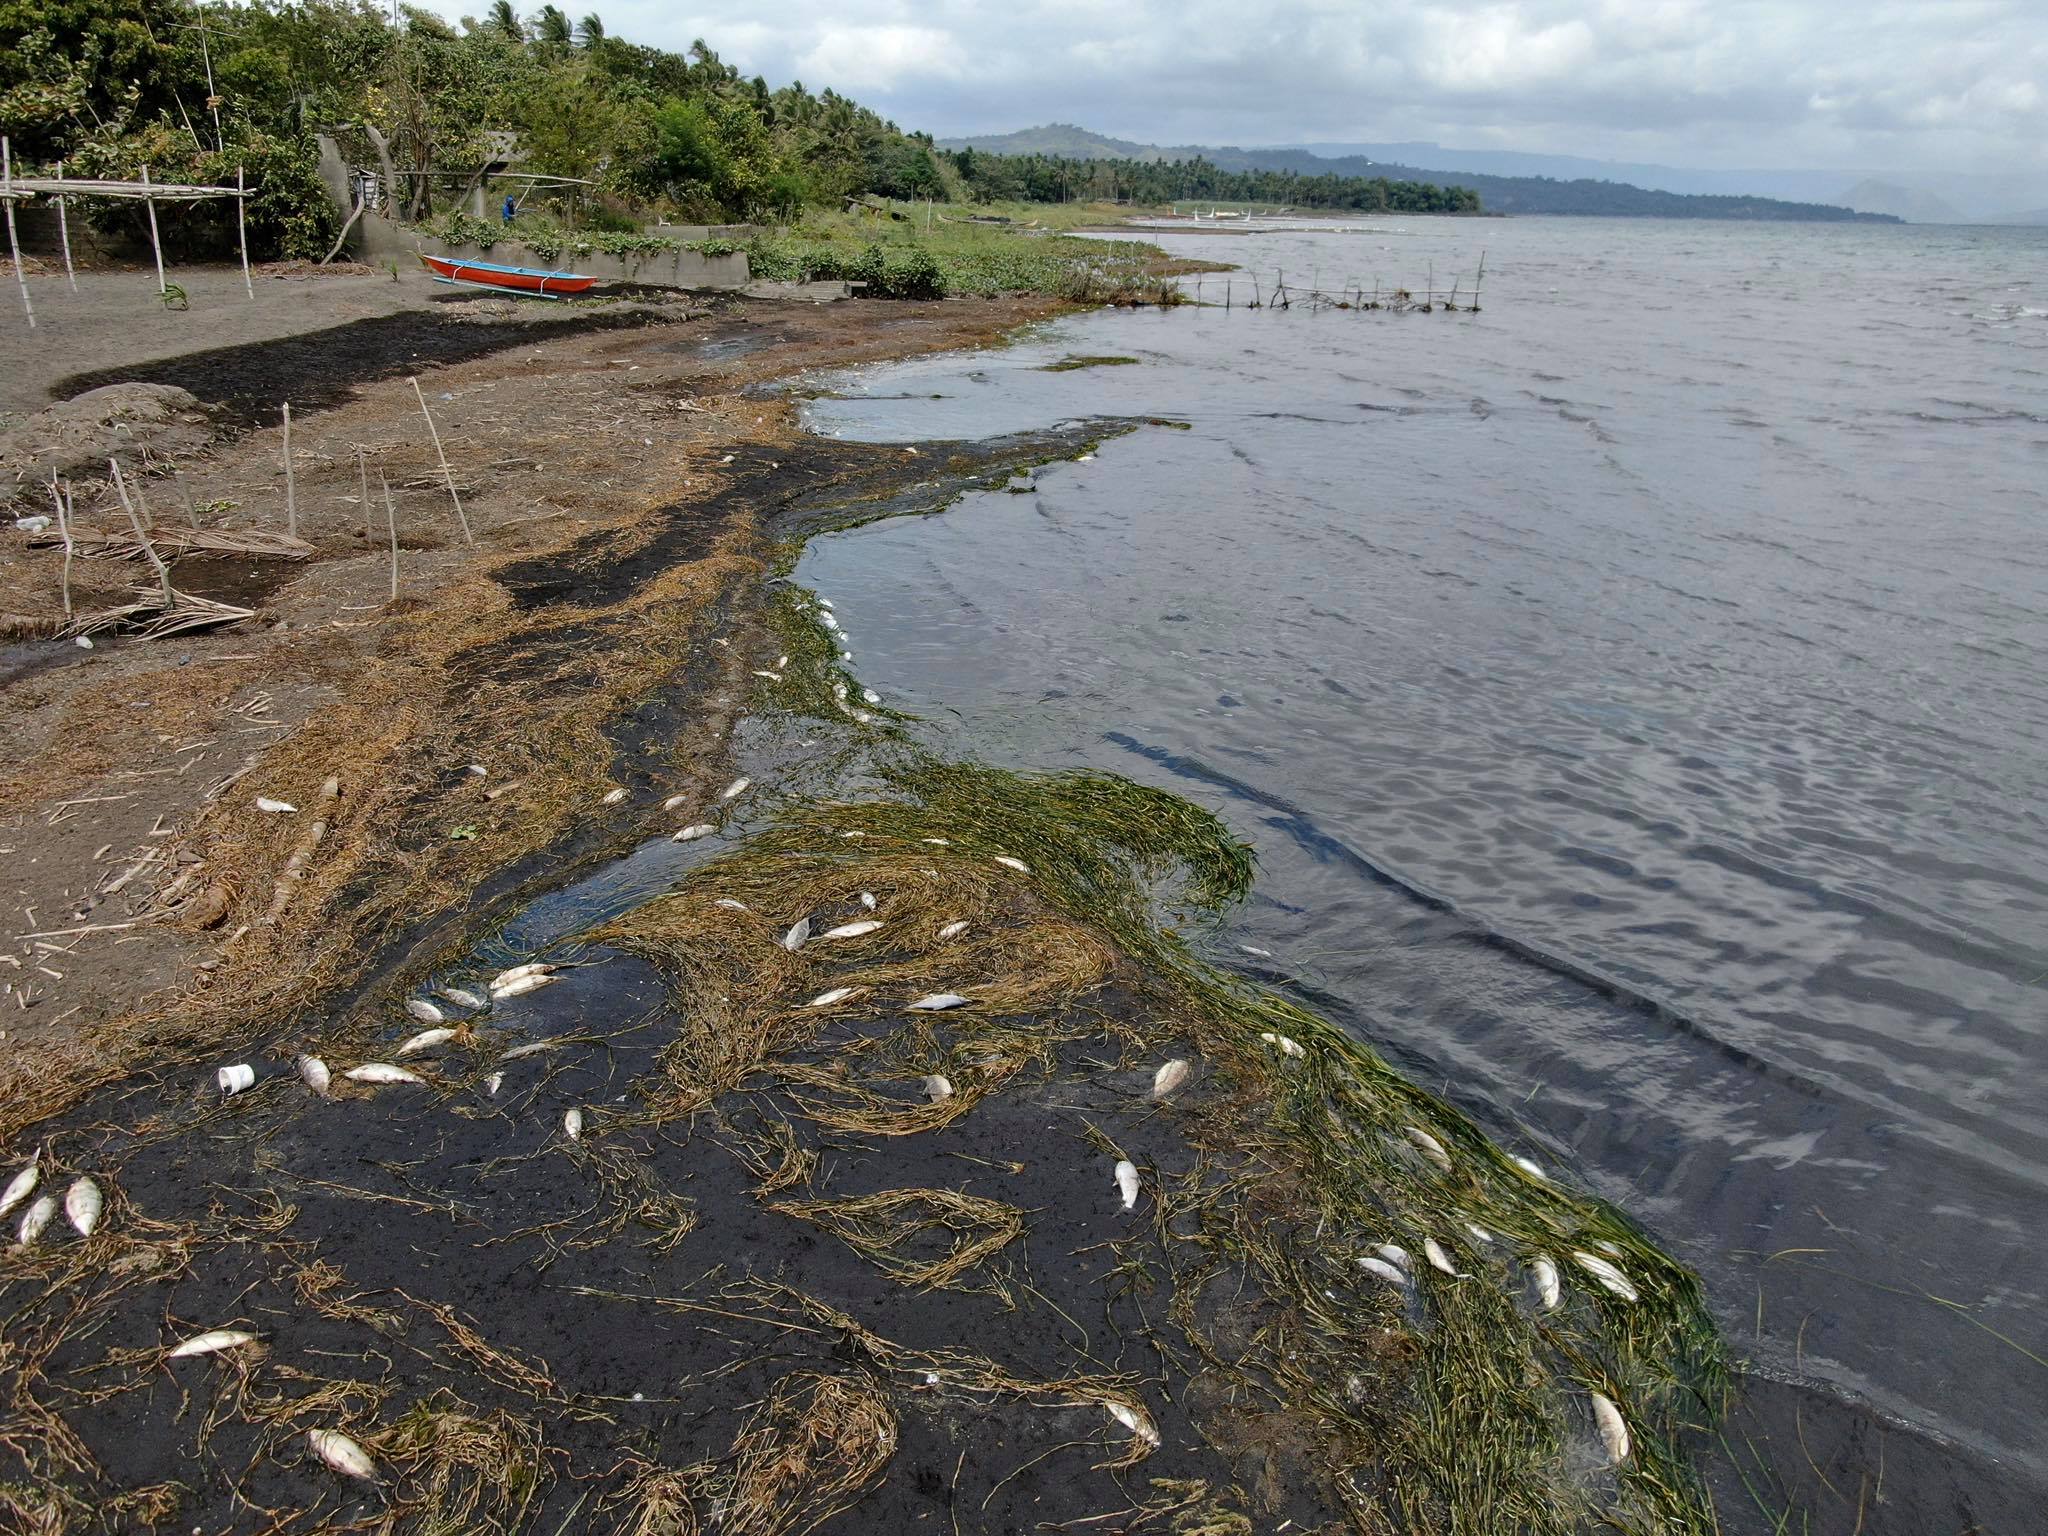
Global Positioning System (GPS) data recorded ground deformation after the main eruptive phase that included sudden widening of Taal Caldera by ~1 meter, uplift of its northwestern sector by ~20 centimeters and subsidence of the southwestern part of TVI by ~1 meter. These patterns were followed at much smaller rates between 15 and 22 January 2020 and were generally supported by field observations of lakewater recession by ~30 centimeters around Taal Lake as of yesterday. Field observations also measured a ~2.5 m lakewater recession along the southwestern lakeshore denoting uplift of portions of the Pansipit River Valley where fissuring has been reported. The overall pattern of ground deformation is for most part supported by InSAR (satellite) data and yields a net inflation of western Taal Volcano as a consequence of magma intrusion to the shallow magma region until 21 January.
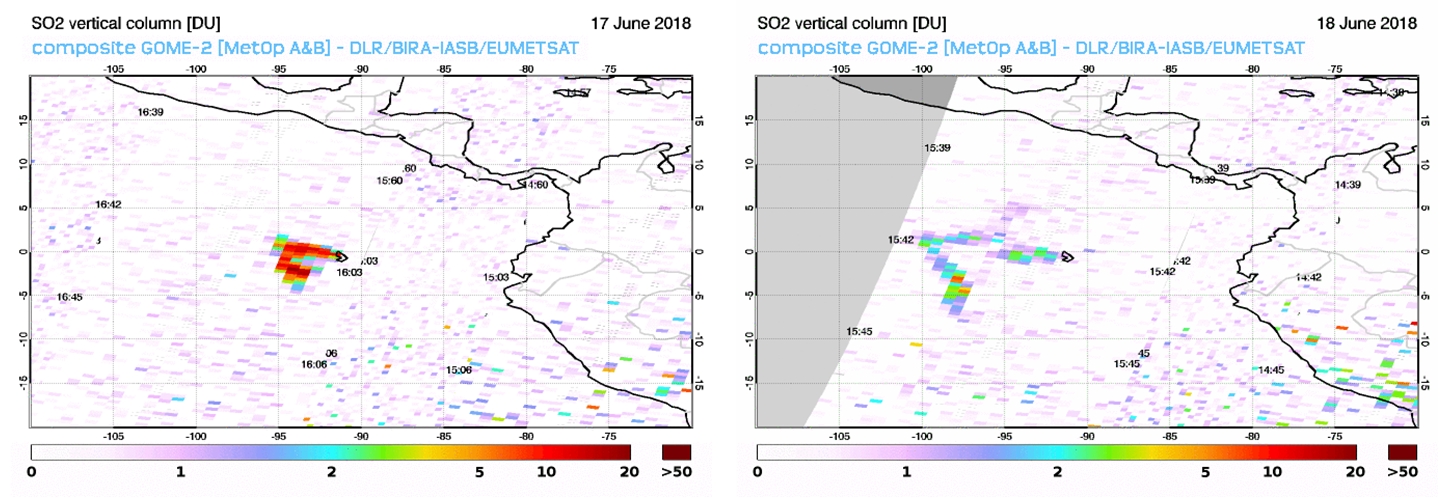
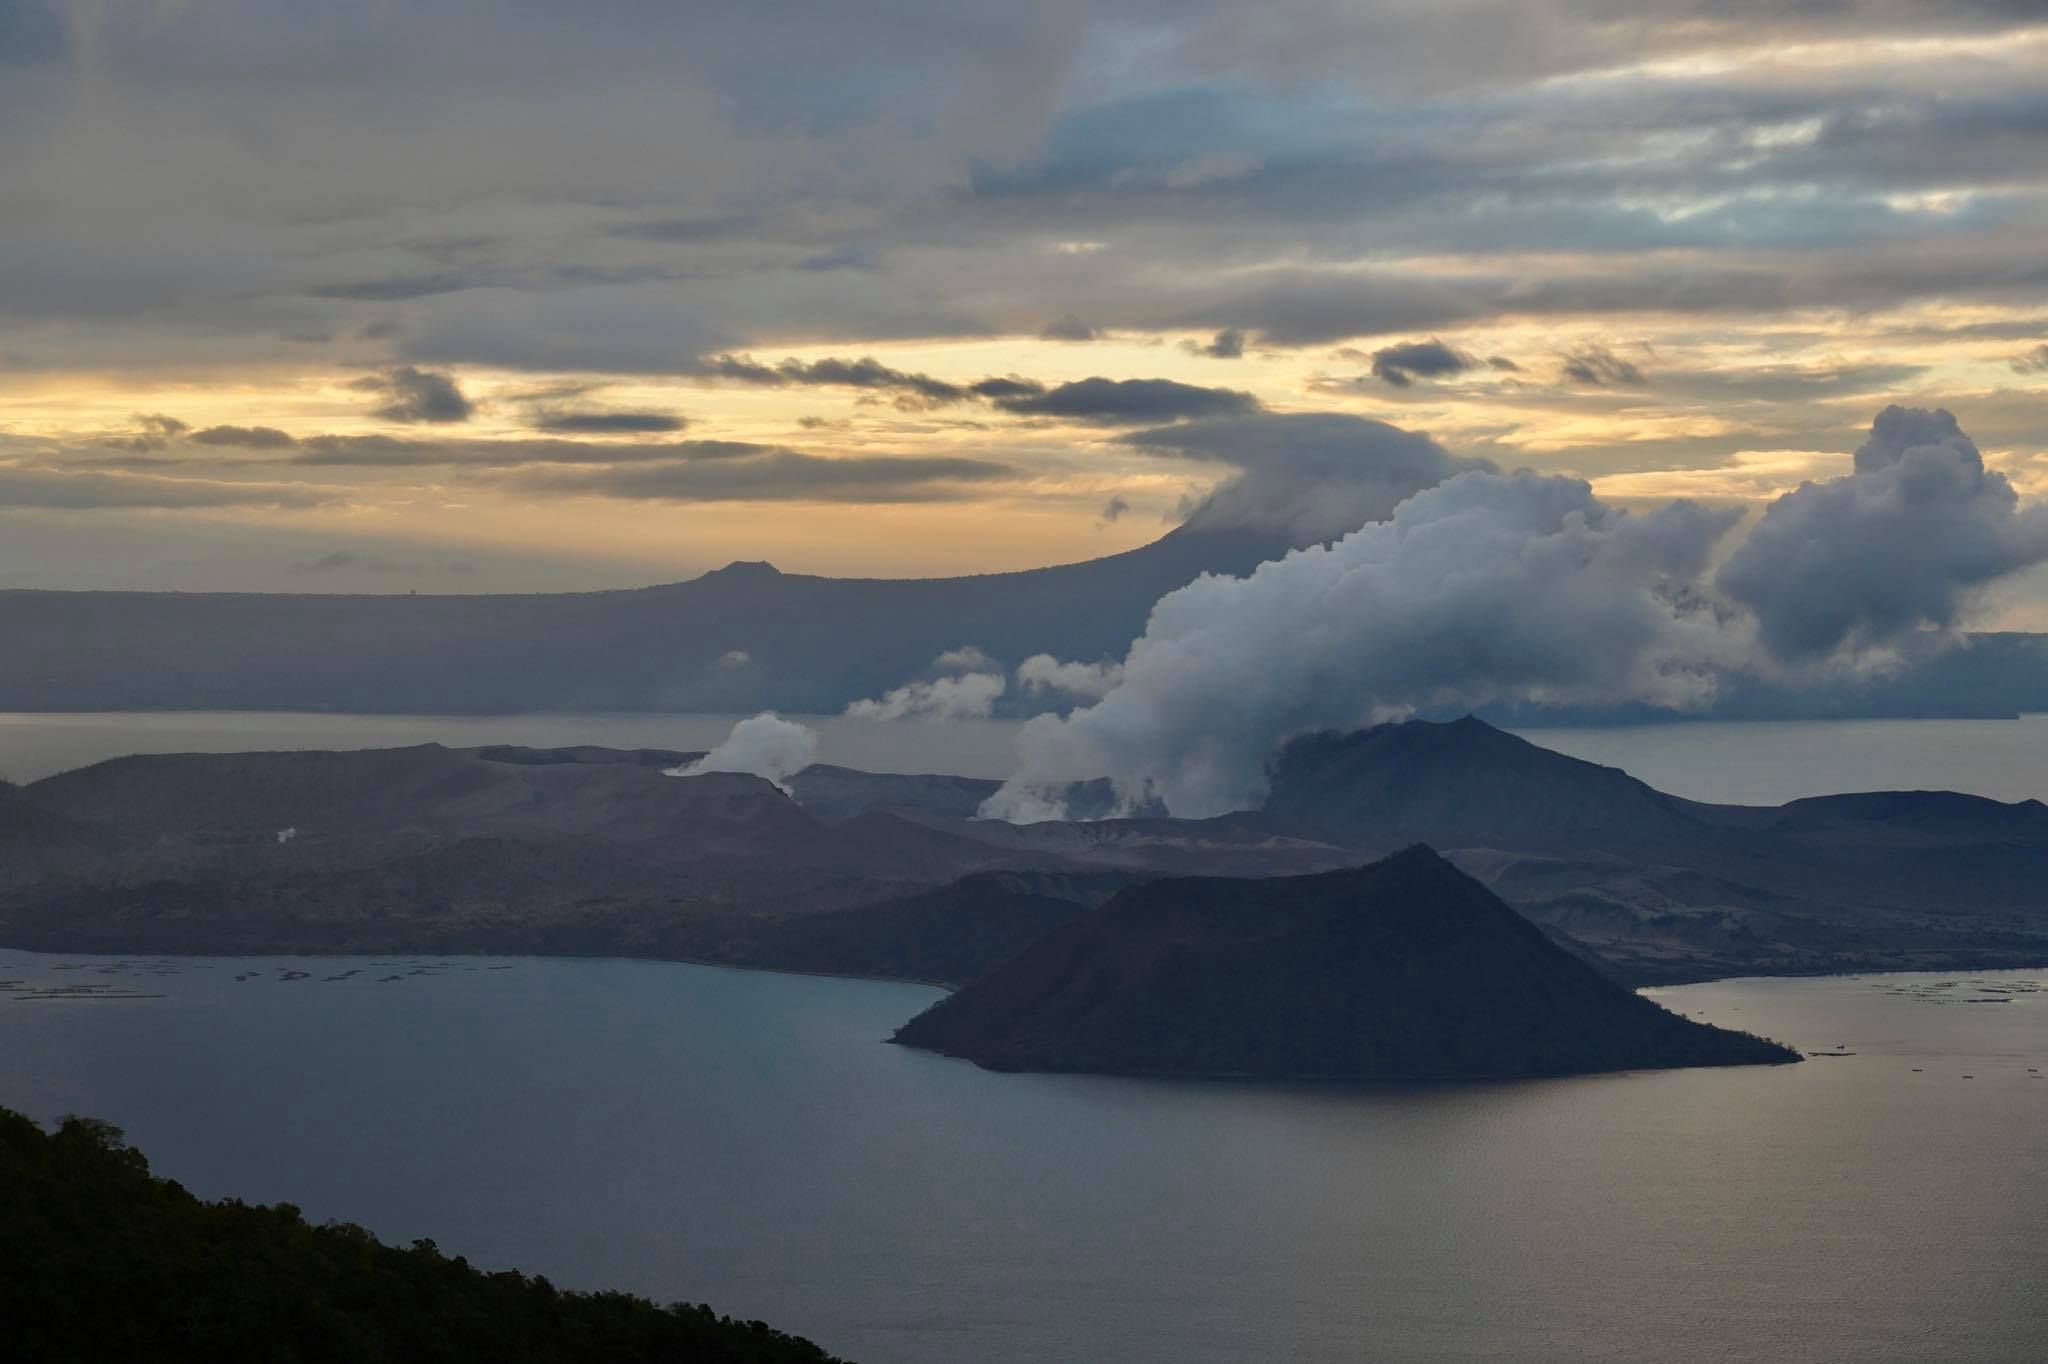
After the main eruptive phase, activity in the Taal Main Crater diminished to infrequent weak ash eruptions and longer episodes of degassing or steaming that generated steam-laden plumes <1000 meters tall. This marked decline coupled with volcanic earthquake activity suggests stalling, degassing and reduction in gas pressures of eruptible magma in the shallow magmatic region that feeds surface eruptive activity.
Sulfur dioxide or SO2 flux based on campaign Flyspec data fluctuated between a high of ~5,300 tonnes/day on 13 January to a low of ~140 tonnes/day on 22 January but has steadied at an average of 250 tonnes/day in the last five days. This low concentration average is consistent with a progressively degassed shallow magma source and diminished plume activity.
In view of the above observations, DOST-PHIVOLCS is lowering the alert status of Taal Volcano from Alert Level 4 to Alert Level 3 to reflect the overall decrease in the level of monitoring parameters. Alert Level 3 means that there is a decreased tendency towards hazardous explosive eruption but should not be interpreted that unrest has ceased or that the threat of a hazardous eruption has disappeared. Should an uptrend or pronounced change in monitored parameters forewarn a potential hazardous explosive eruption, the Alert Level may be raised back to Alert Level 4. People residing within areas at high risk to base surges who have returned after the Alert Level was stepped down must thus be prepared for a quick and organized evacuation at such time. Conversely, should there be a persistent downtrend in monitored parameters after a sufficient observation period, the Alert Level will be further lowered to Alert Level 2.
DOST-PHIVOLCS reminds the public that at Alert Level 3, sudden steam-driven and even weak phreatomagmatic explosions, volcanic earthquakes, ashfall and lethal volcanic gas expulsions can occur and threaten areas within TVI and nearby lakeshores. DOST-PHIVOLCS recommends that entry into TVI, Taal’s Permanent Danger Zone, as well as into areas over Taal Lake and communities west of TVI within a seven (7) kilometer-radius from the Main Crater must be strictly prohibited. Local government units are advised to assess areas outside the seven-kilometer radius for damages and road accessibilities and to strengthen preparedness, contingency and communication measures in case of renewed unrest. People are also advised to observe precautions due to ground displacement across fissures, frequent ashfall and minor earthquakes. Communities beside active river channels particularly where ash from the main eruption phase has been thickly deposited should increase vigilance when there is heavy and prolonged rainfall since the ash can be washed away and form lahars along the channels. Civil aviation authorities must advise pilots to avoid flying close to the volcano as airborne ash and ballistic fragments from sudden explosions and wind-remobilized ash may pose hazards to aircrafts.
PHIVOLCS-DOST is closely monitoring Taal Volcano’s activity and any new significant development will be immediately communicated to all stakeholders.
Source : Phivolcs .
Photos : Raffy Tima .
Kamchatka , Sheveluch :
56.64 N, 161.32 E;
Elevation 10768 ft (3283 m), the dome elevation ~8200 ft (2500 m)
Aviation Colour Code is ORANGE.

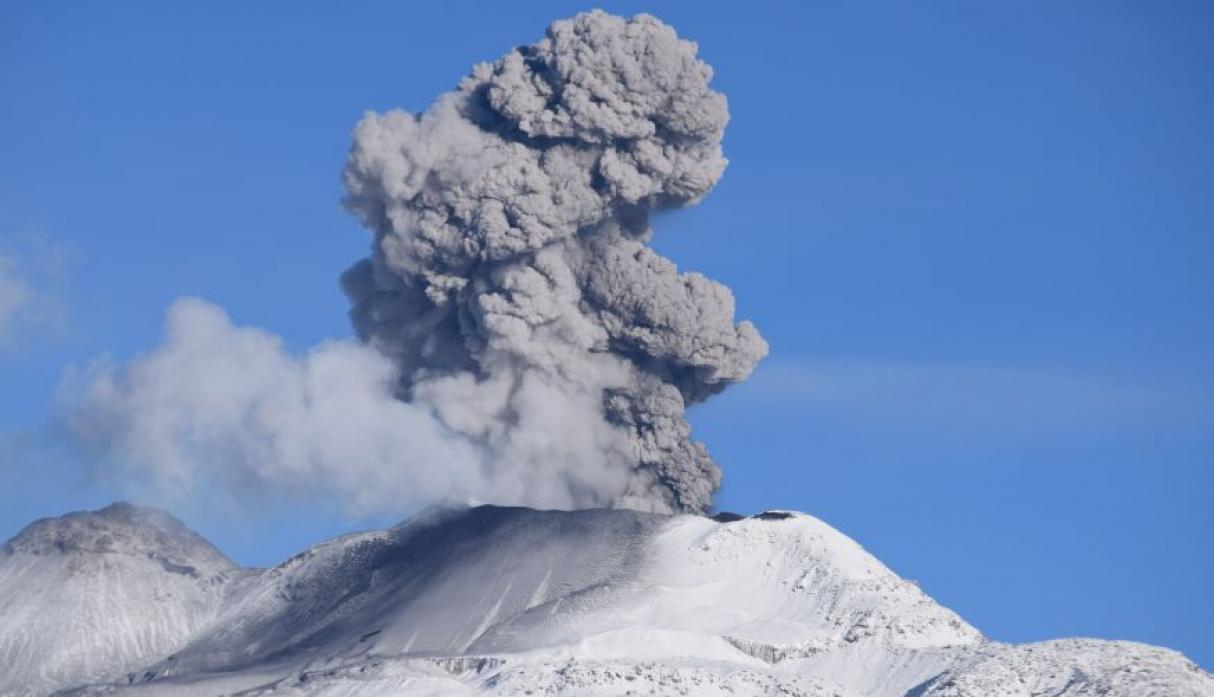
The fumarole activity of the lava dome of Molodoy Sheveluch volcano on January 24 , 2020.
Explosive-extrusive eruption of the volcano continues. Ash explosions up to 32,800-49,200 ft (10-15 km) a.s.l. could occur at any time. Ongoing activity could affect international and low-flying aircraft.
A growth of the lava dome continues, a strong fumarolic activity sometimes with some amount of ash, and an incandescence of the dome blocks and hot avalanches accompanies this process. Satellite data showed a thermal anomaly over the volcano all week.
Source : Kvert.
Photo : Yu. Demyanchuk, IVS FEB RAS, KVERT .
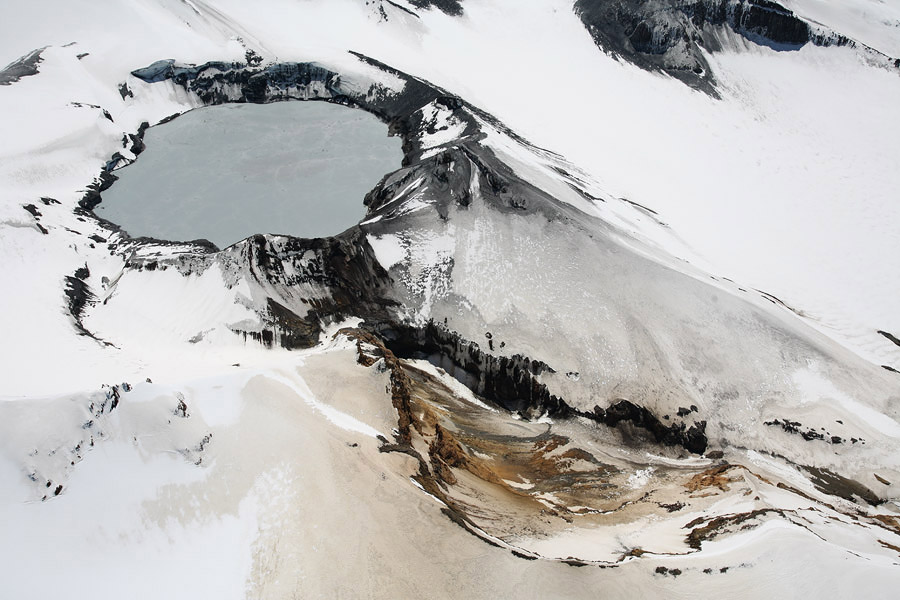
Indonesia , Anak Krakatau :
Level of activity at level II (Waspada), since March 25, 2019. G. Anak Krakatau (157 m above sea level) has experienced an increase in its volcanic activity since June 18, 2018 which was followed by a series eruptions in the period from September 2018 to February 2019.
The volcano is clearly visible until it is covered with fog. The weather is sunny / rainy, the wind is light, oriented to the East. The air temperature is around 25 ° to 29 ° C. The smoke from the crater is white with a fine to thick intensity about 25-250 meters above the summit.

According to seismographs, on January 25, 2020, it was recorded:
1 low frequency earthquake
Continuous tremor, amplitude 0.5-9 mm (dominant value 1 mm)
Recommendation: People / tourists are not allowed to approach the crater within a radius of 2 km.
VONA: The last VONA ORANGE color code was published on January 15, 2020 at 12 h 01 min. The volcanic ash was observed in the form of thick ash with a height of 150 meters above the bottom of the crater.
Source : PVMBG.
Photo : Sergey Biryukov.
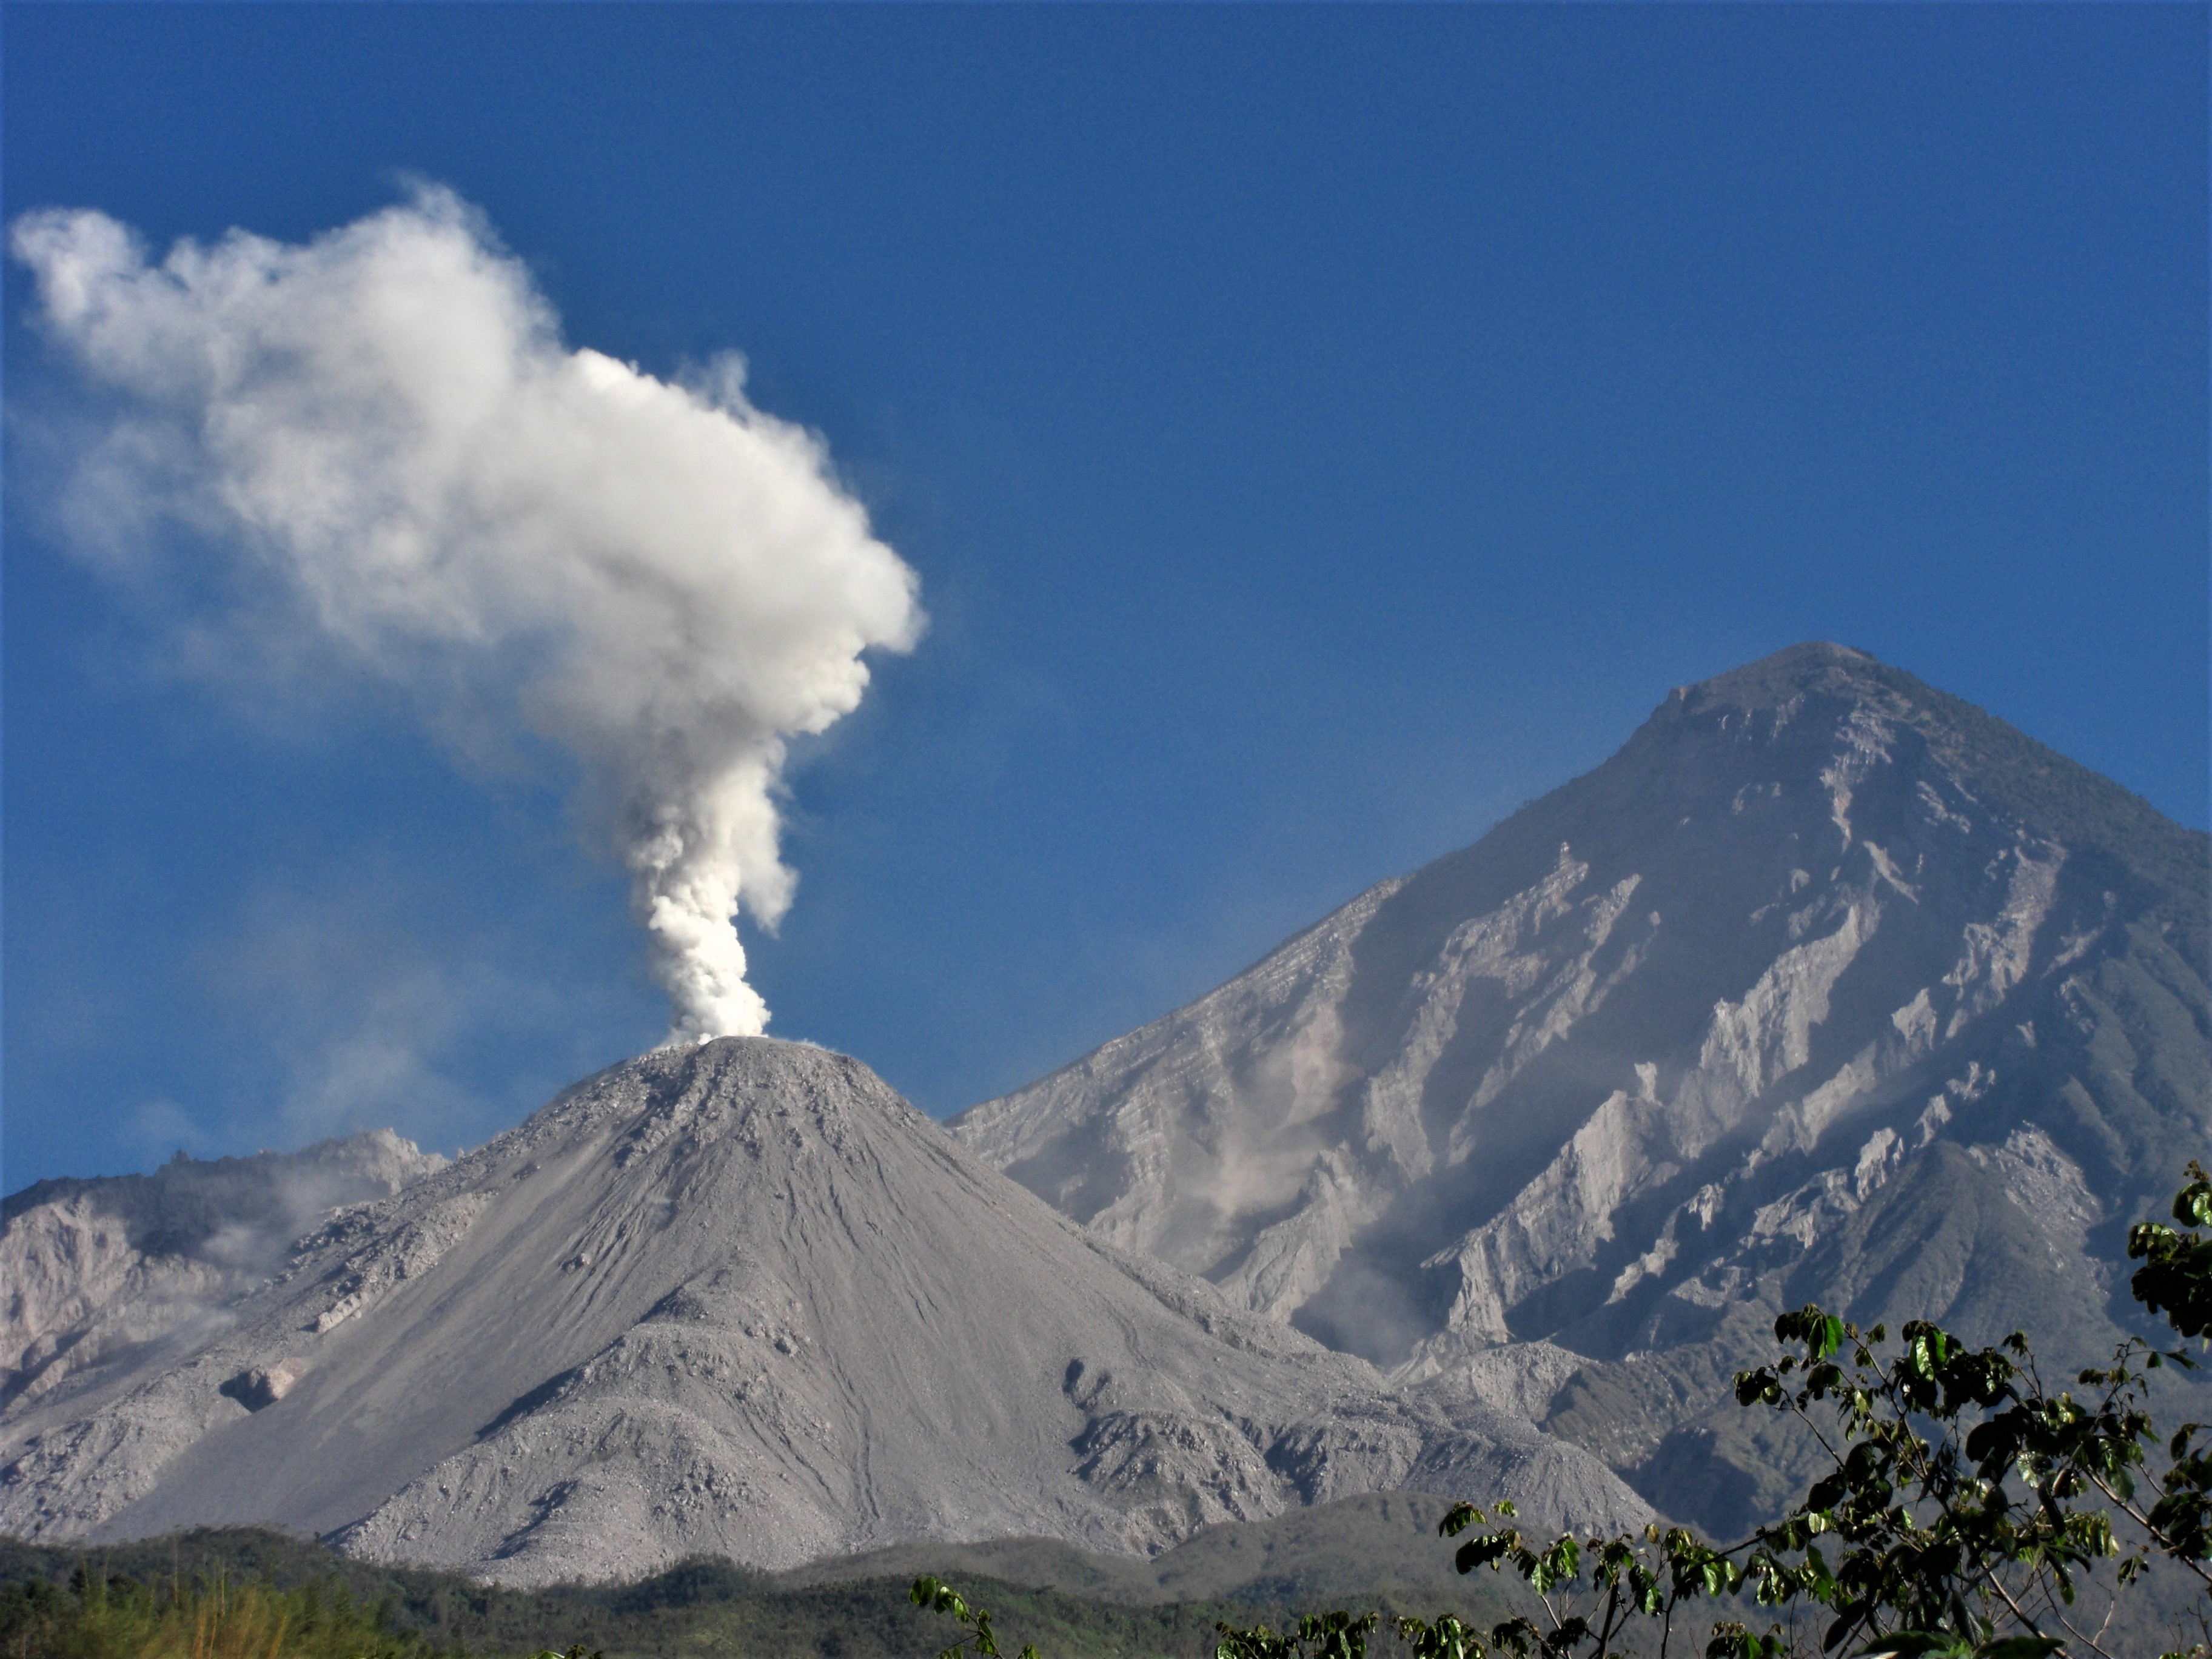
Guatemala , Santiaguito :
Activity type: Pelean
Morphology: Complex of dacitic domes
Location: 14 ° 44 ’33 ˝ Latitude N; 91 ° 34’13˝ W longitude.
Height: 2500 m.
Atmospheric conditions: Clear
Wind: East at 3 km / h
Precipitation: 0.0 mm.
Activity:
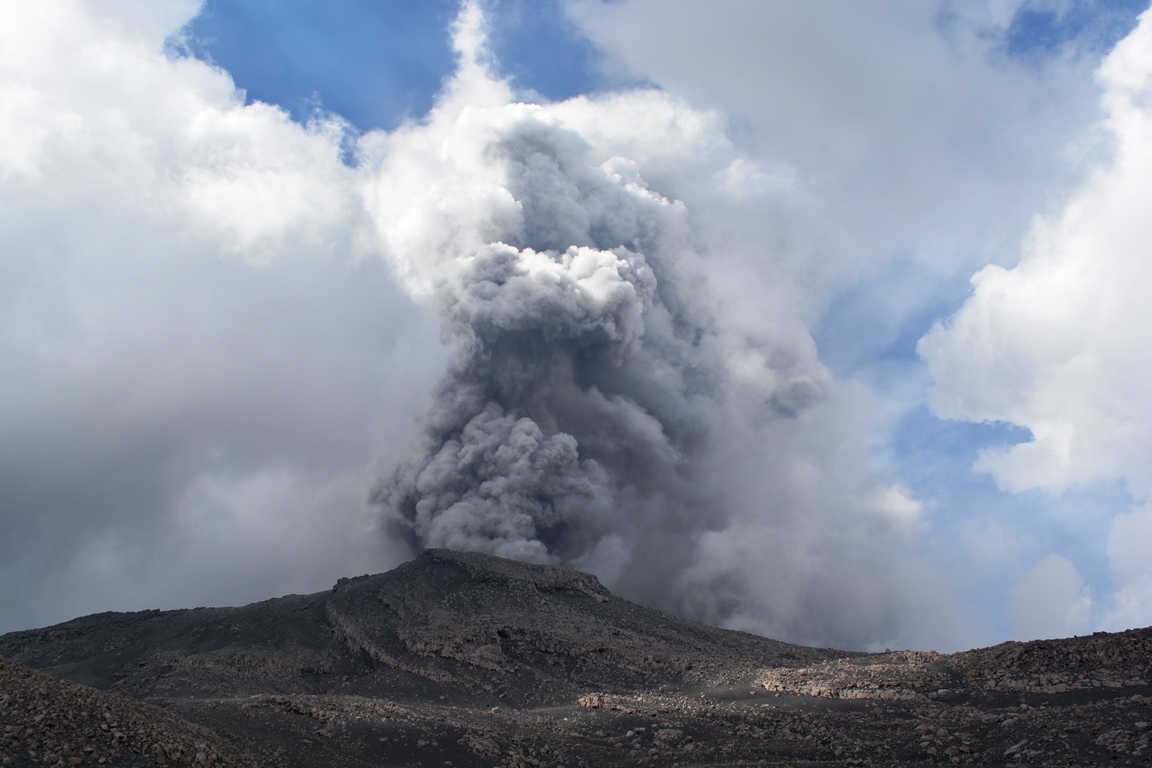
A white degassing which rises to a height of 3000 meters above sea level (9842 feet) disperses to the southwest. Low to moderate explosions are recorded which raise the columns of ash to an approximate height of 3300 meters above sea level (10827 feet) and disperse towards the southwest over a distance of approximately 1.5 kilometers. There is an incandescence in the crater of the Caliente dome at night. Weak and sometimes moderate avalanches on the South-East and North-East flanks of the Caliente dome generate an uplift of material during their journey. With the return of the wind in the area, there is a probability of ash falling in different directions.
Source : Insivumeh .
Photo : Annie Winson , earthobservatory.sg