April 20 , 2021 .
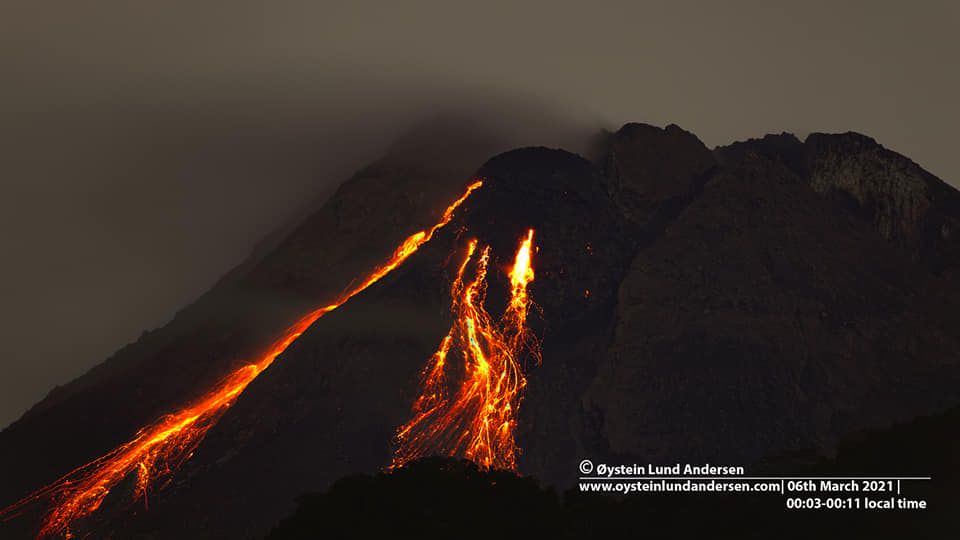
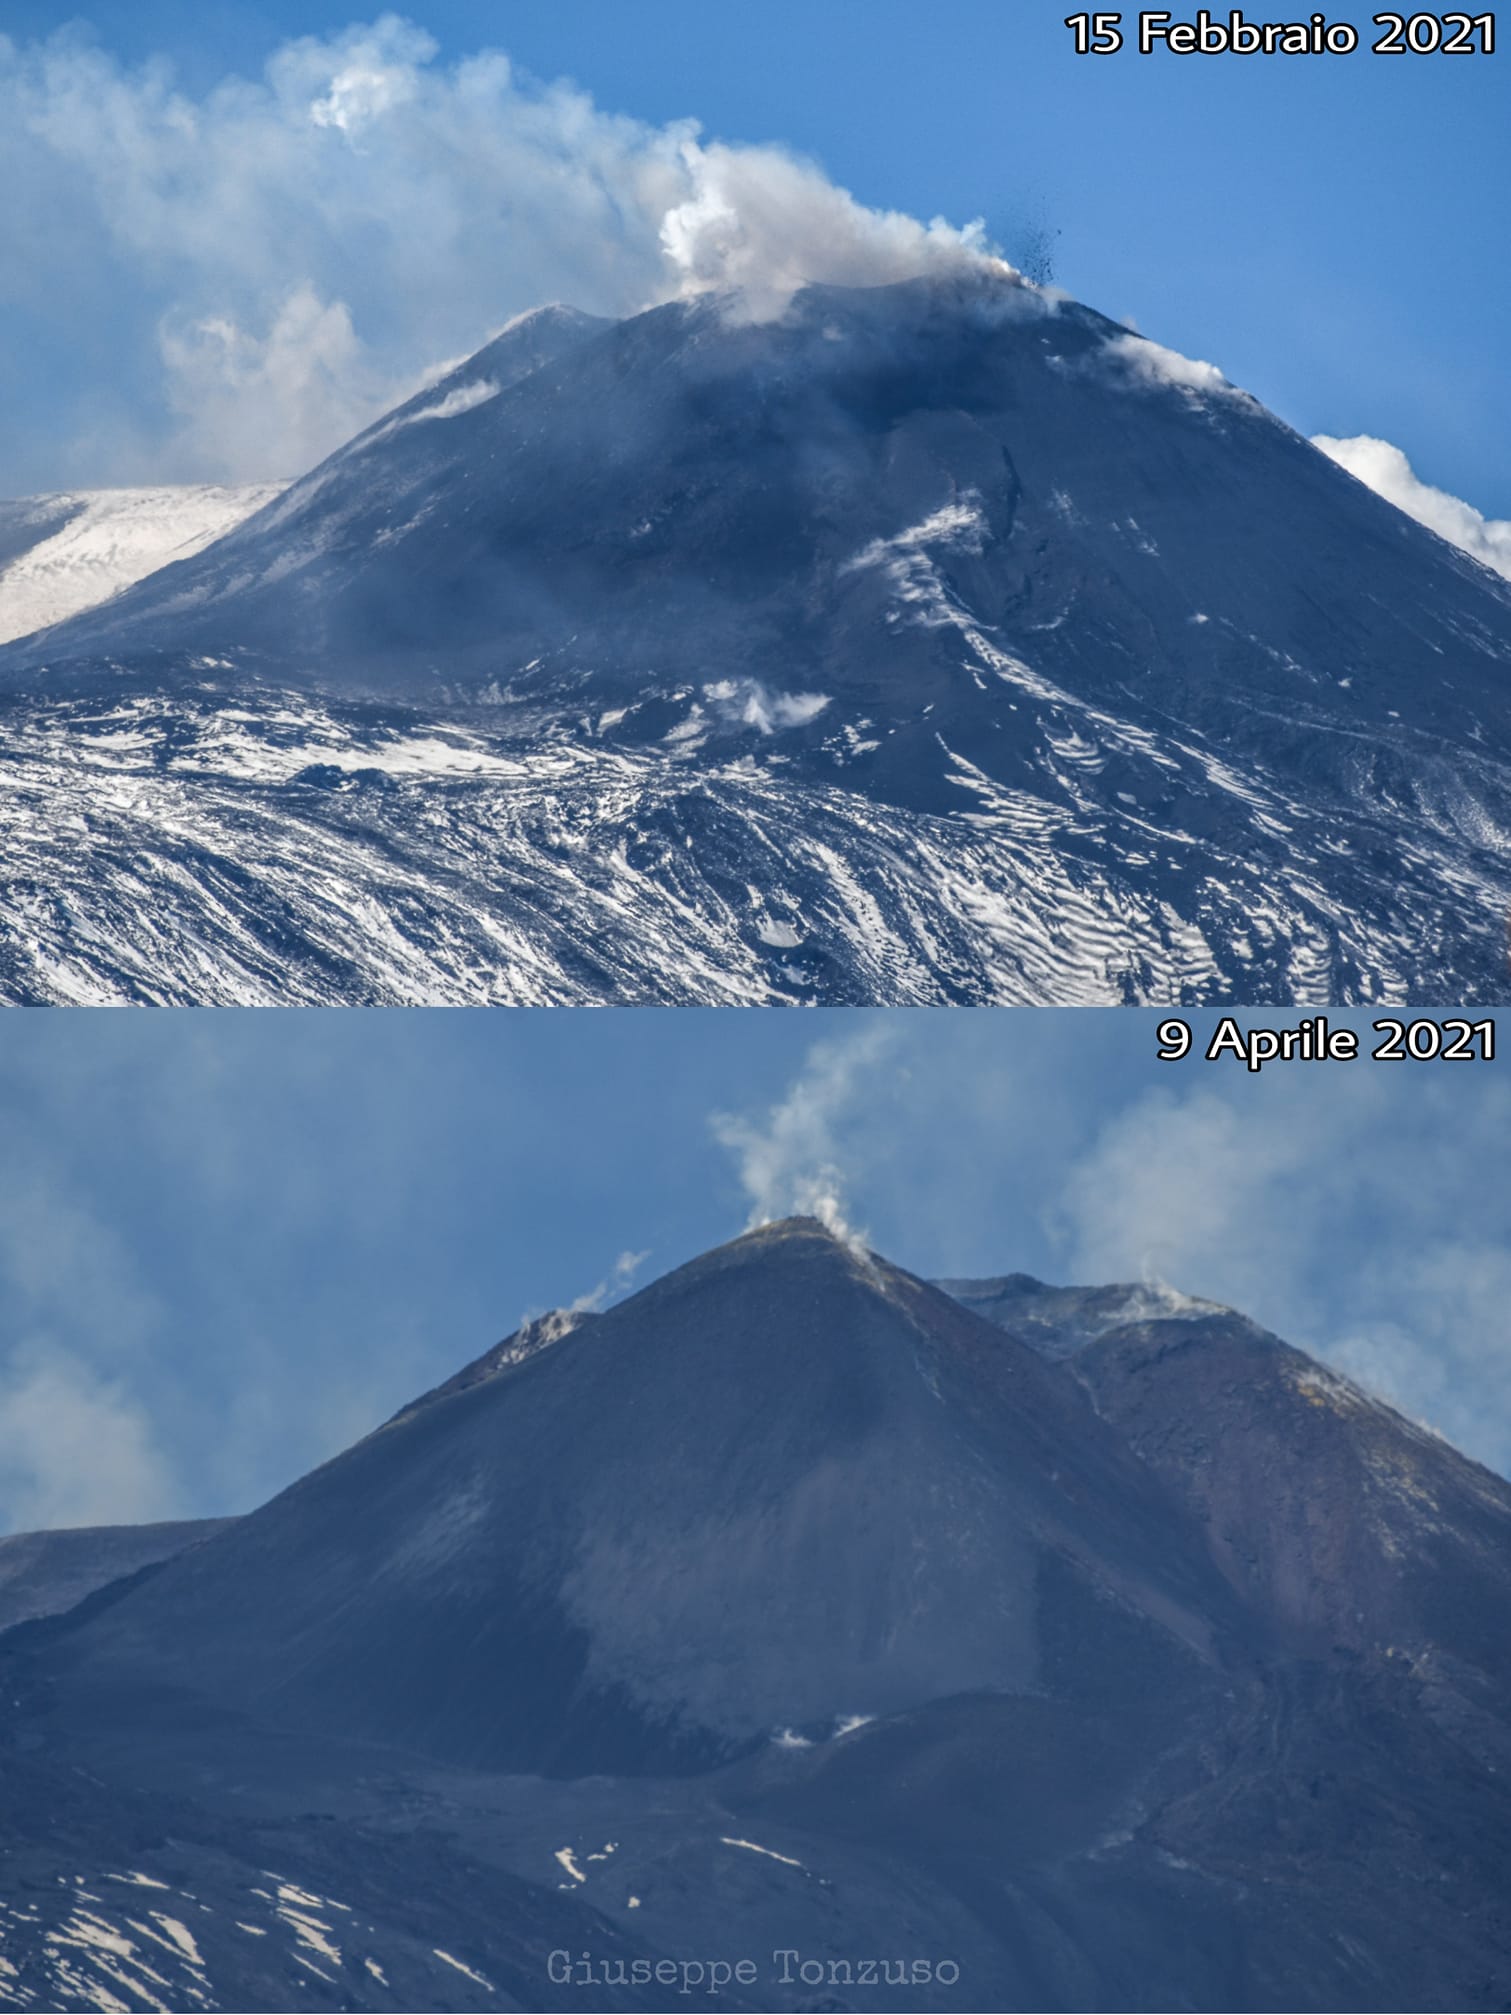
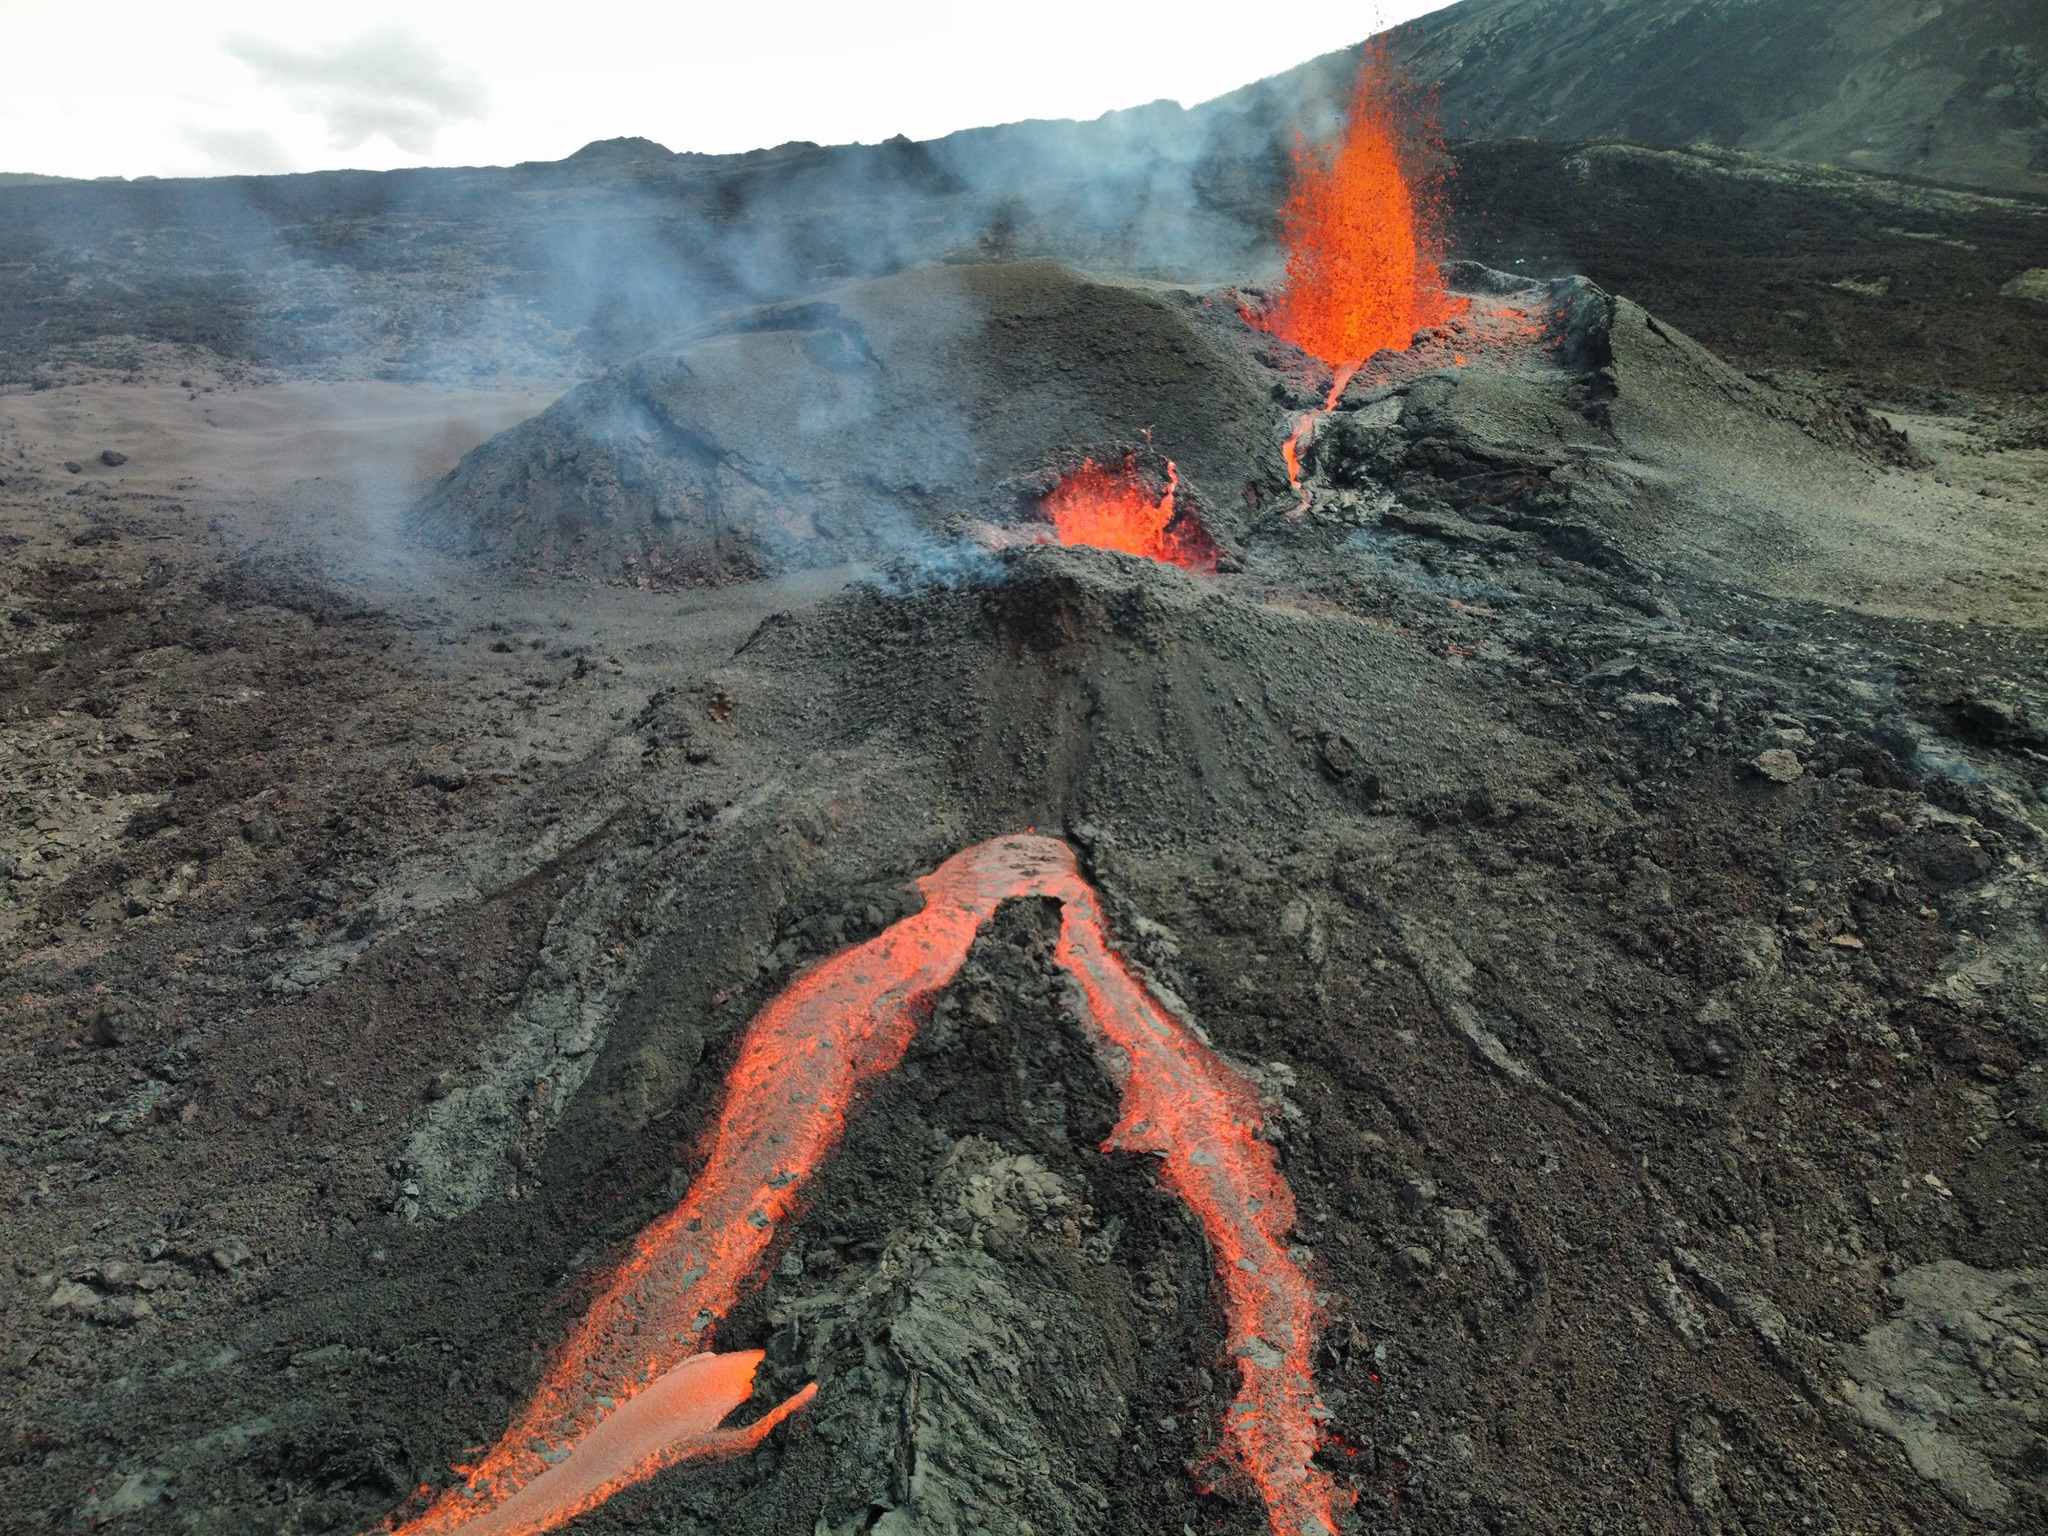
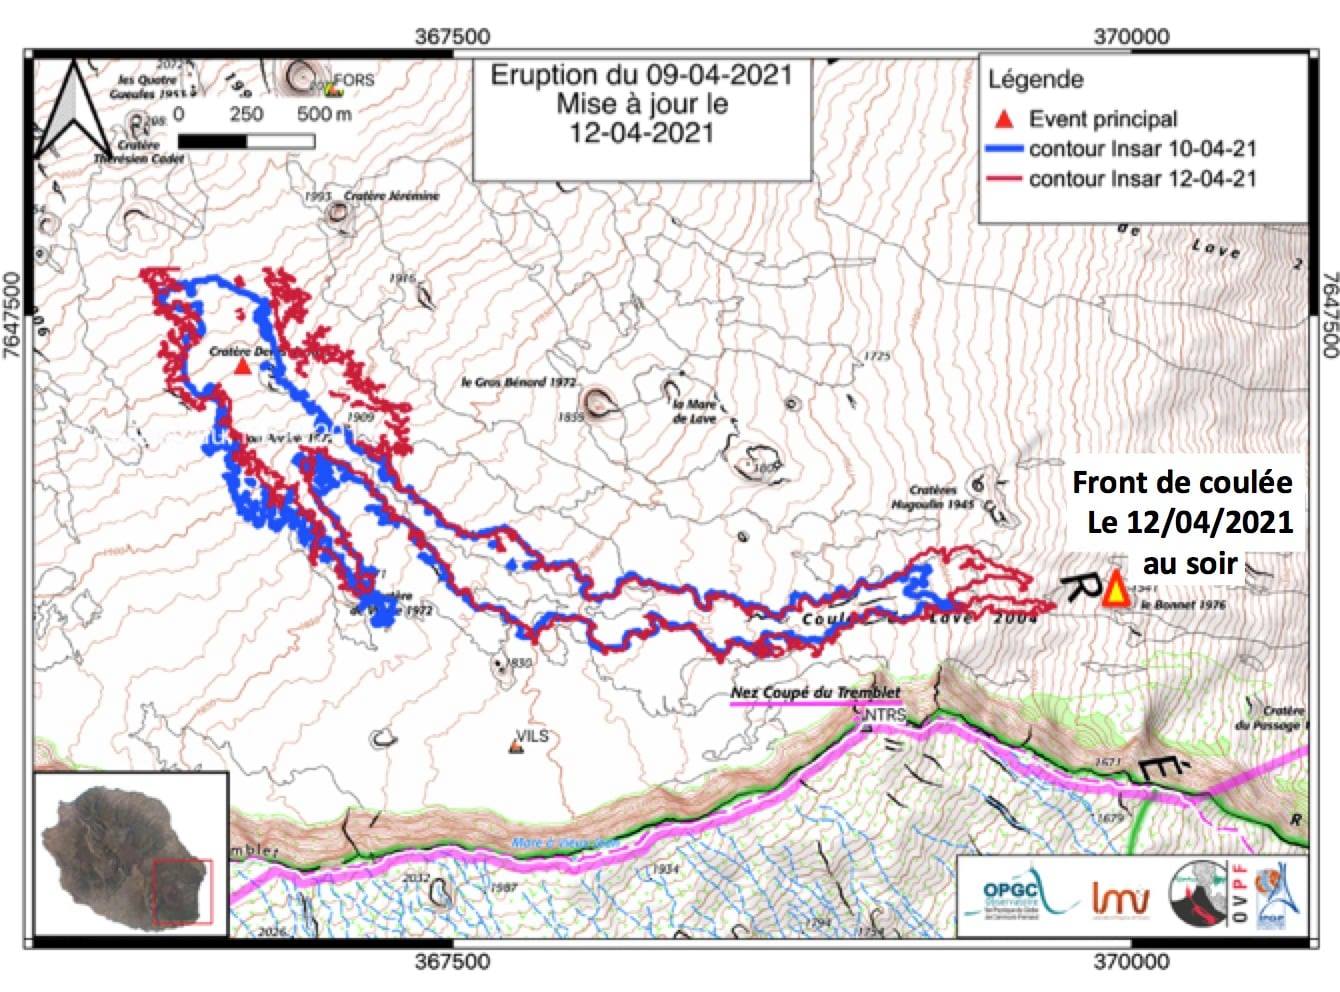
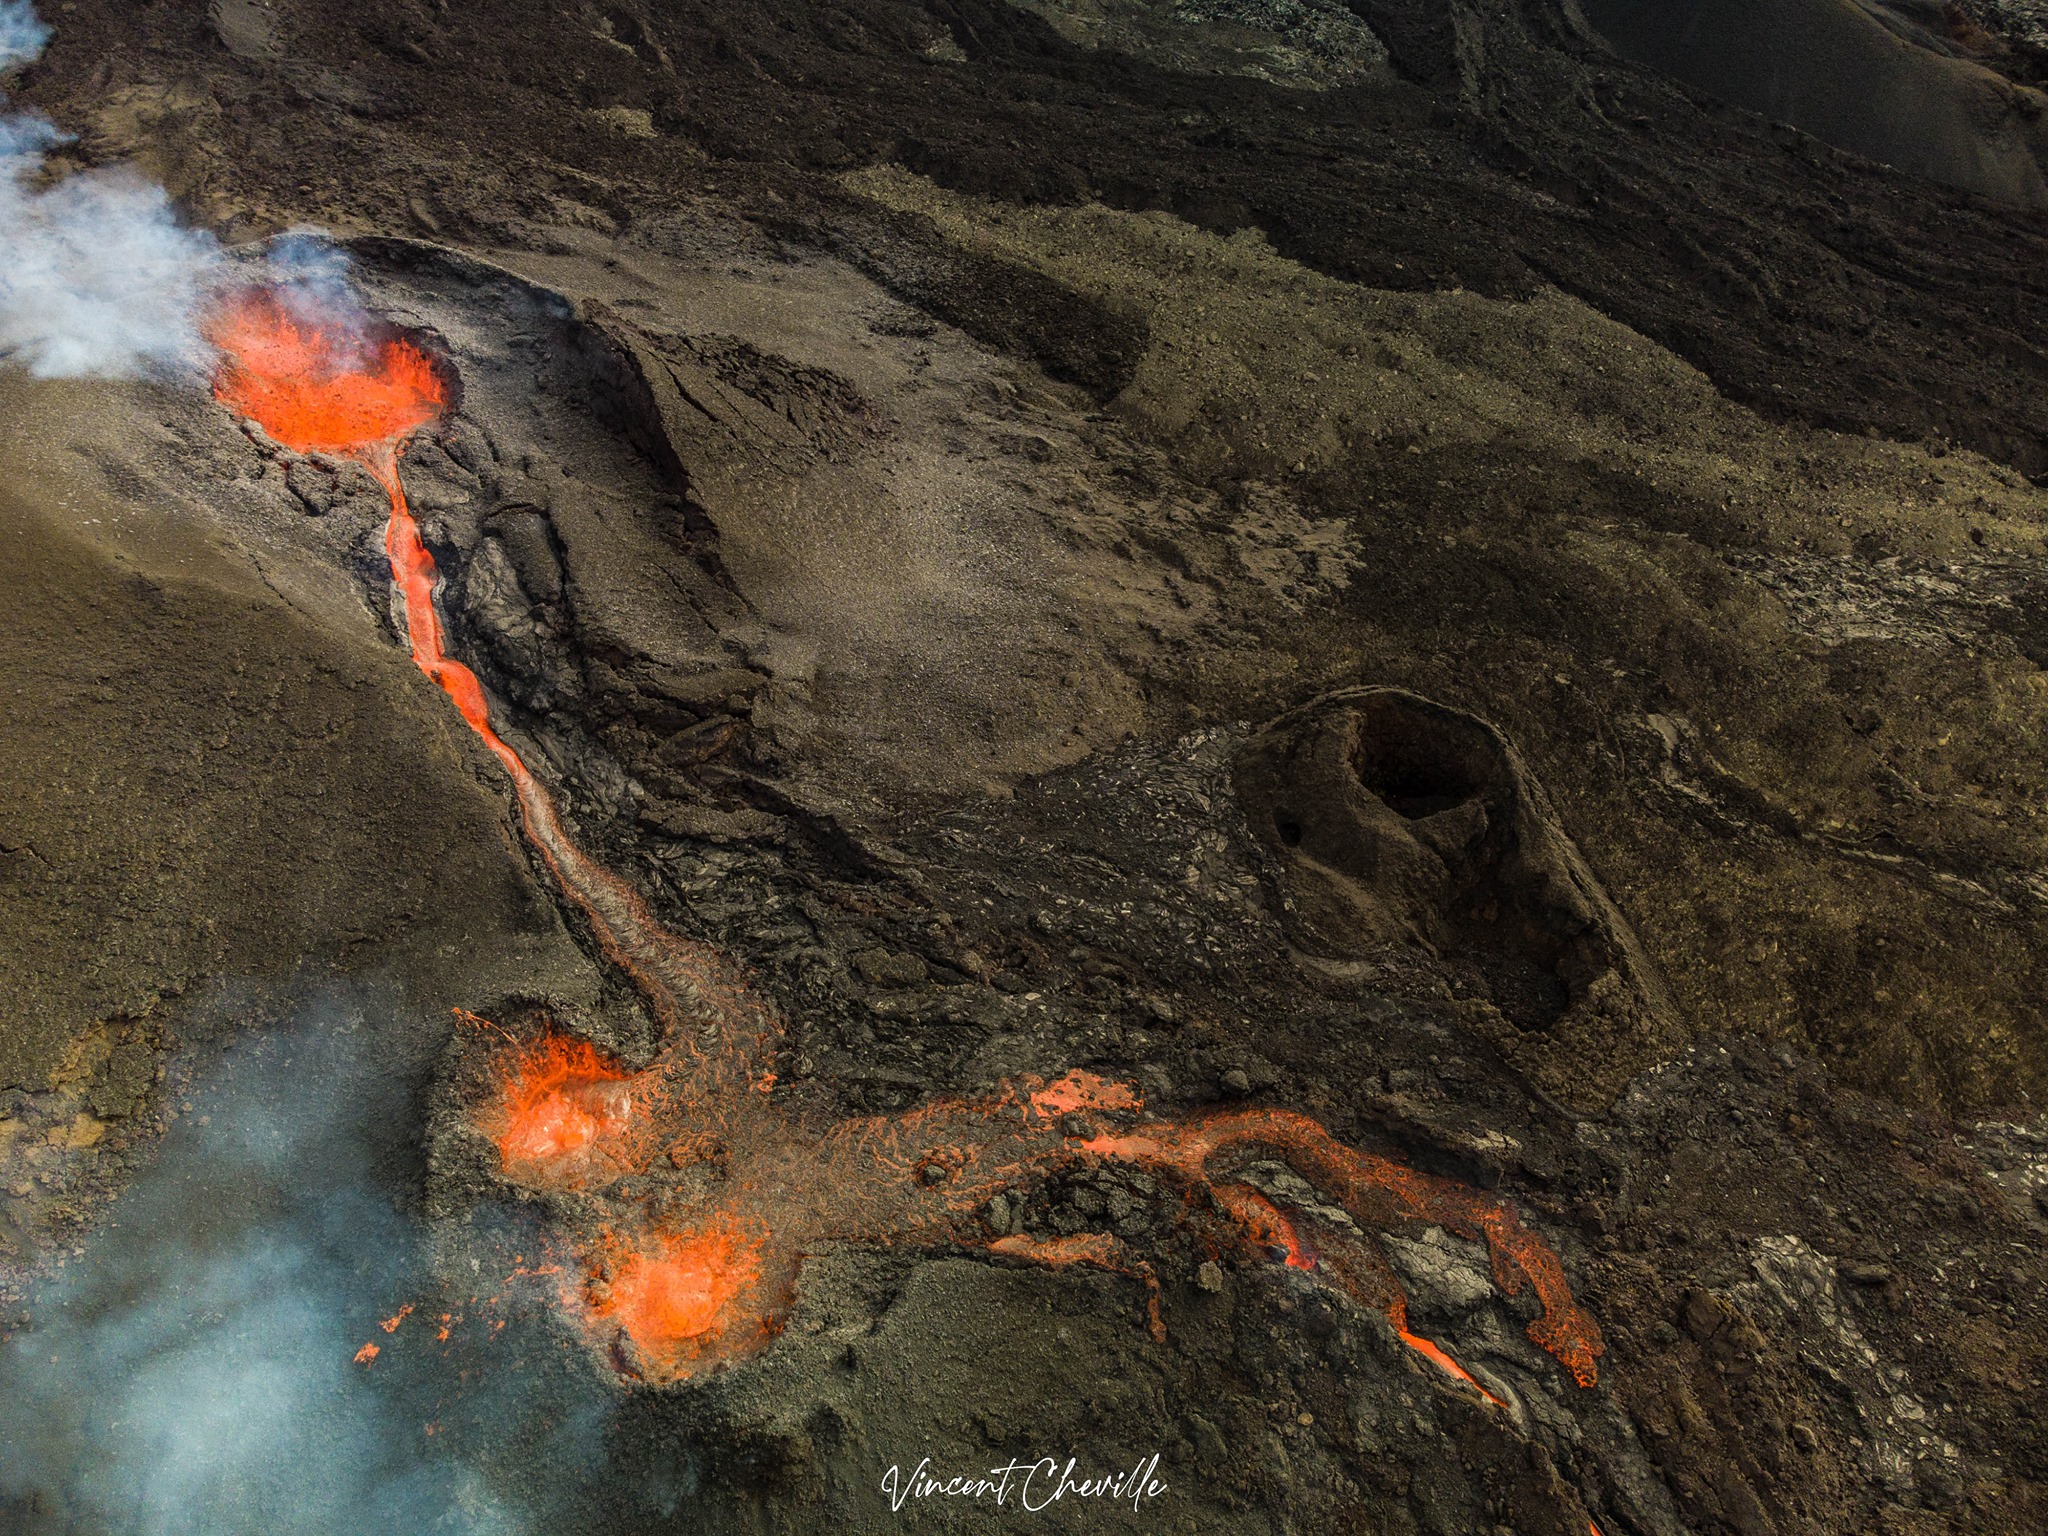
La Réunion Island , Piton de la Fournaise :
Press release of April 19, 2021 – 2:00 p.m.
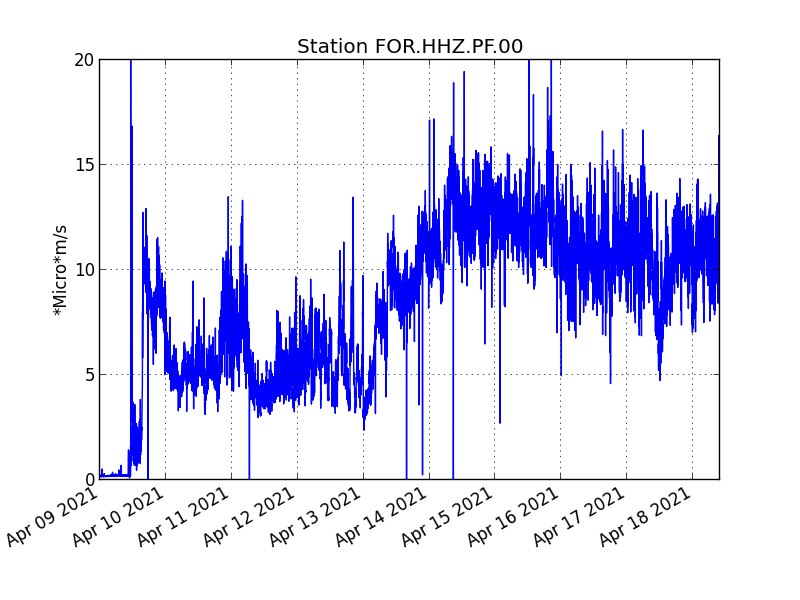
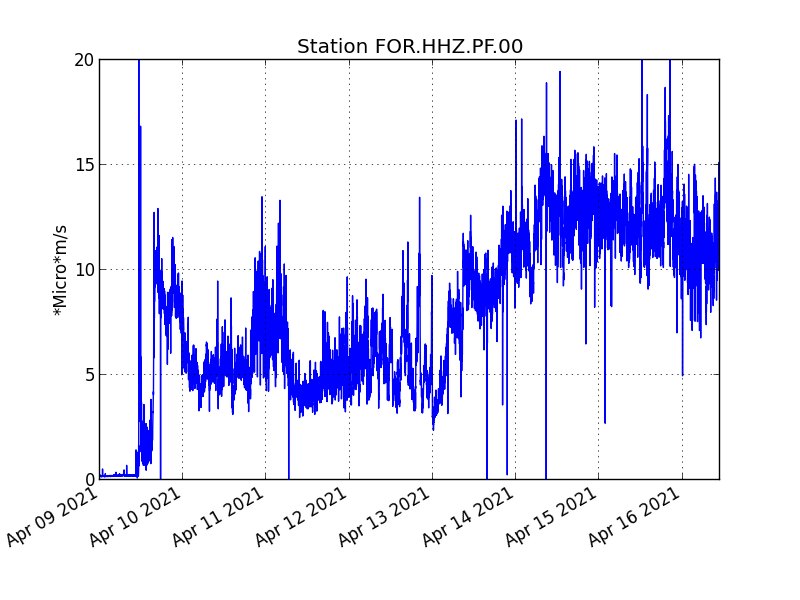
The eruption that started on 04/09/2021 at 7 p.m. (appearance of the tremor) continues. The intensity of the volcanic tremor (indicator of a surface lava emission) over the last 24 hours has remained
relatively stable and comparable to that observed the previous days.
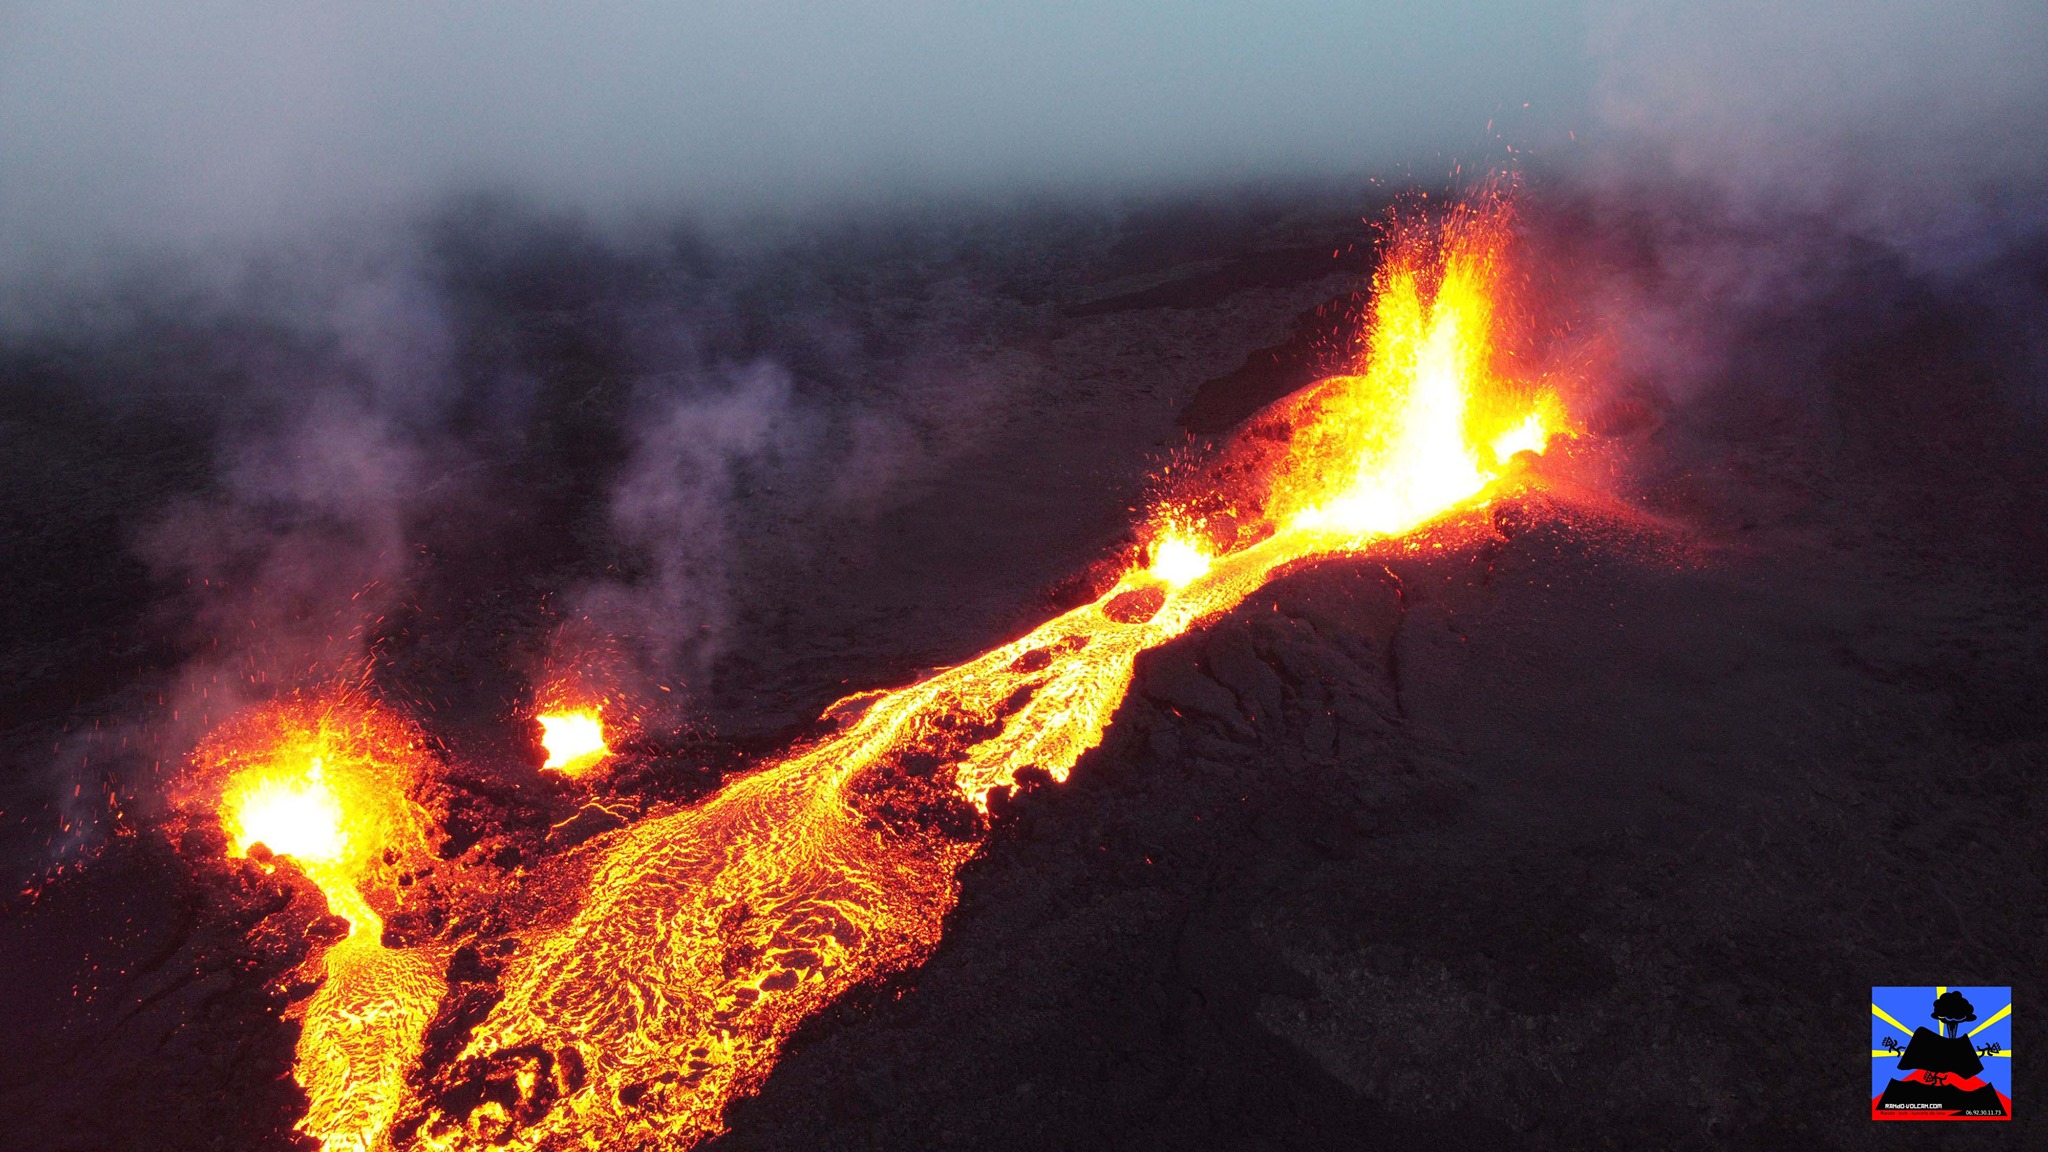
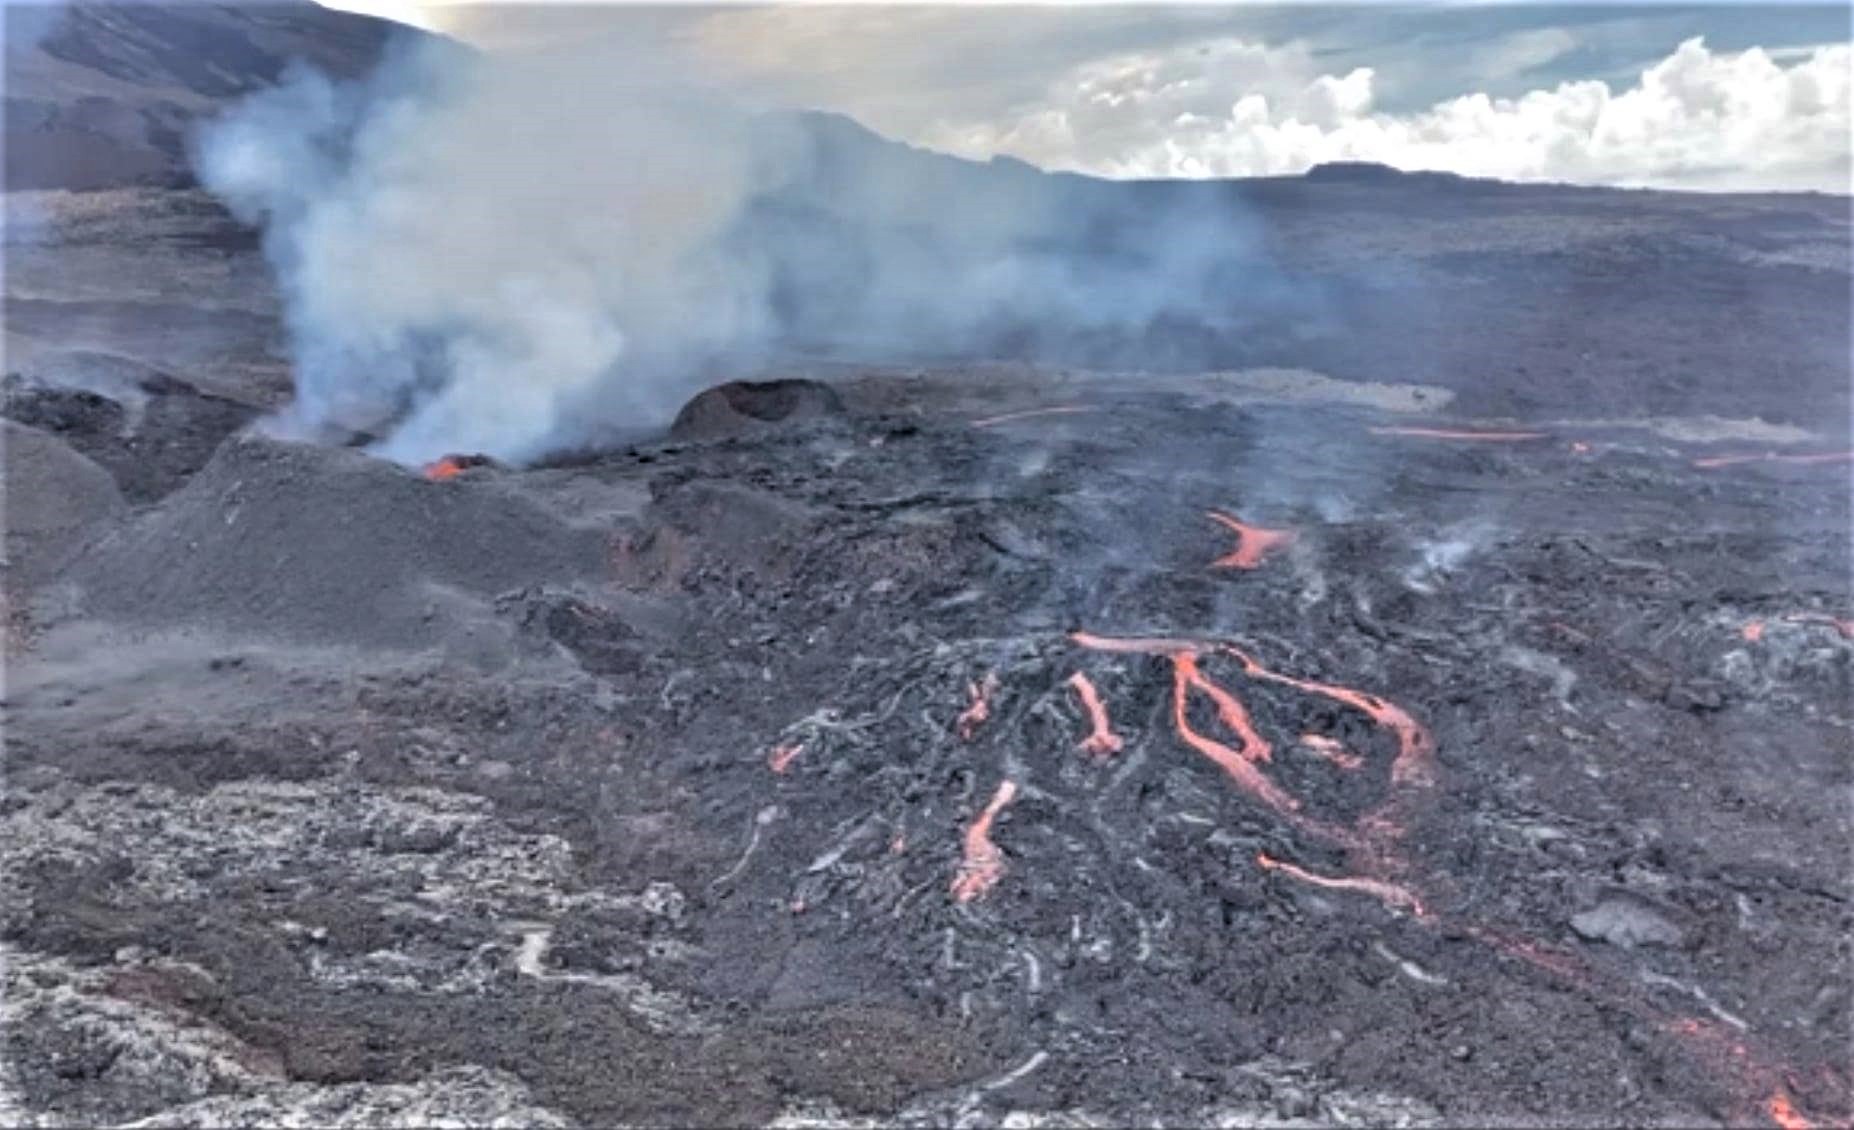
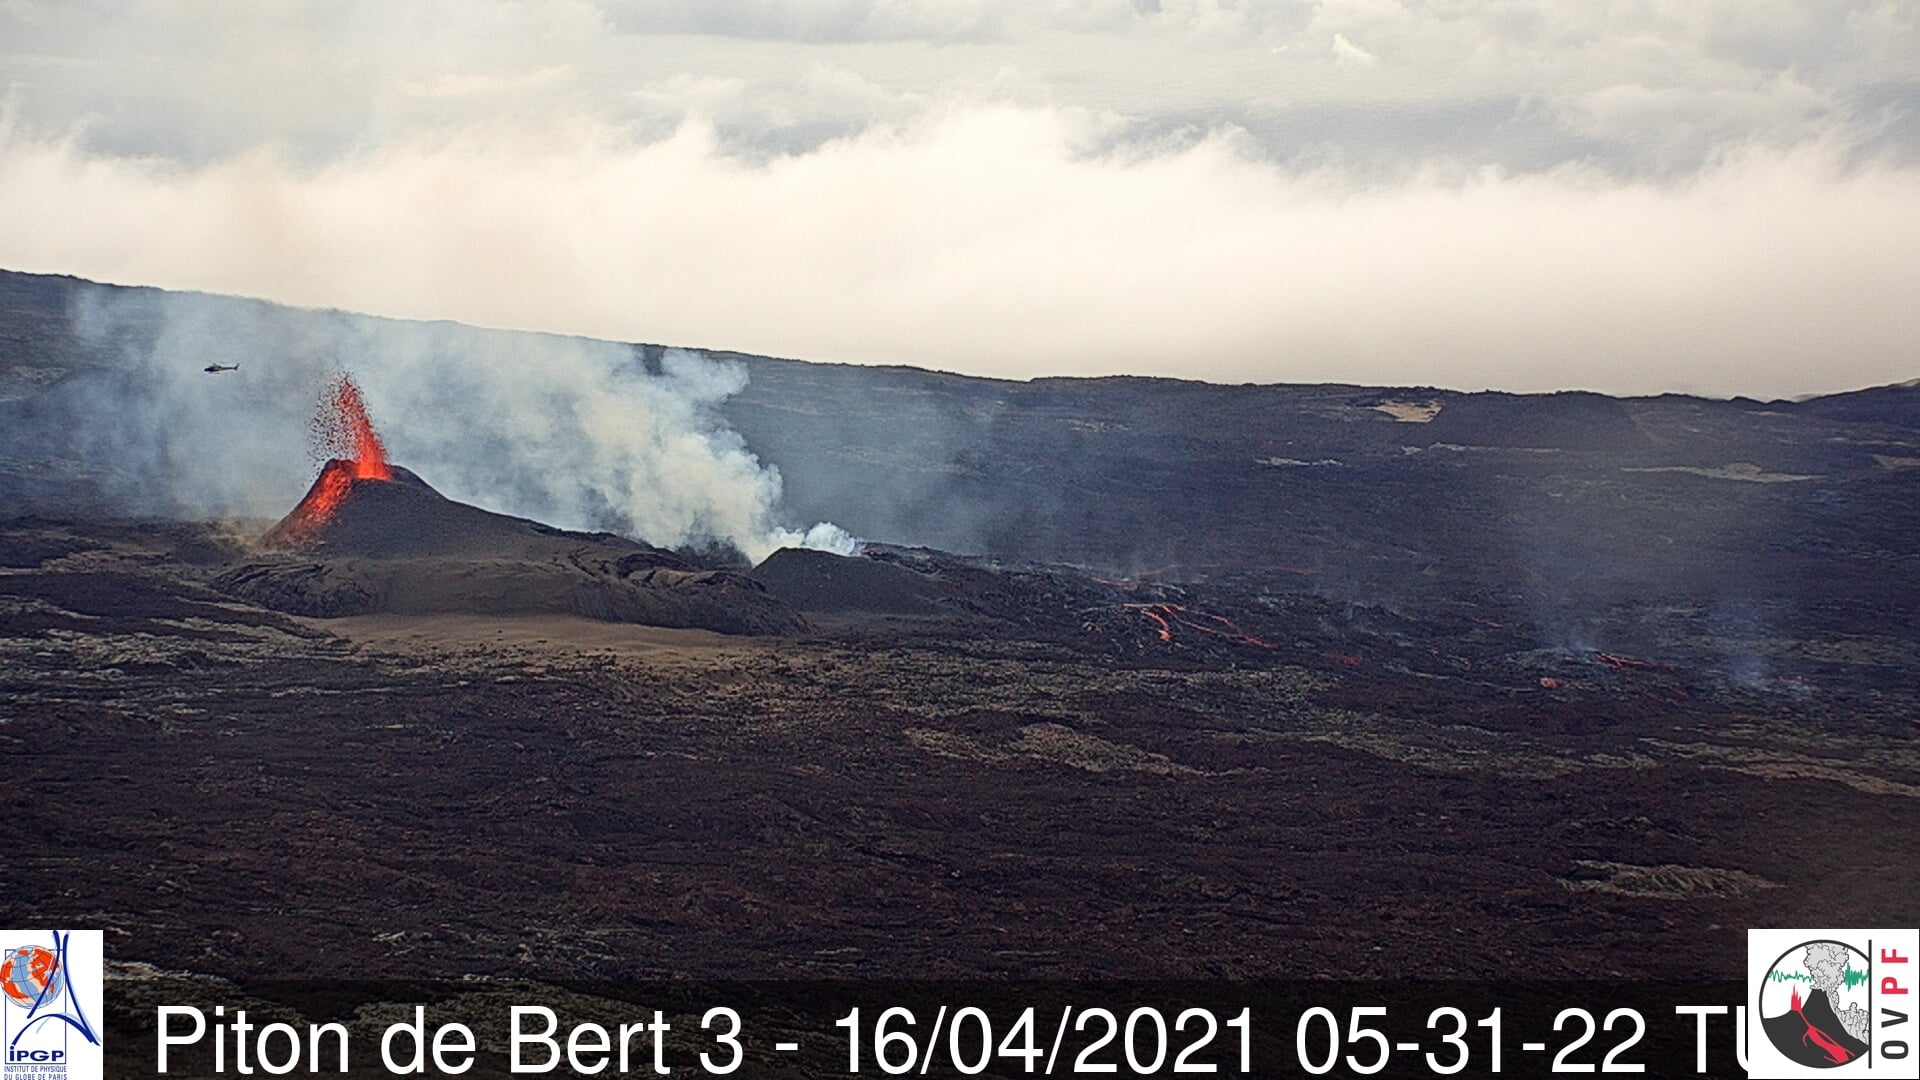
– No direct observation of the eruptive site could be made this morning given the very bad weather conditions on the volcano. However, we note that the lava fountain activity continues.
– Over the last 24 hours, 12 superficial volcano-tectonic earthquakes (between sea level and the surface) have been recorded under the summit craters.
– The CO2 fluxes in the soil are again on the rise both in the far field (Plaine des Cafres and Plaine des Palmistes) and in the near field (Gîte du volcano).
– The deflation of the building seems to have stopped and a slight inflation of the top seems to be emerging.
This parameter will be monitored over the next few days because it may correspond to the arrival of deep magma, highlighted by the flows of CO2 in the soil for several days, in the superficial magmatic reservoir that feeds the current eruption. It should be noted that during the eruptions of January and July 2017 and of April and September 2018 of long duration (> 3 weeks) such a refeeding during the eruption had been observed allowing feeding of the eruptive site over time, and that arrivals of deep magma have often been associated with changes in eruptive activity (explosiveness in 2016 and 2020; increased flow rates; opening of new cracks, etc.).
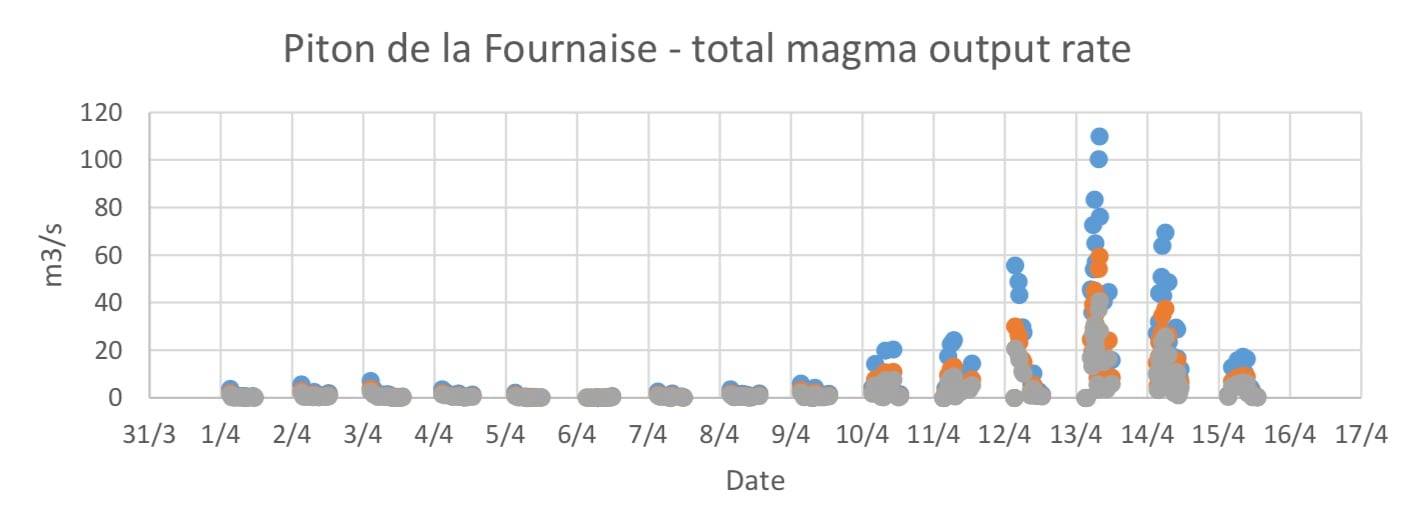
– The very unfavorable weather conditions on the Piton de la Fournaise did not make it possible to obtain an estimate of the lava flow today either by terrestrial method deduced from SO2 measurements, or from satellite data via the HOTVOLC platform (OPGC – Clermont Auvergne University).
Alert level: Alert 2-2
Source : OVPF.
Read the article : https://www.ipgp.fr/sites/default/files/ovpf_20210419_14h00_communique_eruption.pdf
Photo : Vincent Tunneldelave Réunion ( https://rando-volcan.com )
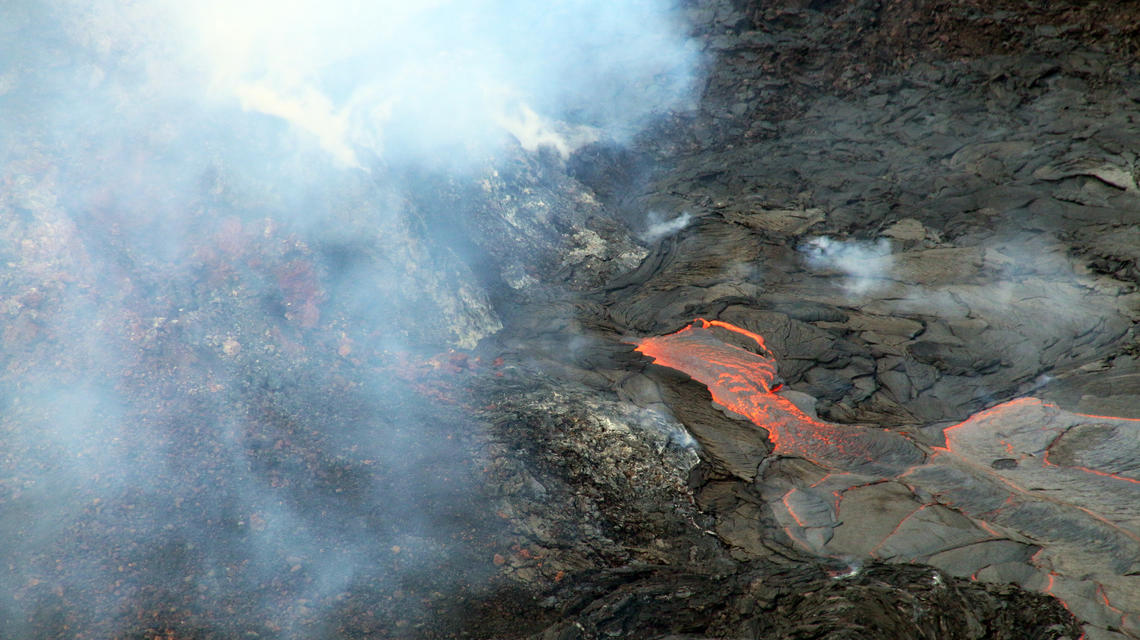
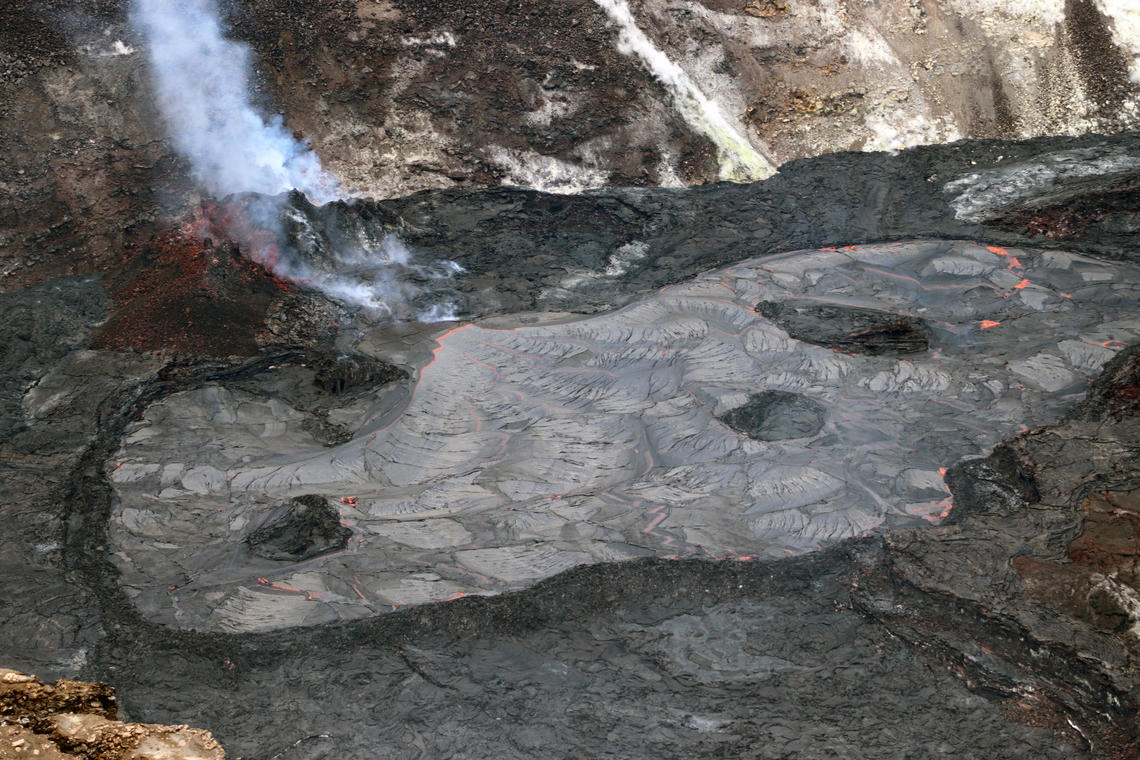
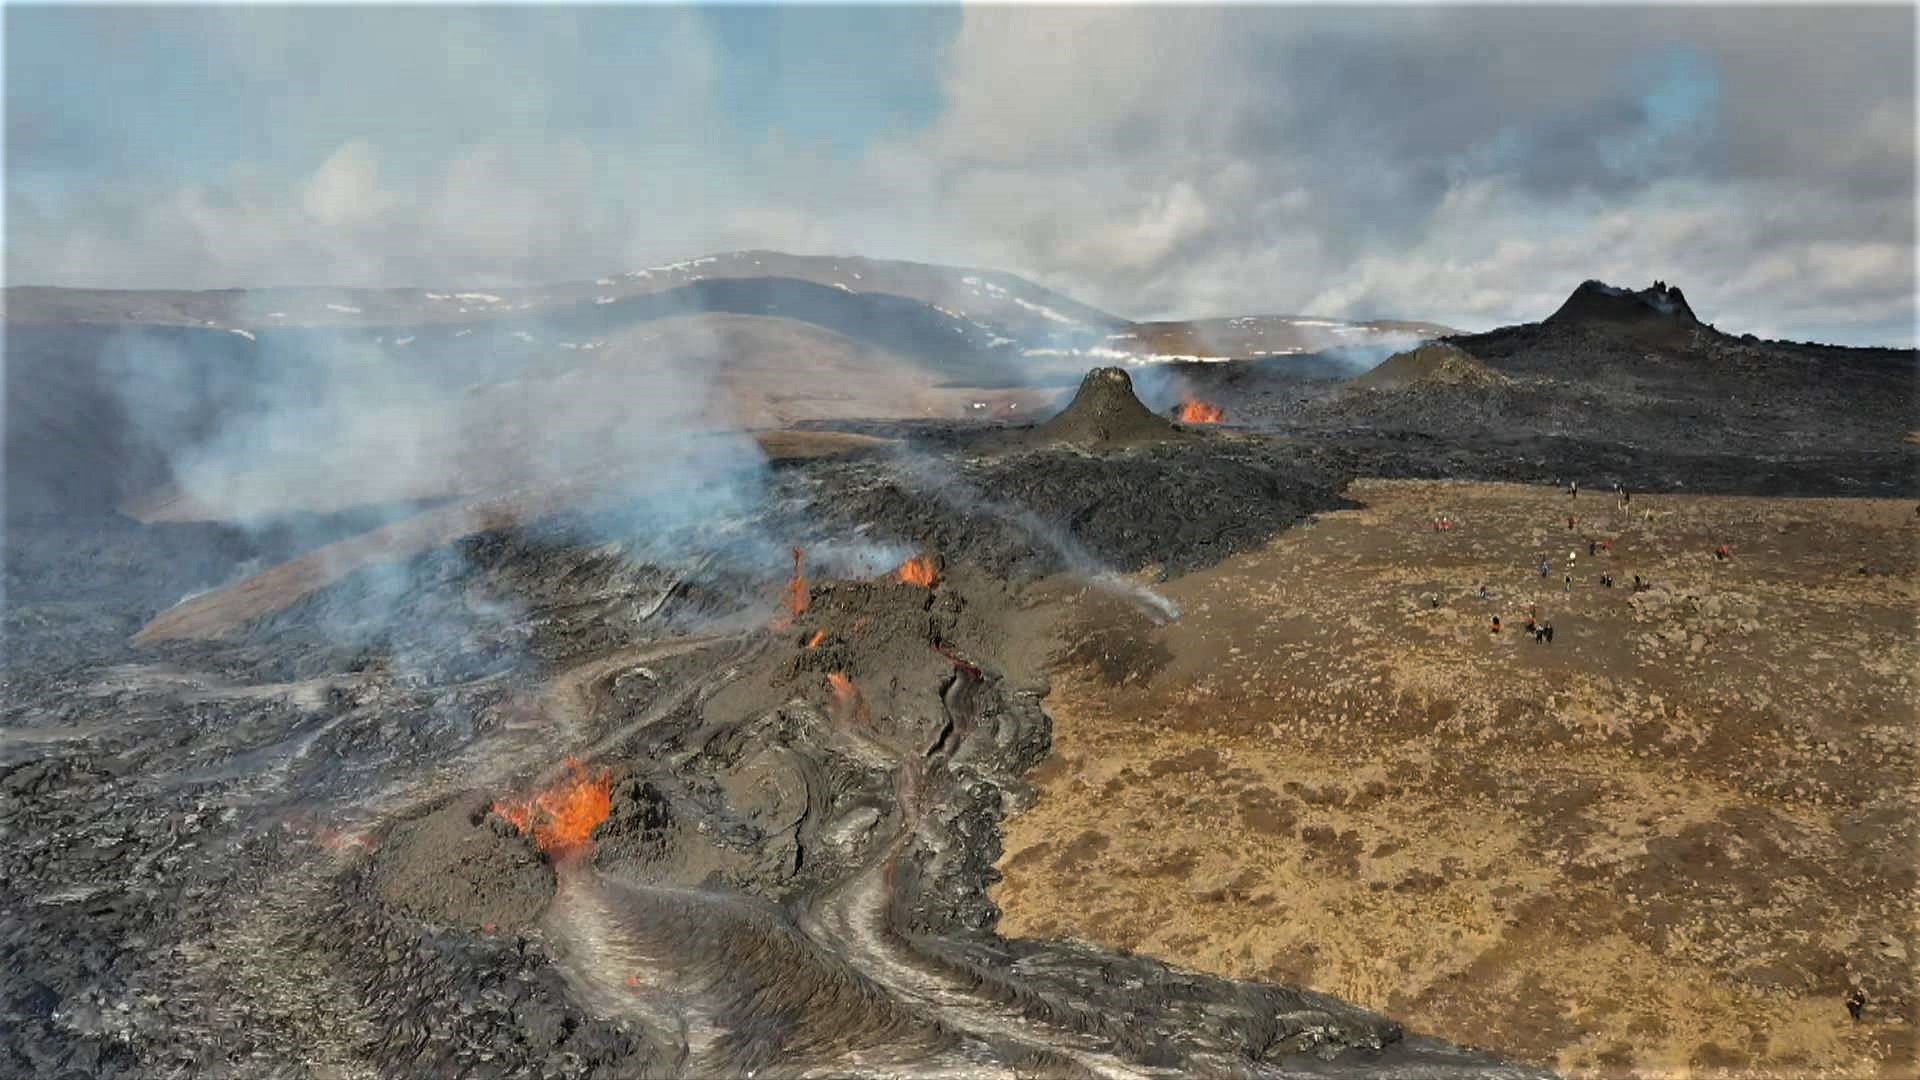
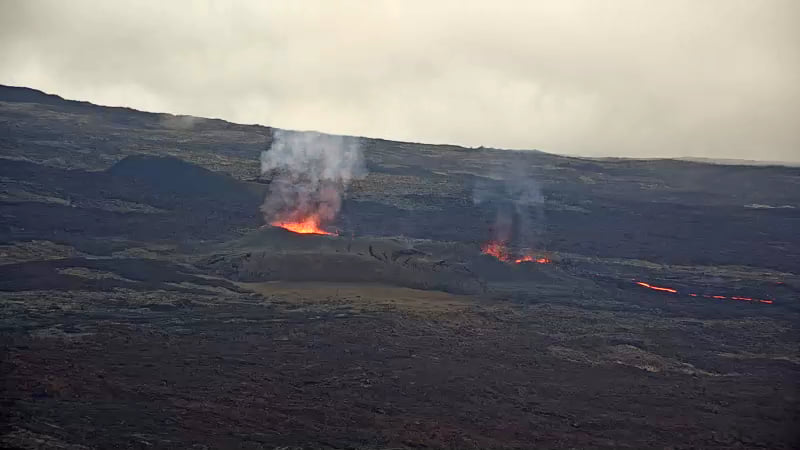
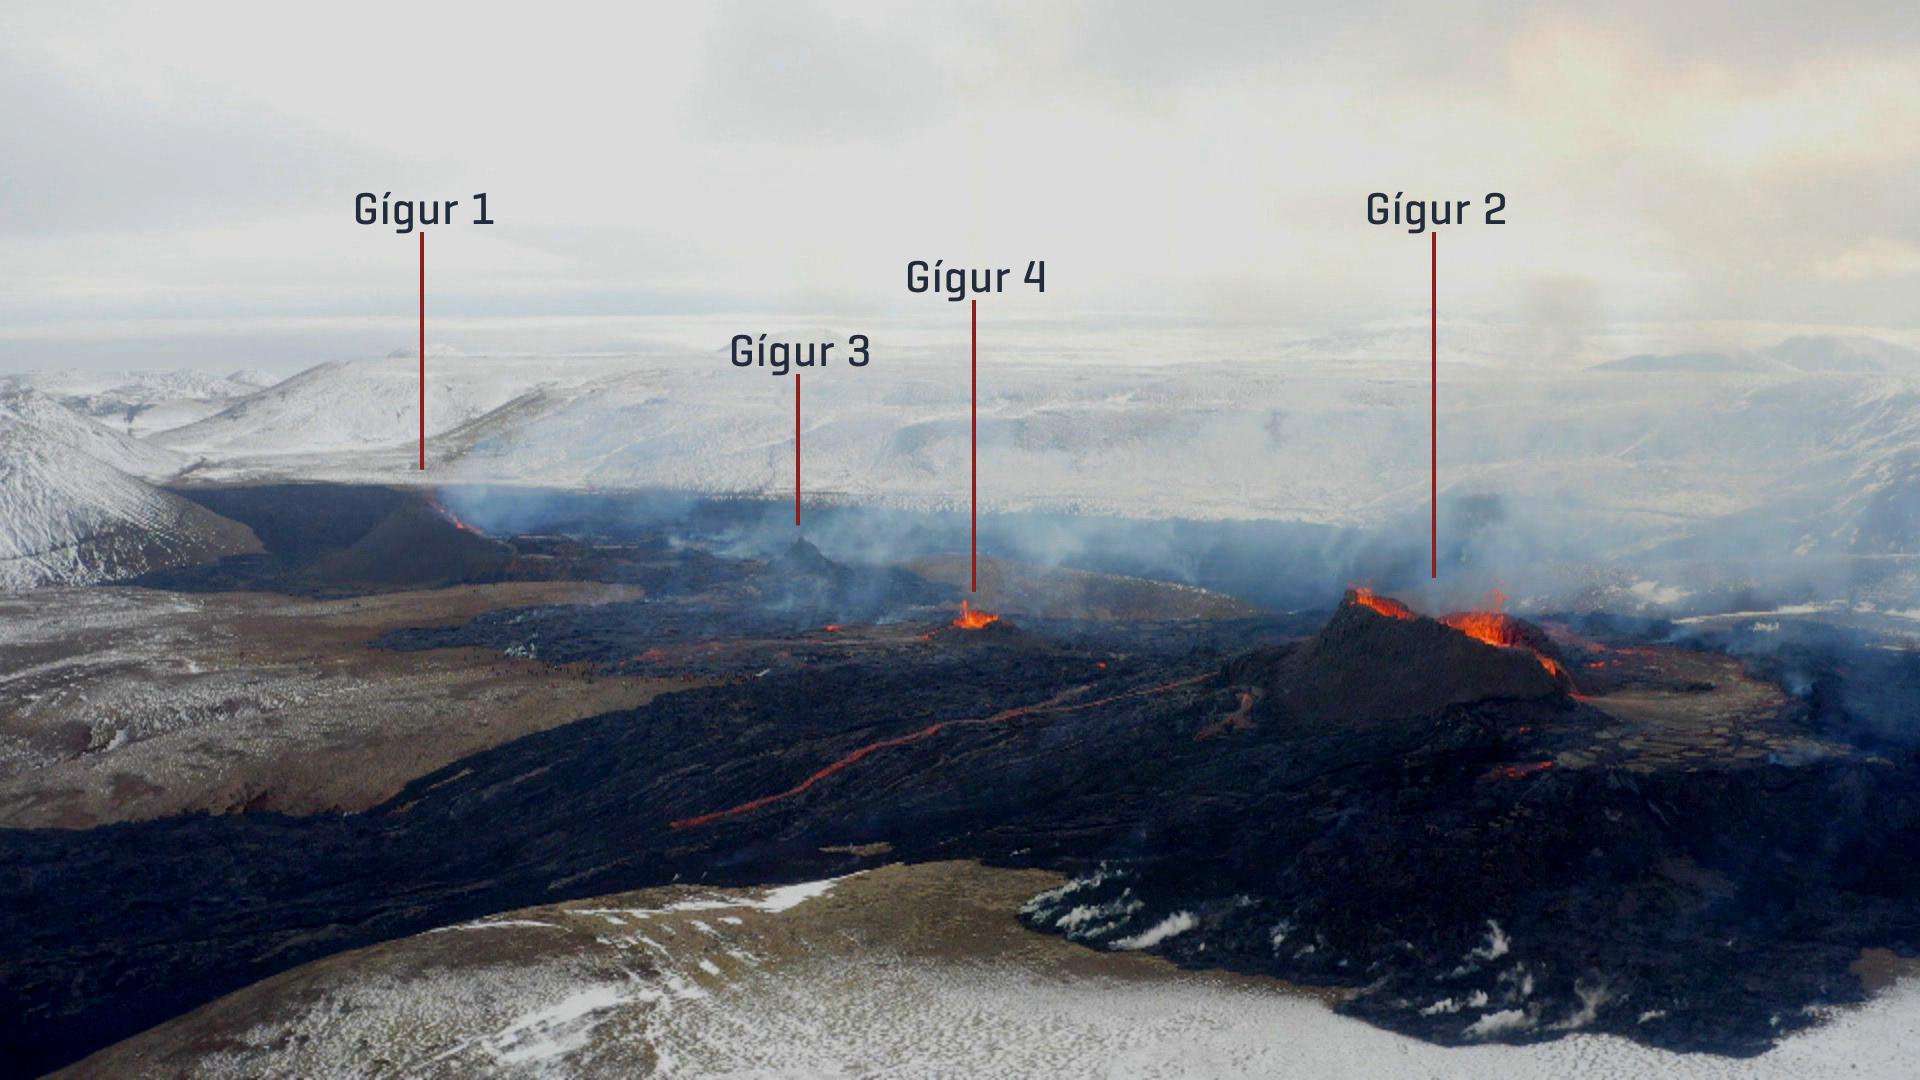
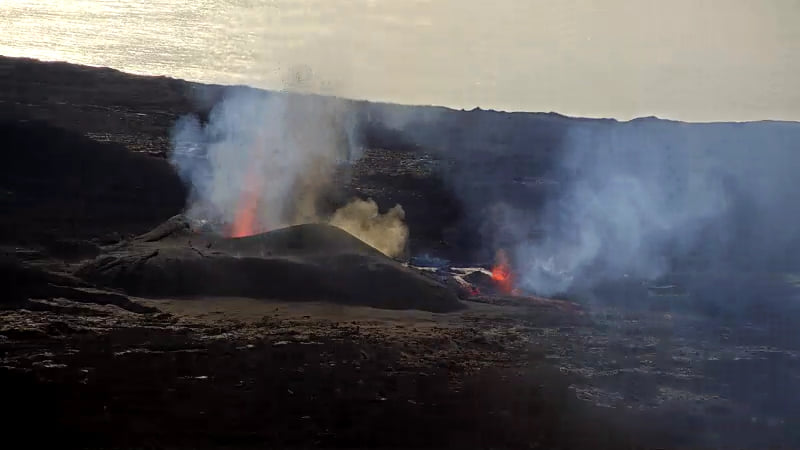
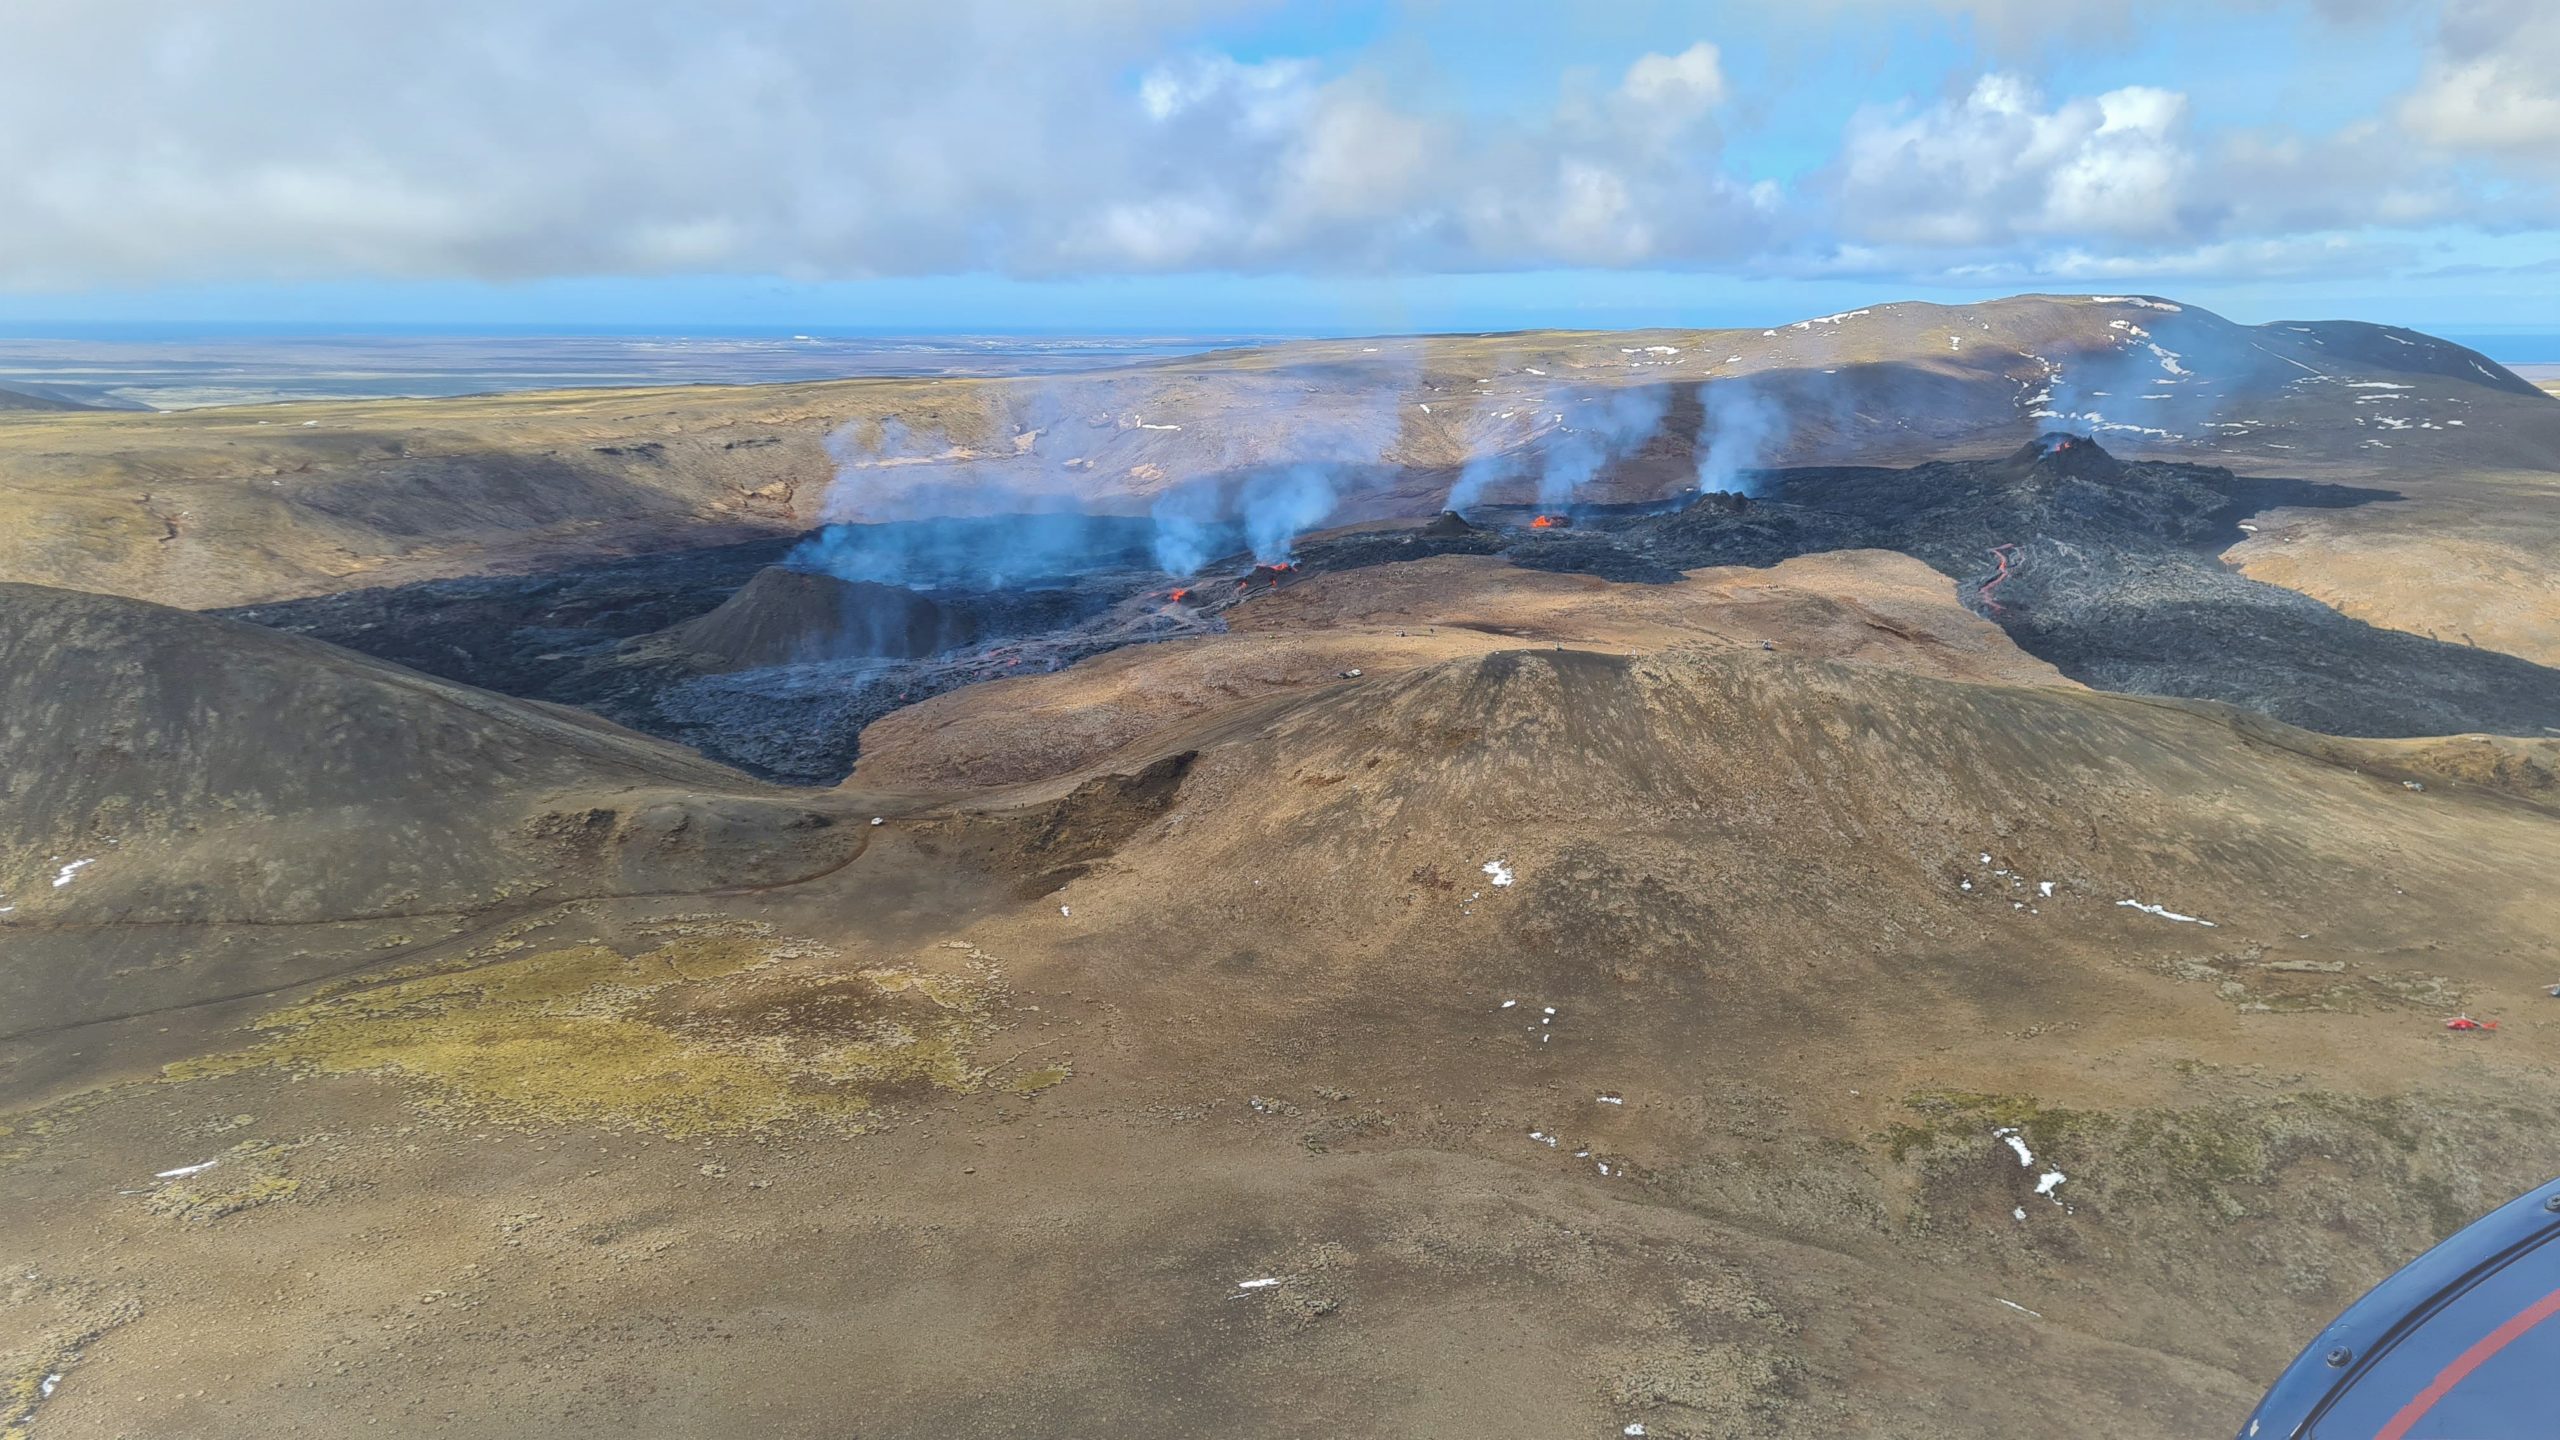
Iceland , Geldingadalur :
Updated April 19, 2019 at 12:10 p.m.
Today, around 30 days have passed since the eruption began in Fagradalsfjall. A summary from the University Institute of Earth Sciences indicates that the average lava flow for the first 30 days is 5.6 m3 / s. Compared to most other eruptions, the flow is relatively stable. Lava flow measurements now show that there has been some increase in the past 1-2 weeks. The average flow for the first 17 days was 4.5 to 5 m3 / s, but for the last 13 days it is close to 7 m3 / s.
A comparison with other eruptions shows that despite the increase, the flow is only about half of what happened on average during the first 10 days at Fimmvörðuháls in the spring of 2010, which was a small eruption. A comparison with Holuhraun shows that the current flow is 6-7% of the average lava flow during the six months that the eruption lasted. The flow is similar to that of Surtsey for the longest period from the start of the eruption in April 1964 until the end of June 1967.
The area of the lava flow reached 0.9 km2, and the total volume is now more than 14 million cubic meters.

The two northernmost craters of the Geldingadalur / Fagradalsfjall eruption have ceased their activity. These are the two craters that formed on the second day of Easter. Salóme Jórunn Bernharðsdóttir, nature conservation specialist at the Meteorological Office, confirms this in a conversation with mbl.is and claims that geologist Birgi Óskarsson was the first to notice it during a flight over the region yesterday. It is impossible to say how important this will be for the rash. Whether or not that marks the beginning of the end. “So far, the lava flow has been fairly regular, although new craters have opened,” says Salóme.
Source : vedur.is/um-vi/frettir
Photo : Almannavarnir/Björn Oddsson , Benjamin Hennig
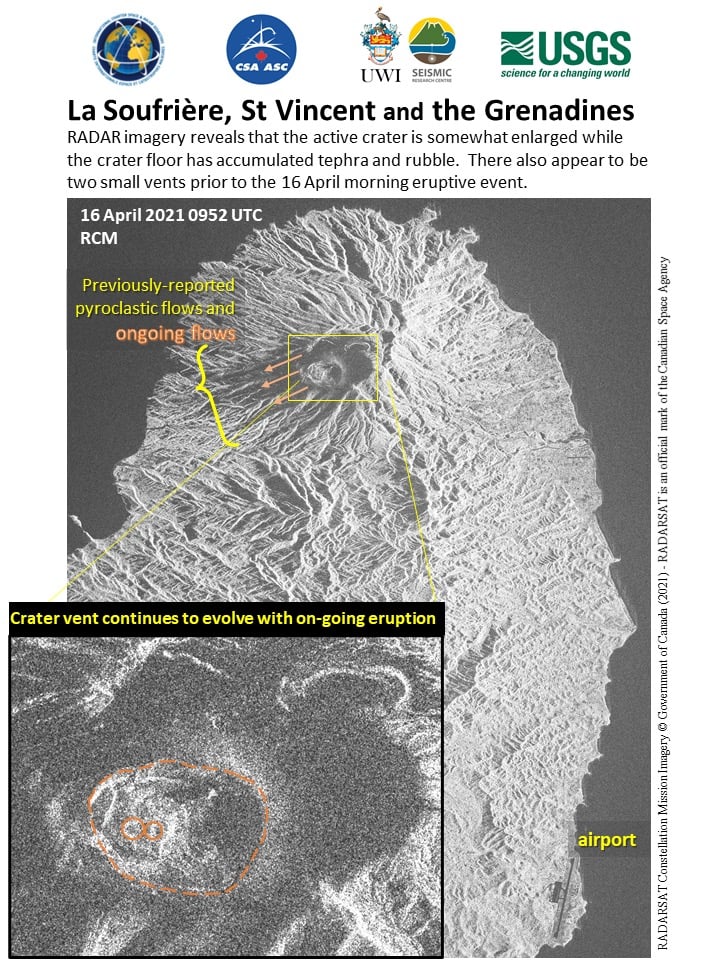
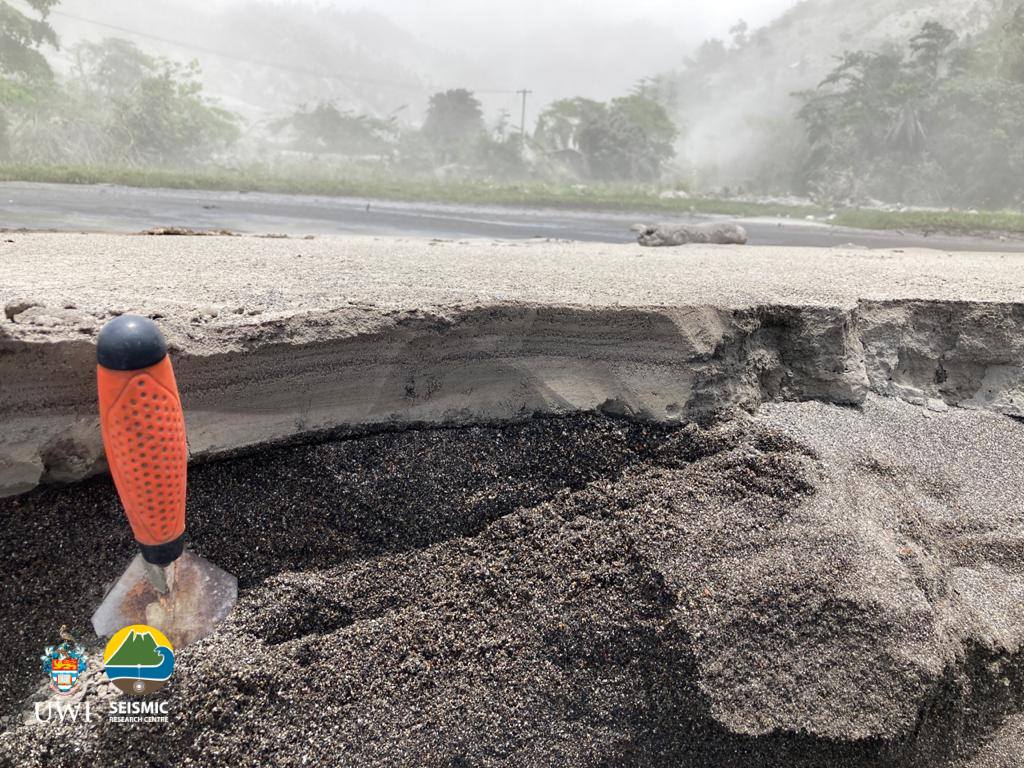
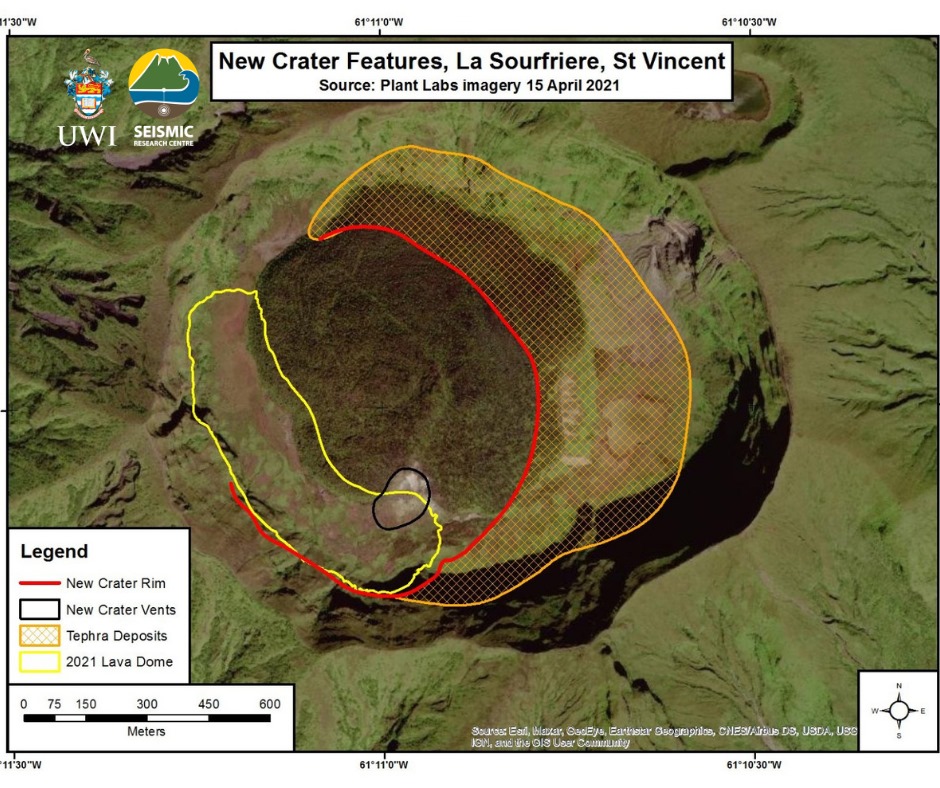
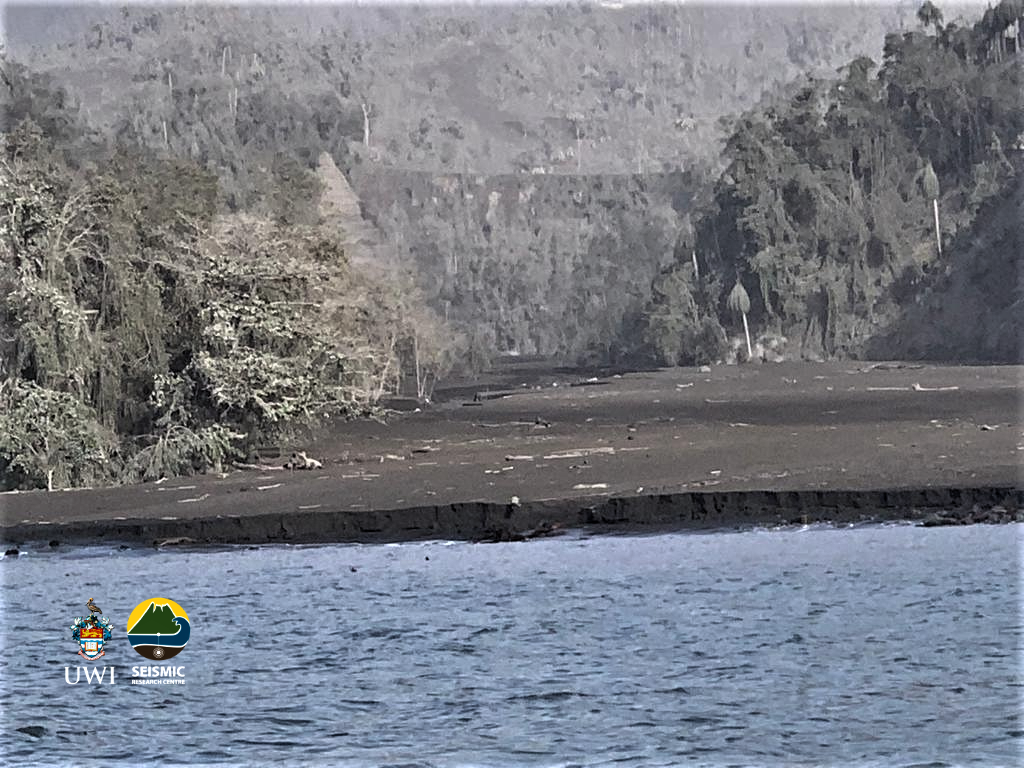
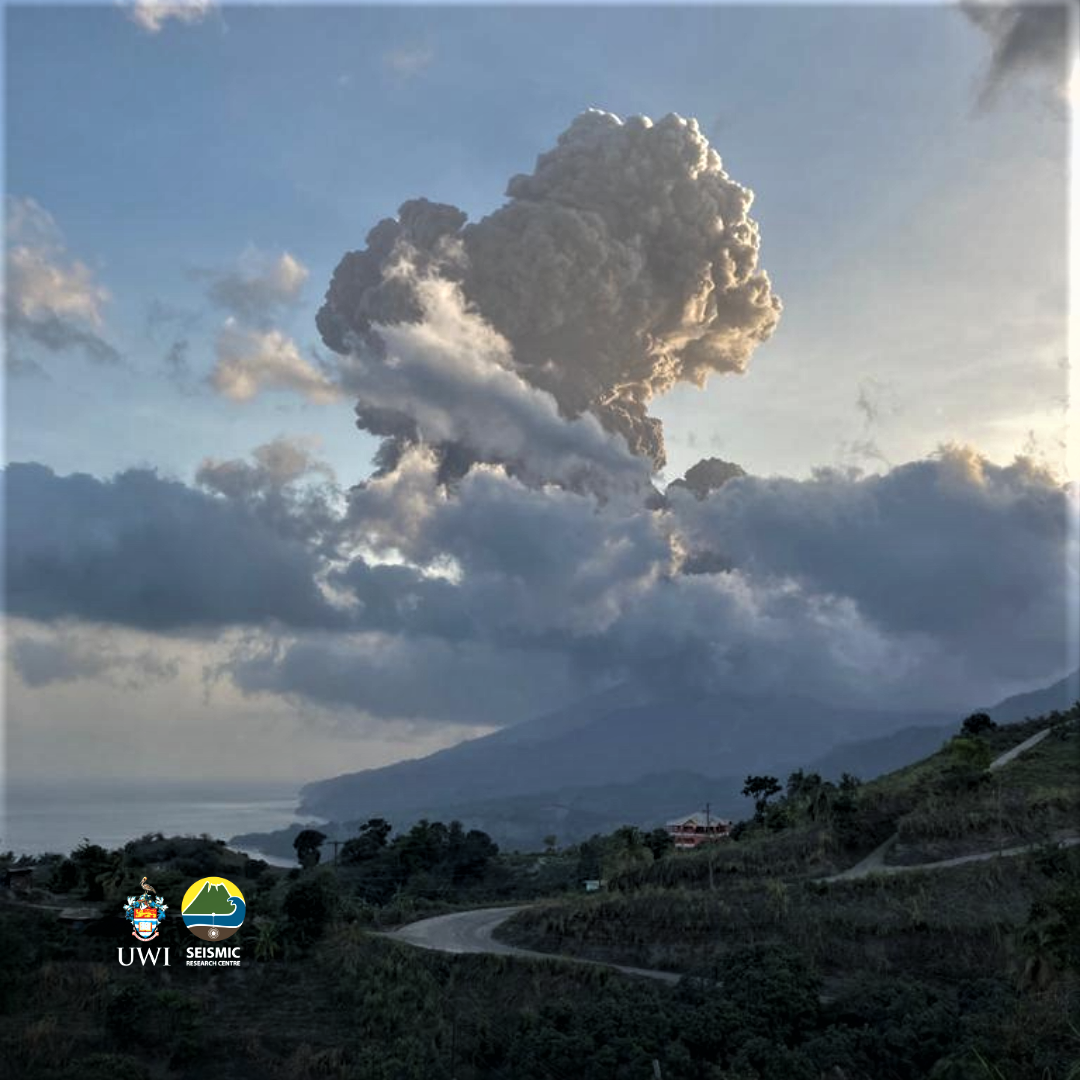
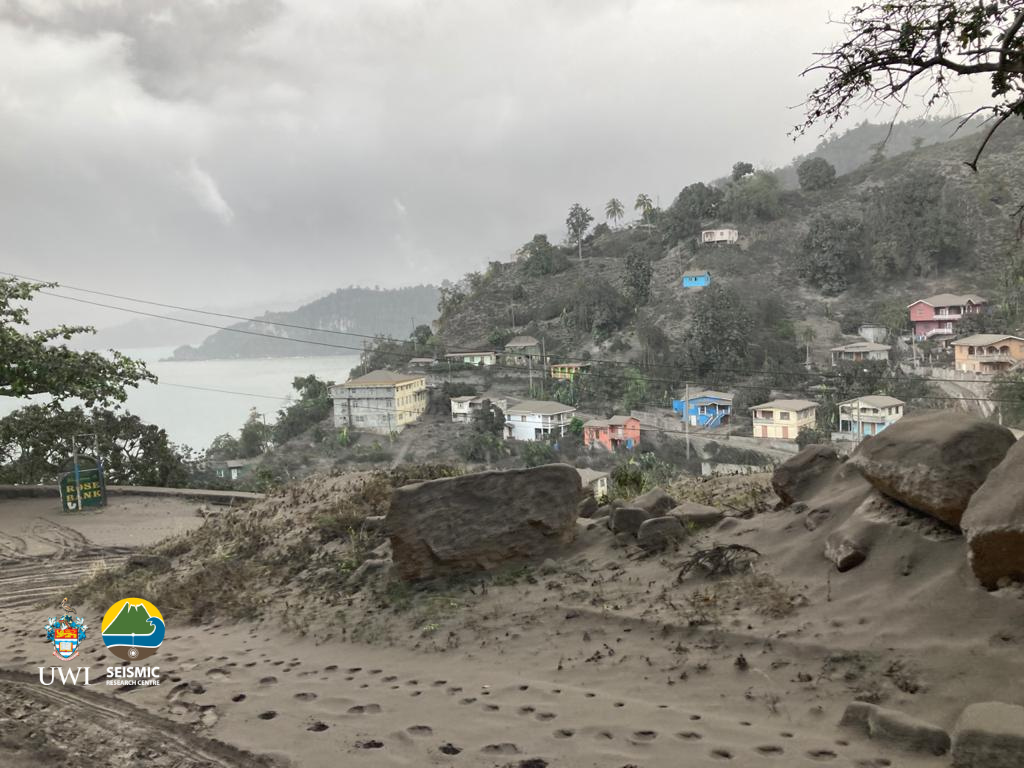
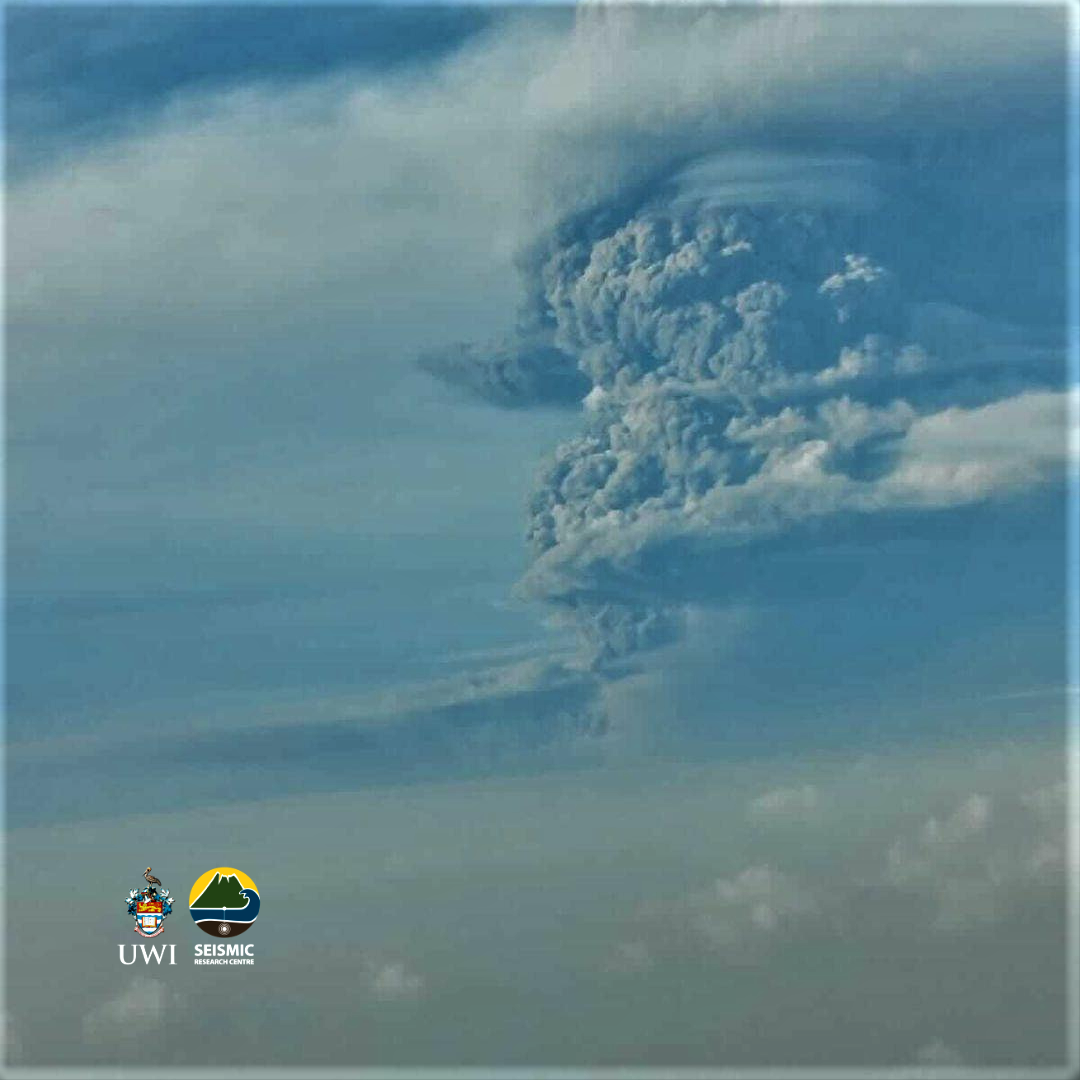
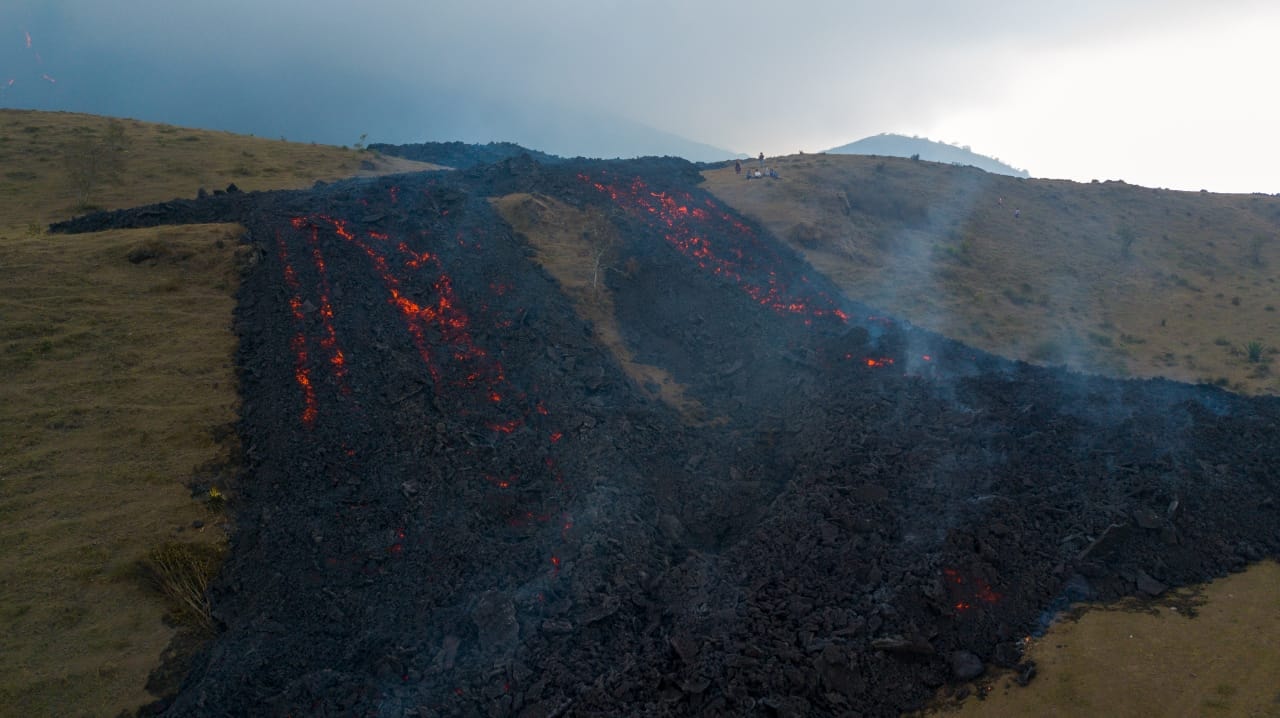
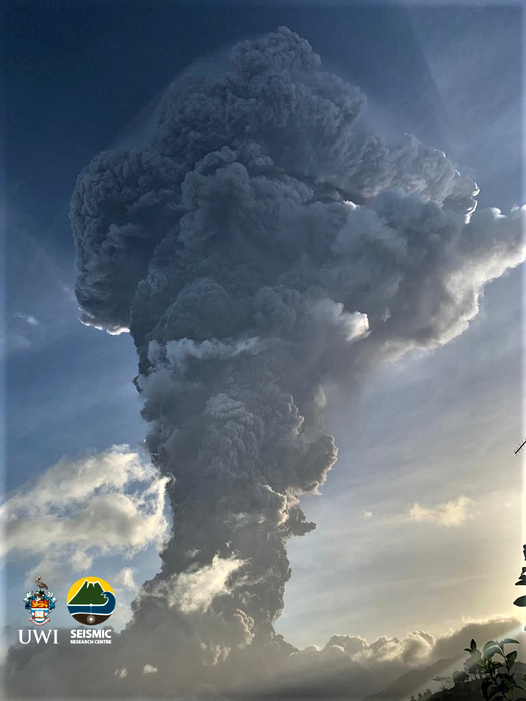
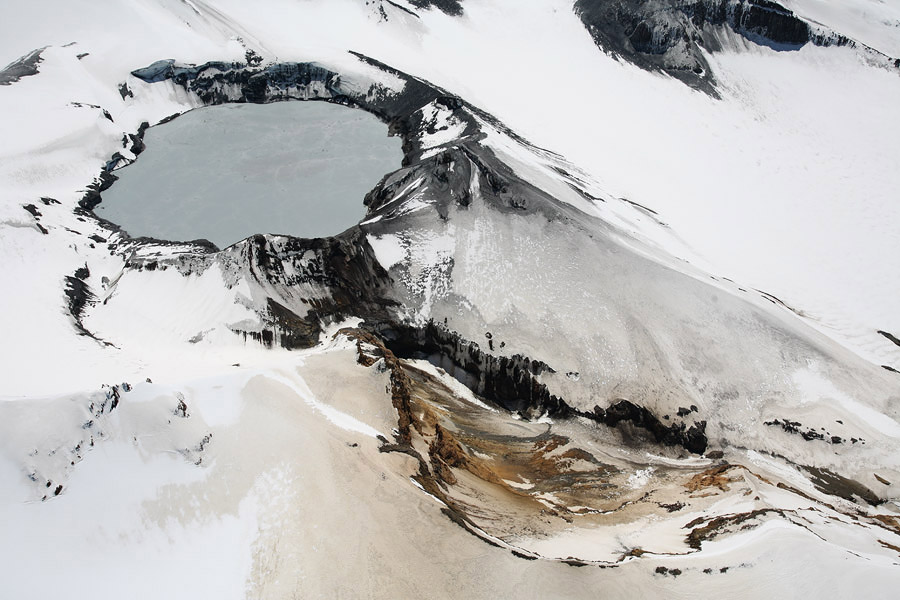
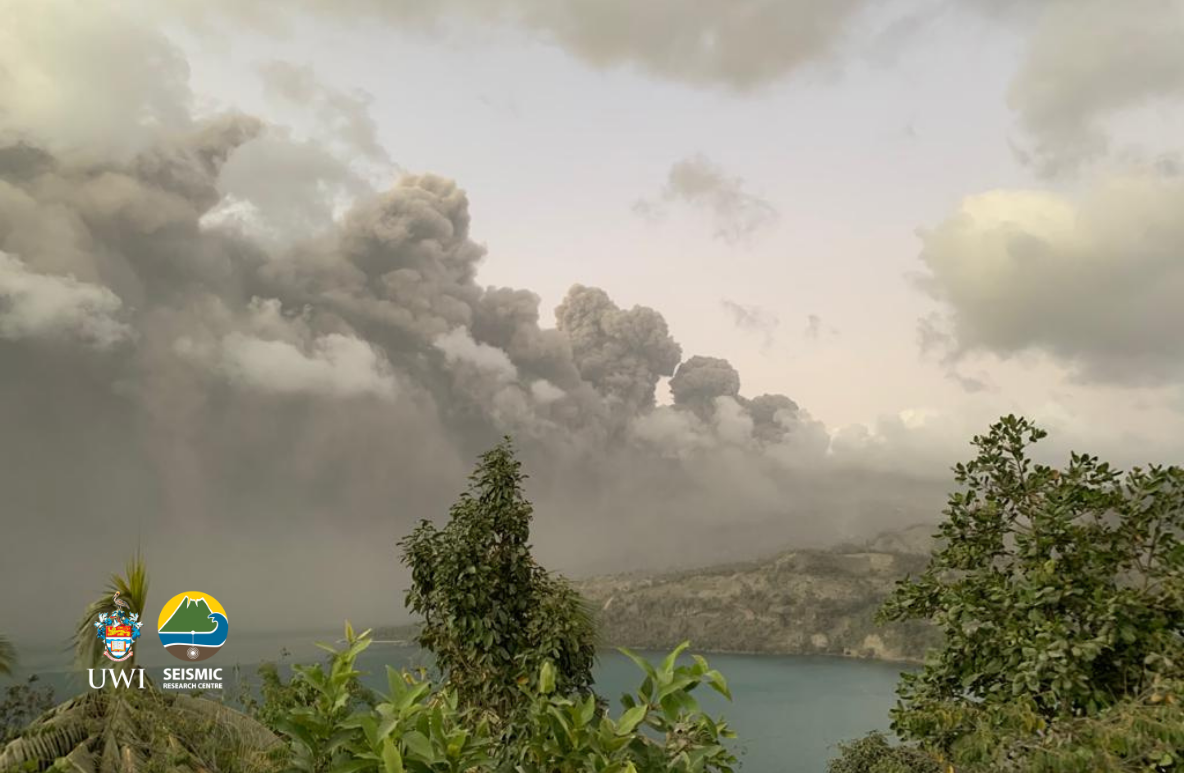
Saint Vincent , Soufrière Saint Vincent :
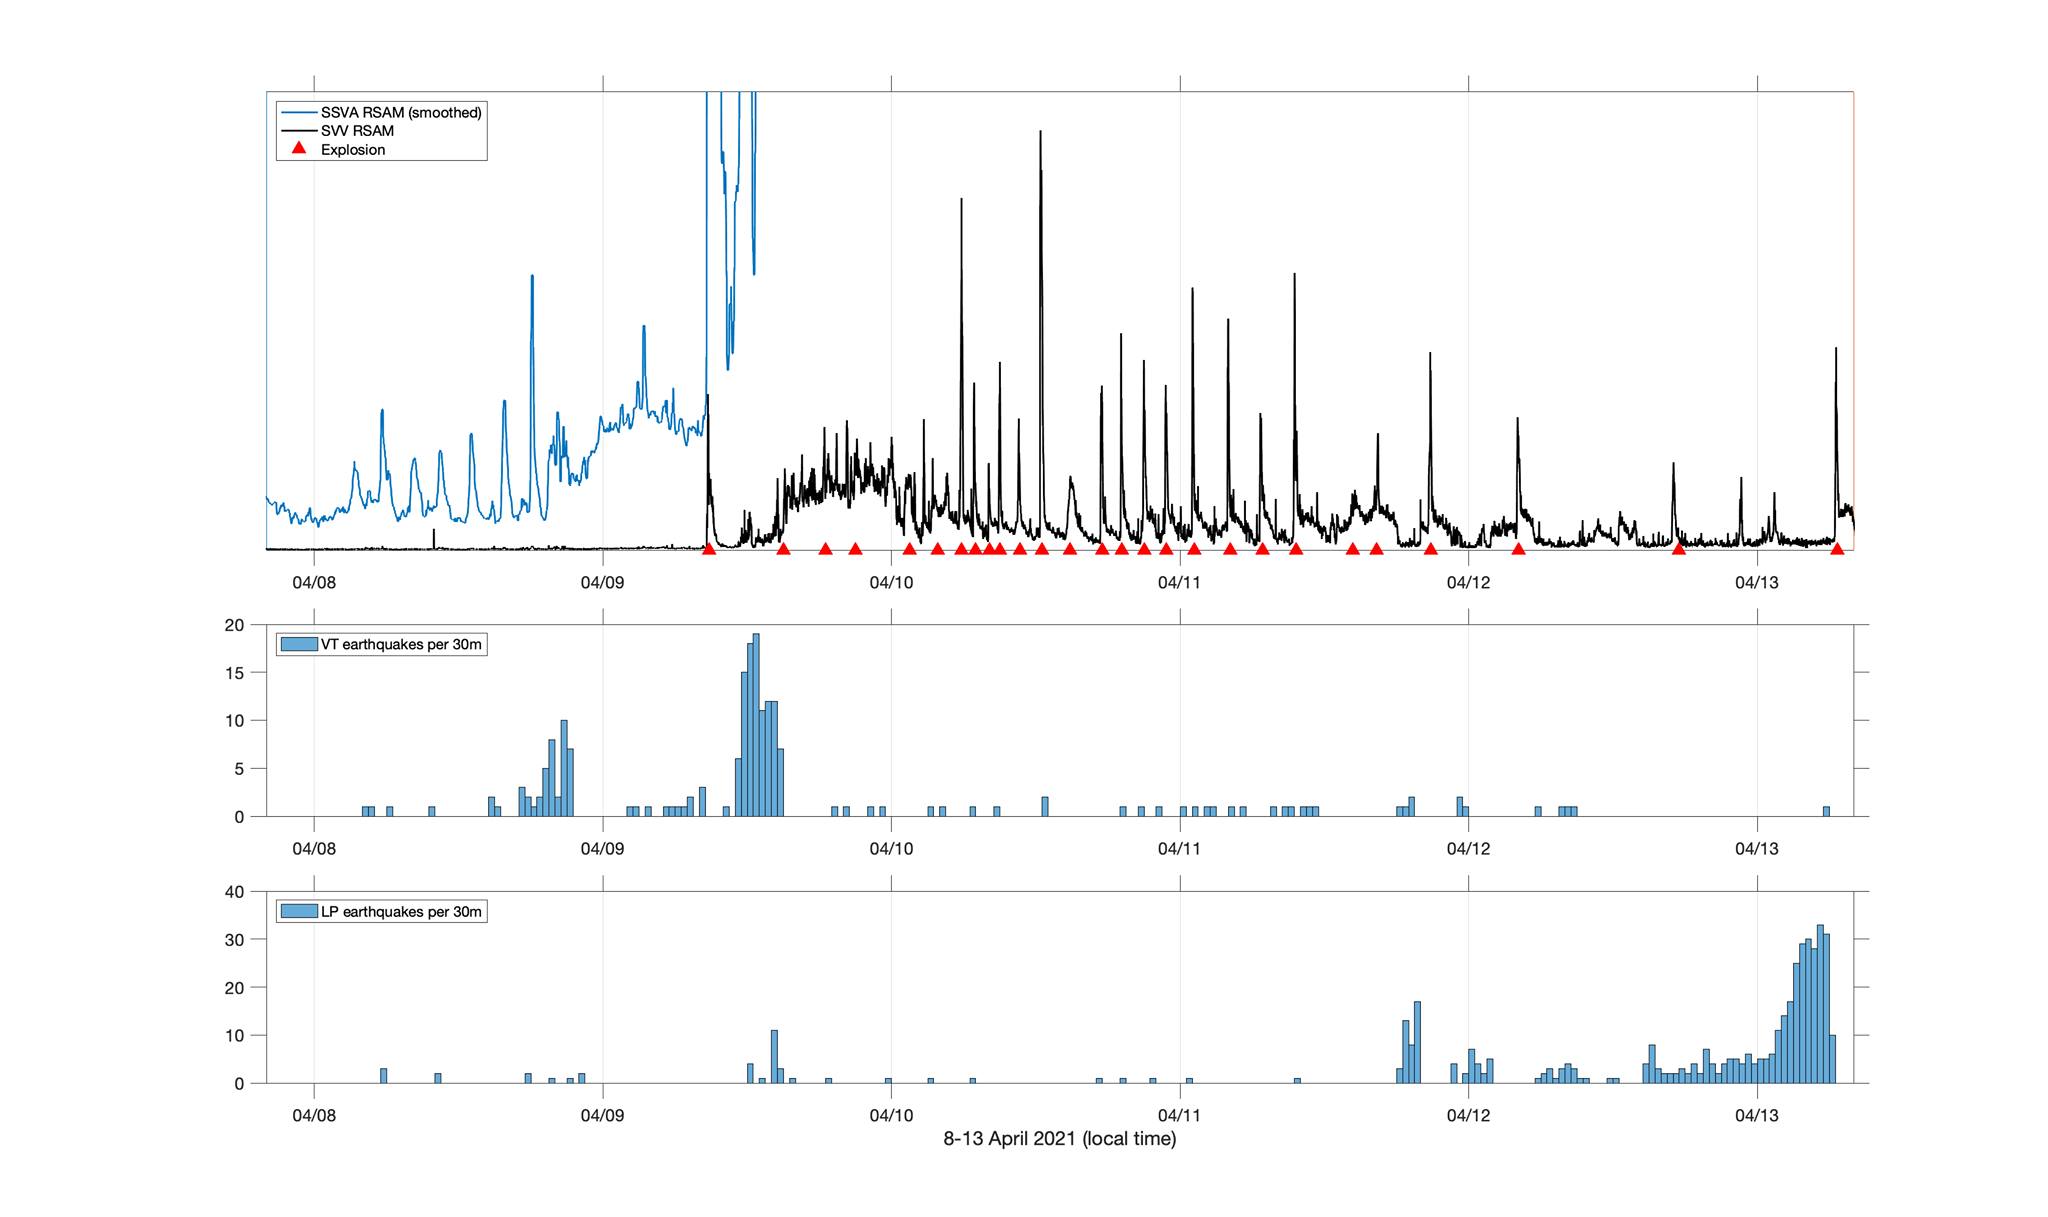
La Soufriere, St. Vincent SCIENTIFIC UPDATE 19.04.21 6:00AM
– The episode of continuous seismic tremor generated by explosive activity at La Soufrière, lasted until about 9 pm on 18 April.
– Following this, small long-period and hybrid earthquakes started to be recorded again, at a rate similar to before the explosive activity. This rate dropped significantly at about 1 am on 19 April.
– No volcano-tectonic earthquakes were recorded in the last 12 hours.
– One rockfall was recorded, at 1:39 am. Rockfalls can be generated by a growing lava dome, but this cannot be confirmed without visual observations.
– The continuous GPS network has shown a change in horizontal and vertical movement since the initial depressurization noted immediately following the April 9 explosive phase.
– The continuous GPS (Global Positioning System) network is used to track changes in ground shape on and around the volcano. As magma moves beneath the volcano, changes in pressure cause the volcano to change shape (inflate/deflate).
– These changes may suggest magma influx from deep within the sub-volcanic system, however more investigation is needed to confirm this interpretation.
– The volcano continues to erupt. Its pattern of seismic activity over the last few days is typical of the growth and destruction of lava domes.
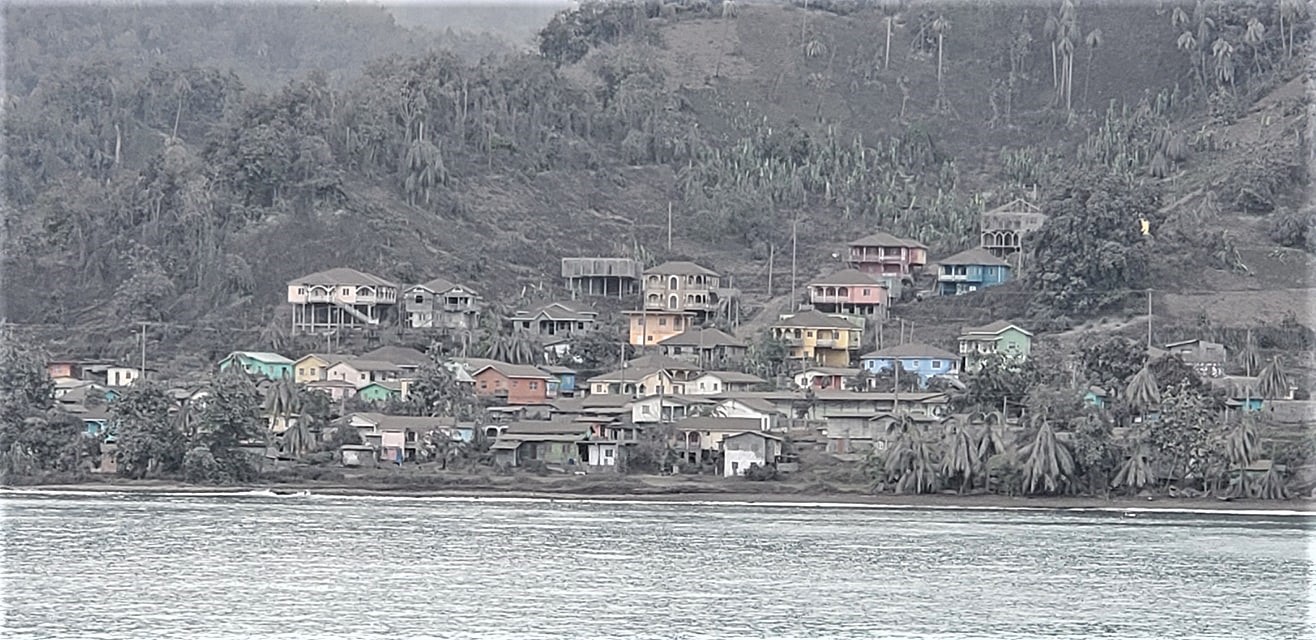
– Explosions with accompanying ashfall, of similar or larger magnitude, can occur with little or no warning impacting St. Vincent and neighbouring islands.
– The volcano is at alert level Red
Source : UWI.
Photo : Thomas Christopher, UWI-SRC/MVO
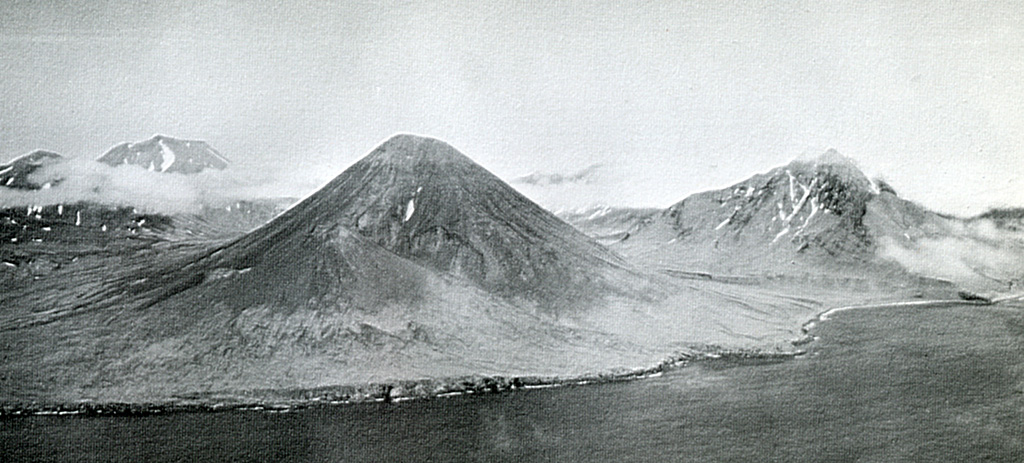
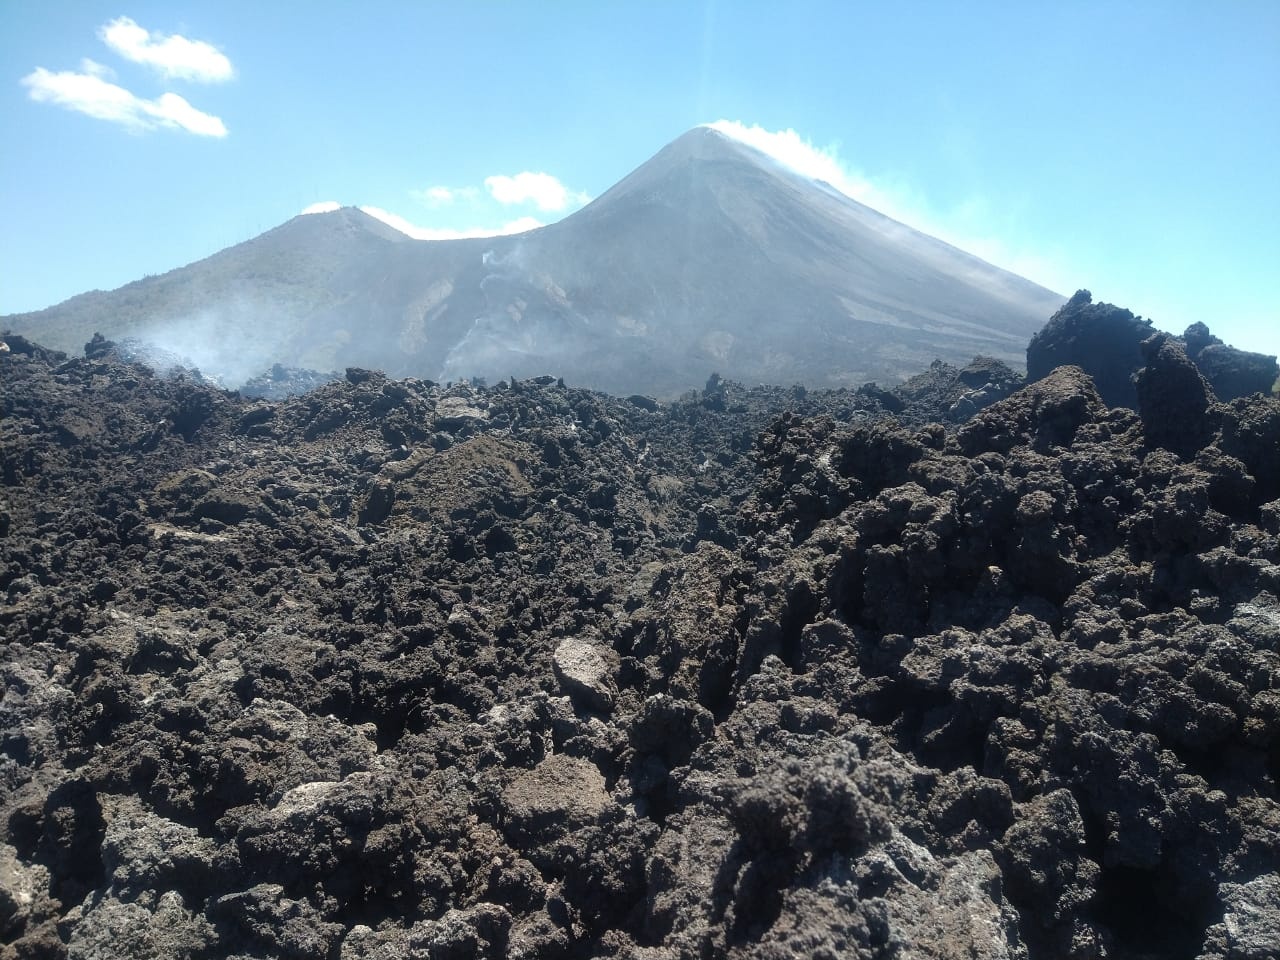
Peru , Sabancaya :
Analysis period: from April 12, 2021 to April 18, 2021, Arequipa, April 19, 2021.
Alert level: ORANGE
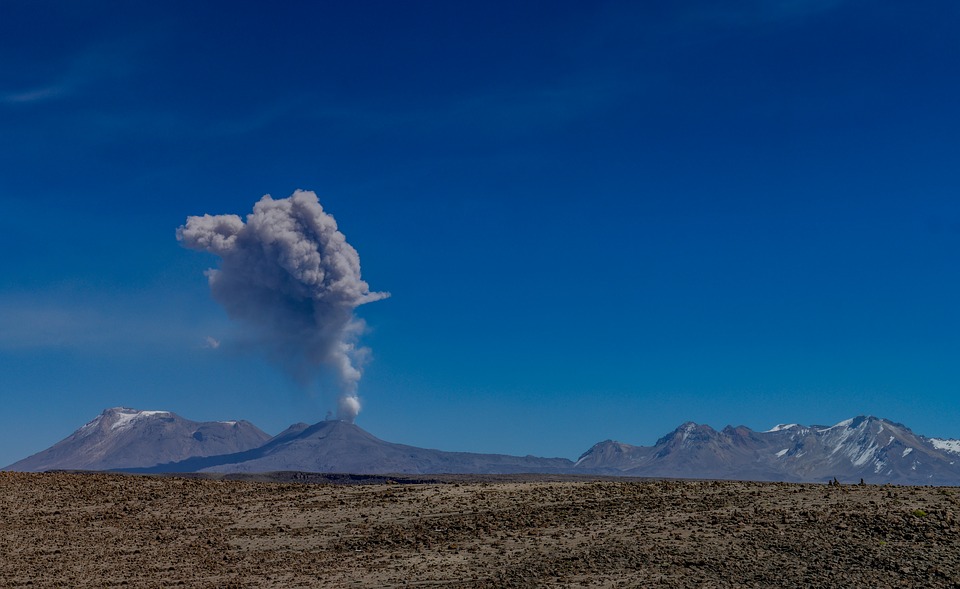
The Geophysical Institute of Peru (IGP) reports that the eruptive activity of the Sabancaya volcano remains at moderate levels, that is to say with the recording of an average of 91 daily explosions, with columns of ash and gas up to an altitude of 2.3 km above the summit of the volcano and their consequent dispersion. Therefore, for the following days, no significant change is expected in eruptive activity.
The IGP recorded and analyzed the occurrence of 1,732 earthquakes of volcanic origin, associated with the circulation of magmatic fluids inside the Sabancaya volcano. An average of 100 explosions was recorded daily. During this period, Volcano-Tectonic (VT) earthquakes associated with rock fractures were located mainly in the North-West, North-East, East and South-East of Sabancaya and have presented magnitudes between M1.6 and M3.9

The monitoring of the deformation of the volcanic structure using GNSS techniques (processed with fast orbits) does not present any significant anomalies. However, in general, an inflation process was observed in the northern sector (around the Hualca Hualca volcano). Visual surveillance made it possible to identify columns of gas and ash up to an altitude of 2.3 km above the summit of the volcano, which were scattered towards the South-West, South, North and North-West sectors of the volcano. Sabancaya. Satellite recordings have identified the presence of 8 thermal anomalies (maximum value of 28 MW) associated with the presence of a lava body on the surface of the volcano’s crater.
RECOMMENDATIONS
• Keep the volcanic alert level in orange.
• Do not approach within a radius of less than 12 km from the crater.
Source : IGP.
Photo : Andina.
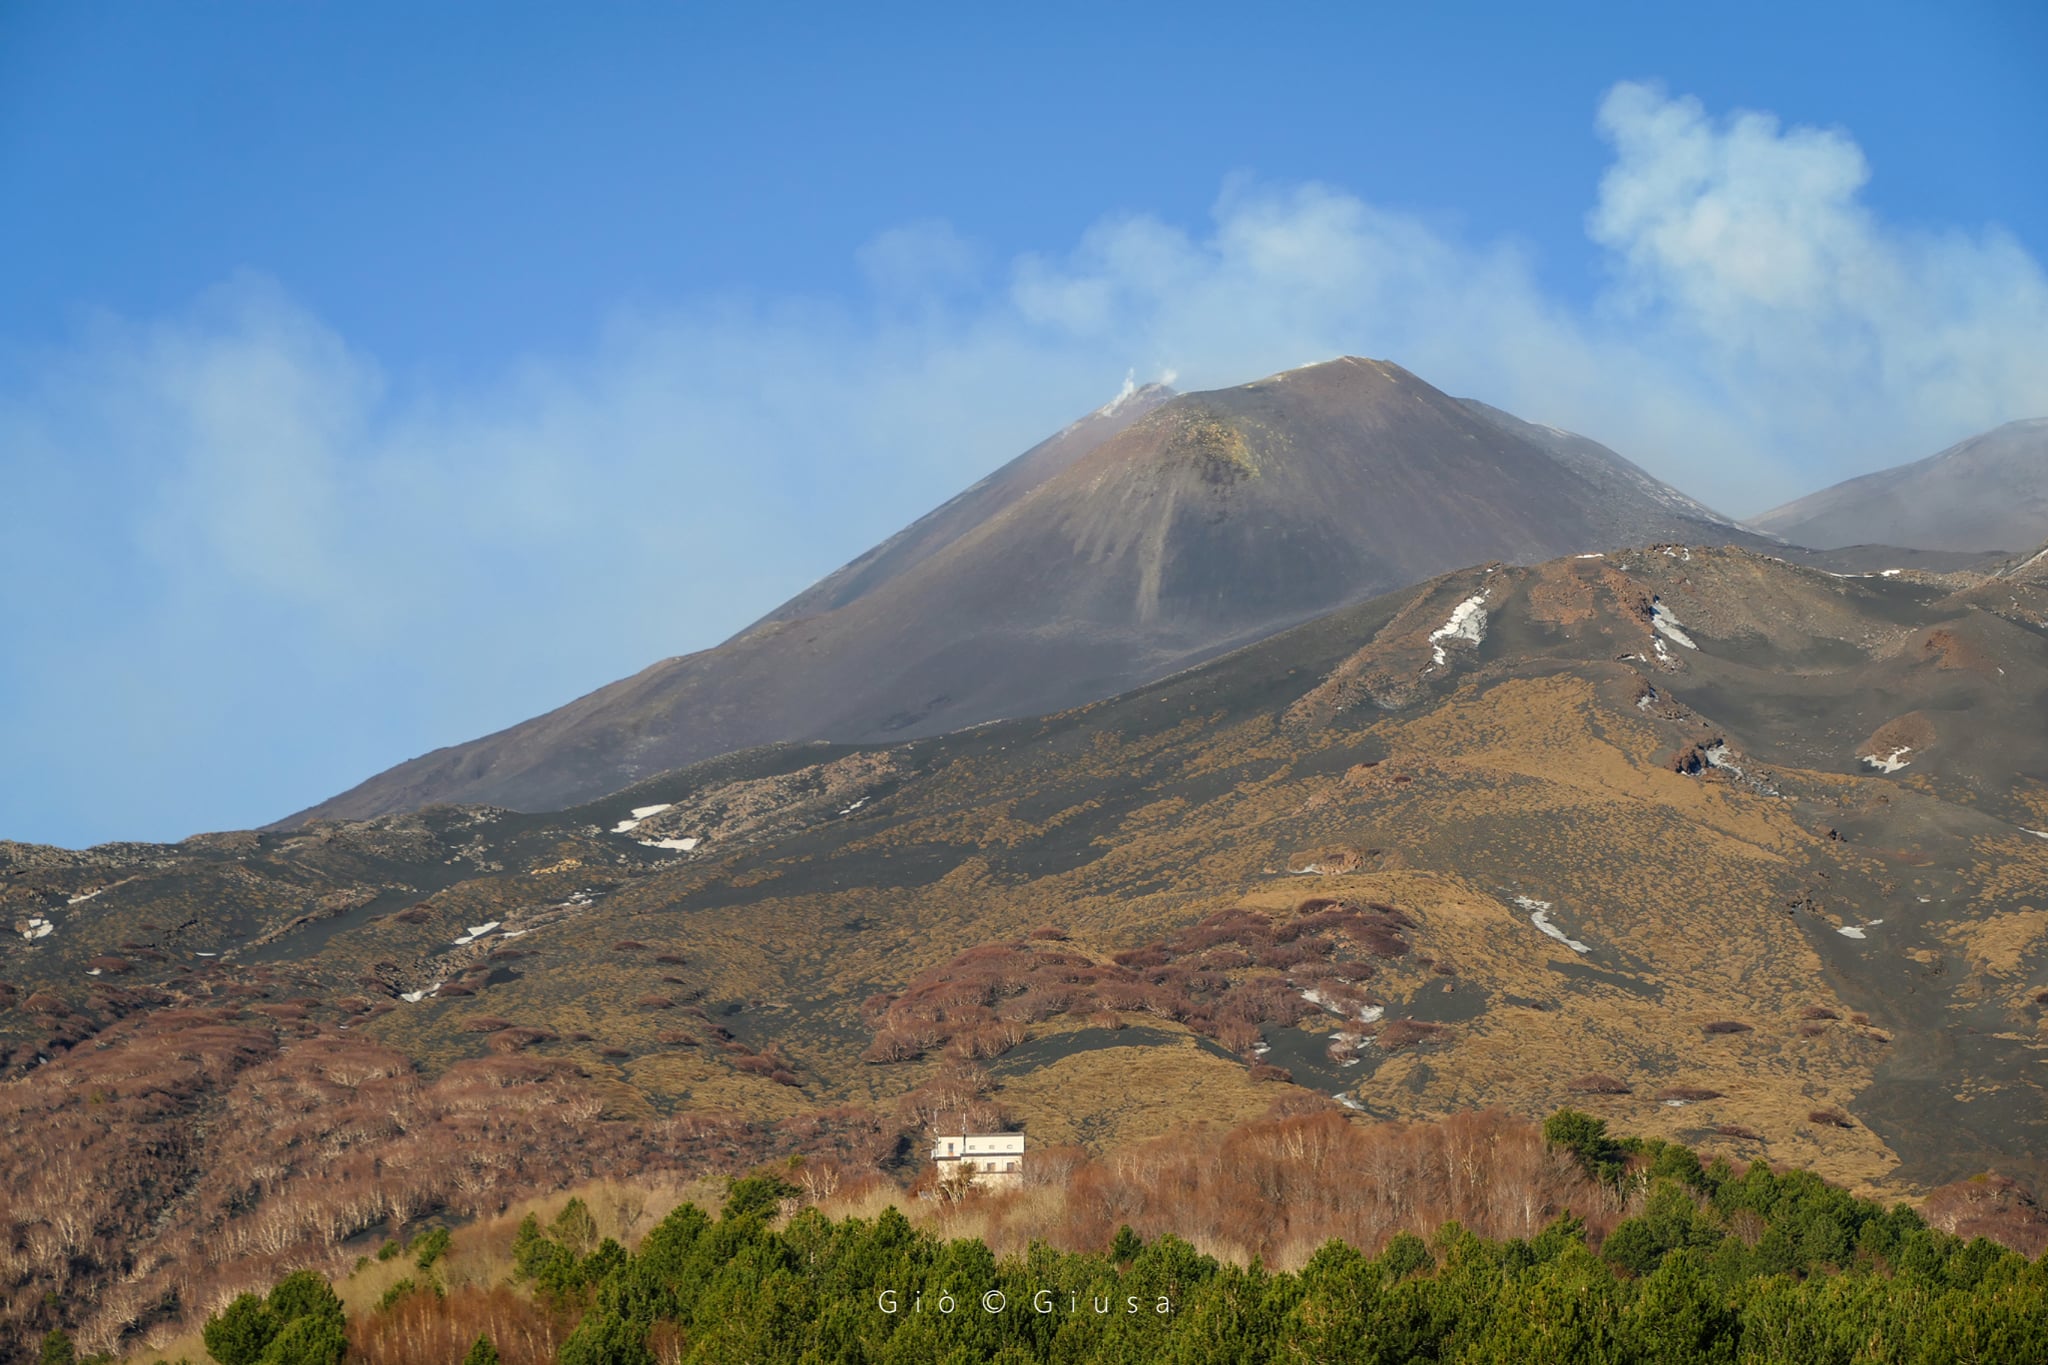
Ecuador , Sangay :
Information on SANGAY VOLCANO Nº 2021-078, Quito, Monday April 19, 2021.
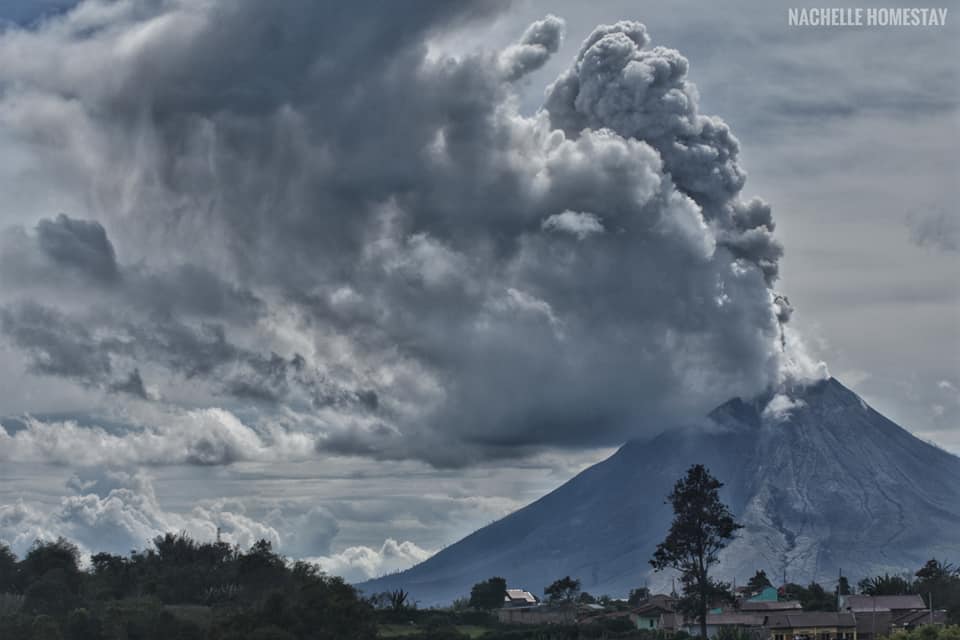
On April 19, thanks to photos taken from Riobamba, an ash emission from the Sangay volcano was observed. The emission is directed towards the West-North-West of the volcano and could cause a slight fall of ash on certain populations of the provinces of Chimborazo.
The SAGA seismic station recorded a high frequency signal at 2:24 p.m. (TL), possibly associated with the appearance of mudslides and debris (lahars) which descend into the ravines of the volcano. This phenomenon has been recurrent in the current eruptive period and comes from the fact that the rains on the volcano remobilize the volcanic material accumulated on the flanks. Proximity to rivers and their tributaries is not recommended.

DAILY REPORT ON THE STATE OF SANGAY VOLCANO.
Surface activity level: High, Surface trend: No change.
Internal activity level: High, Internal trend: No change.
Seismicity: From April 17, 2021, 11:00 a.m. to April 18, 2021, 11:00 a.m .:
Explosion (EXP) 8
Long period (LP) 22
Tremors of emission (TREMI) 5
Rains / lahars:
Moderate rains were recorded in the area of the volcano. Yesterday afternoon, a high frequency signal was recorded, probably associated with the appearance of mudslides and debris (lahars) that descend through the ravines of the volcano.
Emission / ash column: Yesterday afternoon, an ash emission was observed which reached 2000 meters above the summit, in a West-North-West direction. The Washington VAAC reported several ash emissions between 1170 and 1770 meters above the summit, mainly to the west. There is a report of moderate ash fall in Chimborazo province in Guamote township.
Other monitoring parameters: FIRMS recorded 6 thermal alerts, MIROVA reported 1 low thermal alert and 1 moderate thermal alert in the last 24 hours.
Observations: The cloudiness was permanent in the area, preventing direct observation of surface activity.
Alert level: yellow.
Sources : INSTITUT GÉOPHYSIQUE / ÉCOLE NATIONALE DE POLYTECHNIQUE.