April 19 , 2021.
Saint Vincent , Soufrière Saint Vincent :
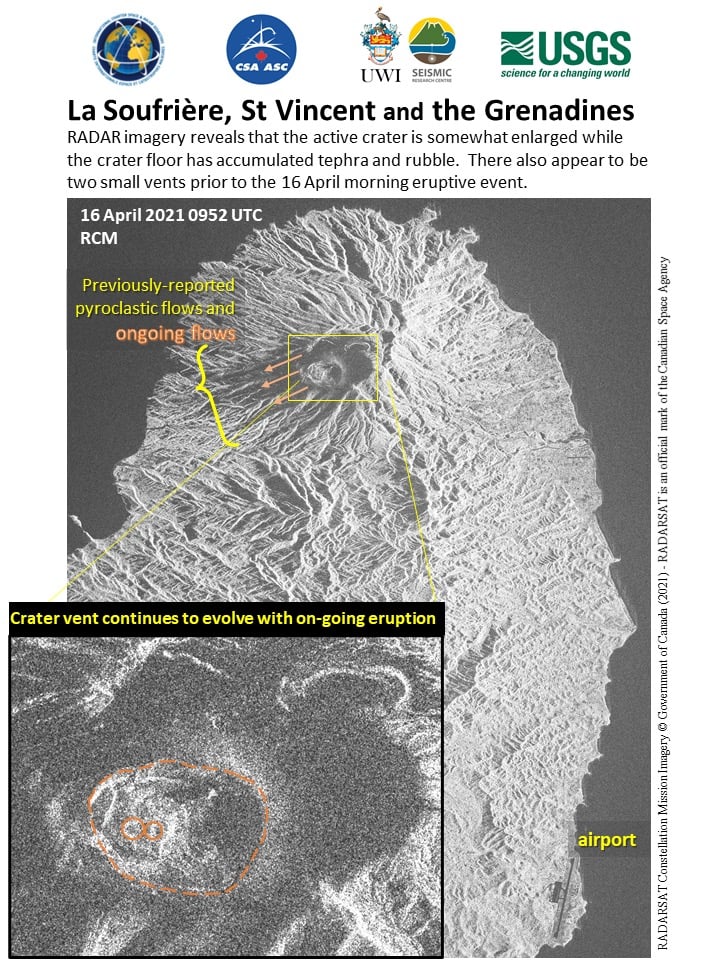
La Soufrière, St. Vincent SCIENTIFIC UPDATE – April 17, 2021 6:00PM
– The swarm of long-period and hybrid earthquakes continued at La Soufrière.
– The rate of occurrence of these earthquakes has remained near-constant since the last update. No episodes of tremor have been recorded in the last 12 hours.
– The continuous GPS (Global Positioning System) network has shown a change in horizontal and vertical movement since the initial deflation observed after the April 9 explosive episode.
– The continuous GPS (Global Positioning System) network is used to track changes in ground shape on and around the volcano.
– These changes may suggest magma is being added from deep within the sub-volcanic system, however more investigation is needed to confirm this interpretation.
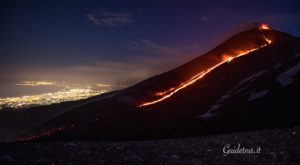
– The volcano continues to erupt although explosive activity appears to have ended at this time.
– Its current pattern of seismic activity may indicate growth of a lava dome, but this has not yet been confirmed.
– Explosions with accompanying ashfall, of similar or larger magnitude, could restart in the future impacting St. Vincent and neighbouring islands.
– The volcano is at alert level Red.
La Soufriere, St. Vincent SCIENTIFIC UPDATE – April 18 , 2021 , 6:00pm
– The swarm of long-period and hybrid earthquakes continued at La Soufrière with no significant change in their rate of occurrence.
– Occasional small volcano-tectonic earthquakes were still being recorded.
– An explosion generated a period of high-level tremor starting at 4:49 pm on 18 April.
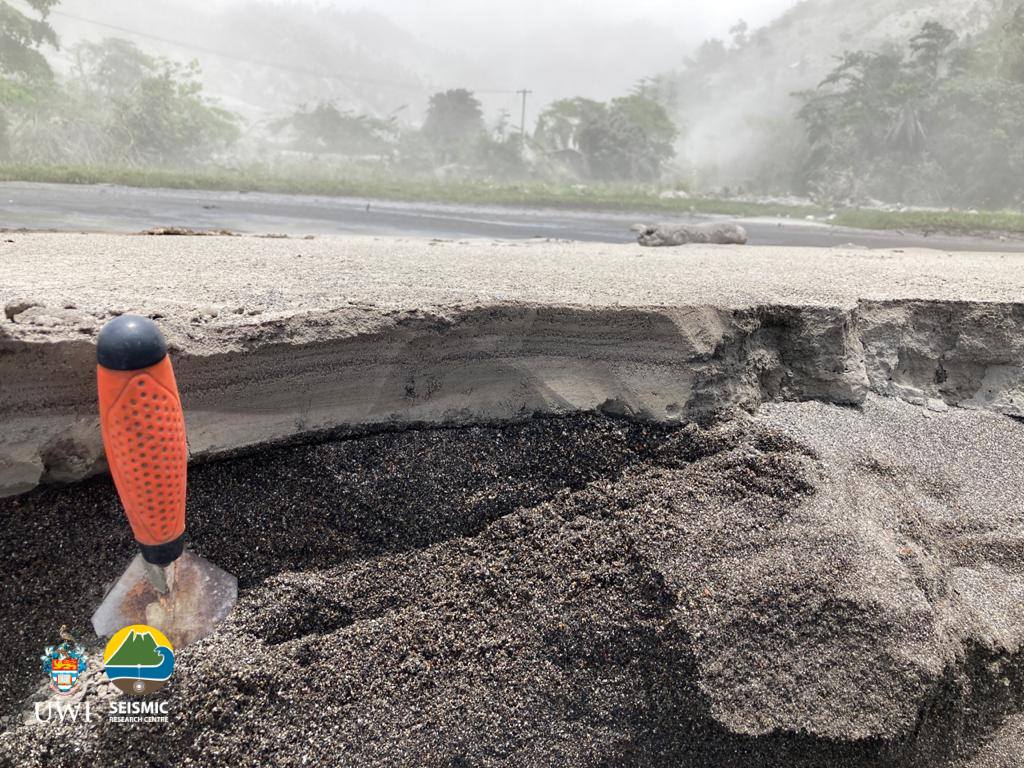
18Apr. Fieldwork in the Leeward side of the red zone. Surge deposit at Richmond from the wet Wallibou River. The PDCs were located ~300m away from where this flow ended. Photo credit: Richard Robertson, UWI-SRC.
– The resulting eruption plume rose to above 8km and drifted to the south and southwest of the island.
– Measurements of sulphur dioxide flux (mass) at La Soufriere volcano were again undertaken along the west coast yesterday and today.
– An average SO2 flux of 232 and 391 tons per day on 17th and 18th April respectively, was recorded.
– The volcano continues to erupt. Its pattern of seismic activity over the last few days is typical of the growth and destruction of lava domes.
– Explosions with accompanying ashfall, of similar or larger size, can occur with little or no warning impacting St Vincent and neighbouring islands.
– The volcano is at alert level Red
Source et photos : UWI.
Video : Saint Vincent & les Grenadines.
Hawaii , Kilauea :
19°25’16 » N 155°17’13 » W,
Summit Elevation 4091 ft (1247 m)
Current Volcano Alert Level: WATCH
Current Aviation Color Code: ORANGE
Activity Summary:
Kīlauea Volcano is erupting. Lava activity is confined to Halemaʻumaʻu with lava erupting from a vent on the northwest side of the crater. This morning, April 17, the lava lake was 226 m (741 ft) deep and remains stagnant over its eastern half. SO2 emission rates remain elevated at 950 t/day, last measured on April 14.
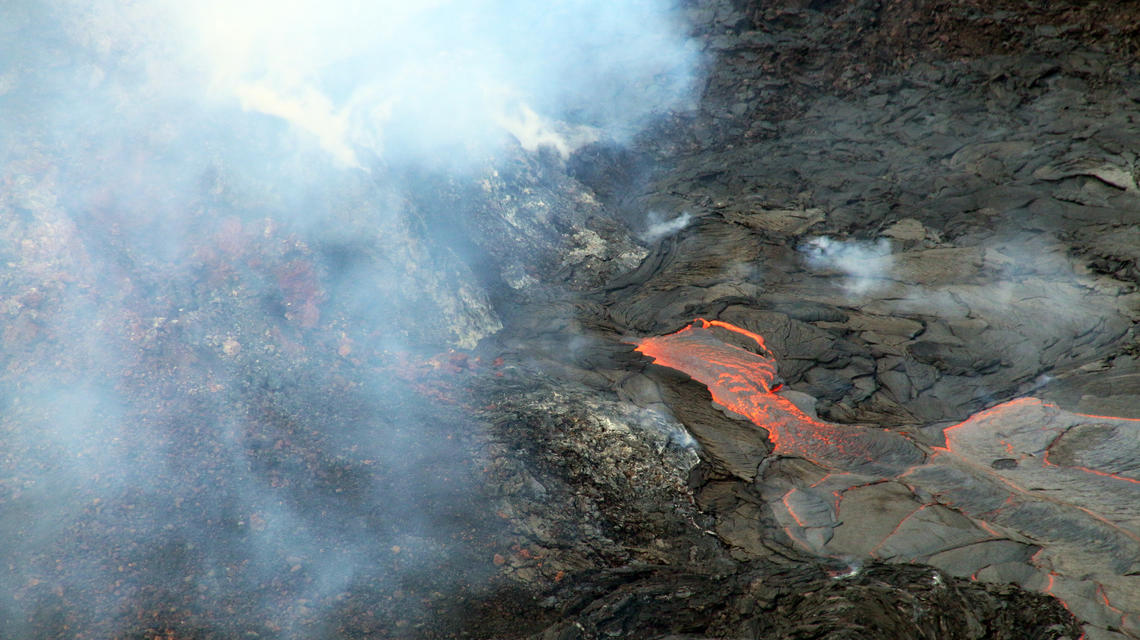
On Friday, lava erupting from the west vent in Halema‘uma‘u crater emerged from a source closer to the vents base (center), a few feet away from the submerged effusive inlet that has been feeding the lava lake for several weeks (lower right).
Summit Observations:
The most recent sulfur dioxide emission rate, measured on April 14, was 950 t/day. This is elevated compared to rates in the months before the eruption started on December 20 (less than 100 t/day), but lower than emission rates from the pre-2018 lava lake (around 5,000 t/day). Summit tiltmeters recorded minor change over the past 24 hours. Seismicity remains stable, with elevated tremor.
East Rift Zone Observations:
No unusual activity noted in the region. Geodetic monitors indicate that the summit and upper East Rift Zone—between the summit and Puʻuʻōʻō—is refilling at rates similar to those measured over the past 2 years and before the December 2020 eruption. SO2 and H2S emissions from Puʻuʻōʻō were below instrumental detection levels when last measured on January 7.
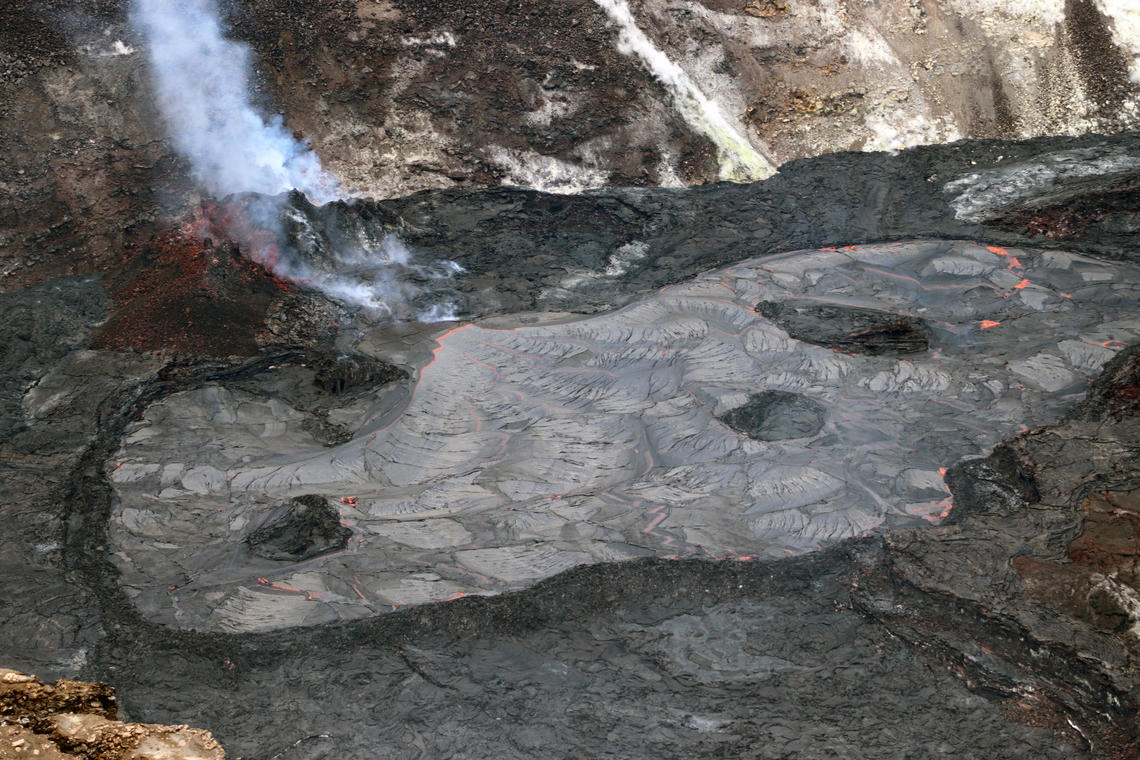
This view of the southern edge of Halema’uma’u shows the perched lava lake, fed by lava from the West Fissure (upper right part of the photo). The dike surrounding the active lava lake is approximately 5 m (16 ft) high.
Halemaʻumaʻu lava lake Observations:
Lava effusion from the west vent continues to supply the lava lake within Halema‘uma‘u crater. The west vent is consistently effusing lava at a low rate through a crusted-over channel and submerged inlet to the lake. Lava circulation and intermittent foundering of crust continue in the western portion of the lava lake, with lava oozing out sporadically in areas along the perimeter of the lake. The total depth of the lake is 226 m (741 ft) this morning as measured by a continuous laser rangefinder on the active western portion of the lake. Stagnant and solidified lava crust covers the eastern portion of the lava lake and is slowly growing westward.
Source : HVO
Photos : USGS / K. Lynn , USGS / M. Patrick .
La Réunion , Piton de la Fournaise :
Press release of 04/18/2021 – 2:00 p.m.
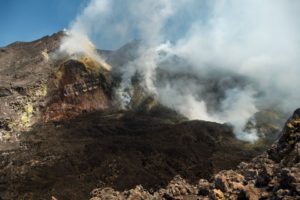
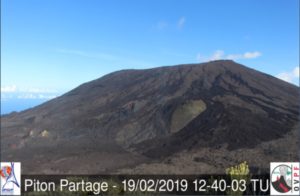
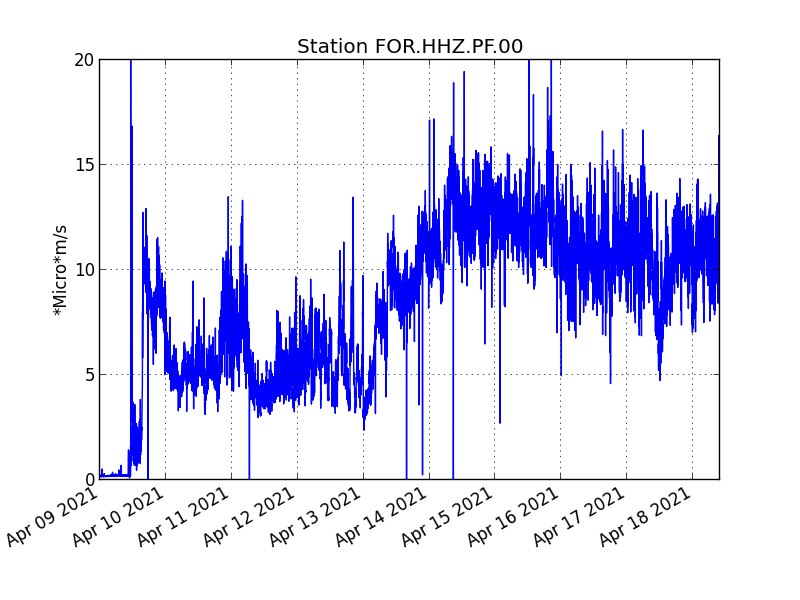
The eruption that started on 04/09/2021 at 7 p.m. (appearance of the tremor) continues. The intensity of the volcanic tremor (indicator of a surface lava emission) over the past 24 hours has remained relatively stable.
– Observations of the eruptive site always show:
. that lava fountain activity continues, mainly on the main cone located most upstream.
. and that the flow activity is focused on the plateau downstream of the eruptive site, with the establishment of a lava tunnel regime showing numerous resurgences.
– Over the last 24 hours, 22 superficial volcano-tectonic earthquakes (between sea level and the surface) have been recorded under the summit craters.
– The deflation of the building seems to have stopped and a slight inflation of the top seems to be emerging.
This parameter will be monitored over the next few days because it may correspond to the arrival of deep magma, highlighted by the flows of CO2 in the soil for several days, in the superficial magmatic reservoir which feeds the current eruption. It should be noted that during the eruptions of January and July 2017 and of April and September 2018 of long duration (> 3 weeks) such a refeeding during the eruption had been observed allowing feeding of the eruptive site over time, and that arrivals of deep magma have often been associated with changes in eruptive activity (explosiveness in 2016 and 2020; increased flow rates; opening of new cracks, etc.).

– The average lava flow rates estimated from the SO2 flows measured by the DOAS « NOVAC » network for the day of 04/17 have not changed compared to the previous day and are of the order of 8.3 m3 / sec or about 3 times less than the flow observed during the peak of the day of 04/13. It should be noted that bad weather conditions can affect the accuracy of the measurements.
– For comparison, the surface flow rates estimated from satellite data via the HOTVOLC platform (OPGC – Clermont Auvergne University) recorded values between 0 and 38
m3 / sec over the last 24 hours. It should be noted that bad weather conditions affect the accuracy of the measurements.
Alert level: Alert 2-2
Source : direction de l’OVPF-IPGP, le 18 avril 2021.
Read the article : https://www.ipgp.fr/sites/default/files/ovpf_20210418_14h00_communique_eruption.pdf
Photos : OVPF , Tunnels de lave Réunion : Rando-Volcan .
Indonesia , Sinabung :
VOLCANO OBSERVATORY NOTICE FOR AVIATION – VONA.
Issued : April 19 , 2021
Volcano : Sinabung (261080)
Current Aviation Colour Code : ORANGE
Previous Aviation Colour Code : orange
Source : Sinabung Volcano Observatory
Notice Number : 2021SIN52
Volcano Location : N 03 deg 10 min 12 sec E 98 deg 23 min 31 sec
Area : North Sumatra, Indonesia
Summit Elevation : 7872 FT (2460 M)
Volcanic Activity Summary :
Eruption with volcanic ash cloud at 03h47 UTC (10h47 local)
Volcanic Cloud Height :
Best estimate of ash-cloud top is around 11072 FT (3460 M) above sea level, may be higher than what can be observed clearly. Source of height data: ground observer.
Other Volcanic Cloud Information :
Ash-cloud moving to southeast.
Remarks :
Seismic activity is characterized by eruption
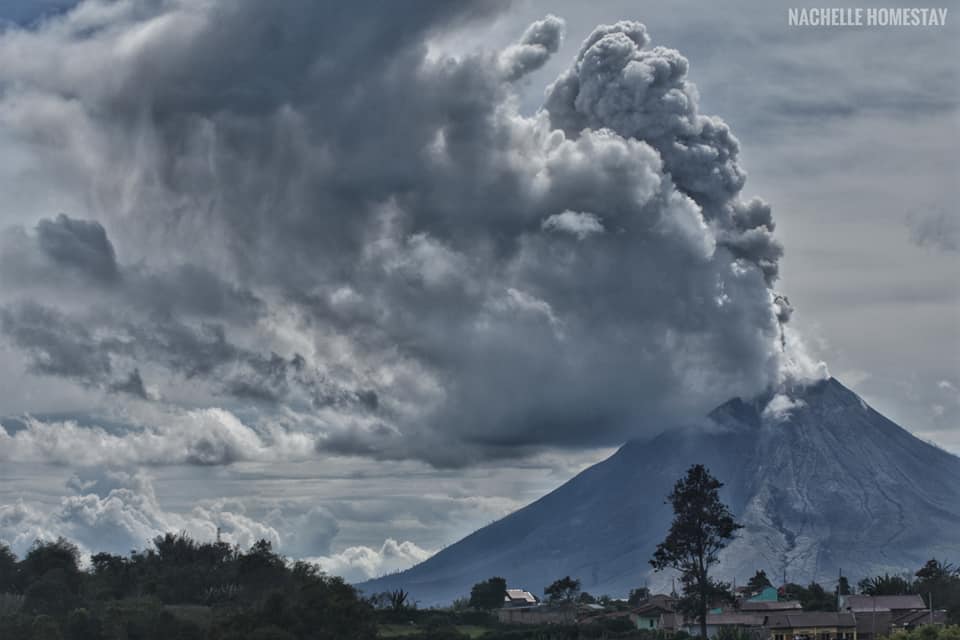
The activity level has been at level III (SIAGA) since May 20, 2019 at 10:00 a.m. WIB. Mount Api Sinabung (2460m above sea level) has been erupting since 2013. The last eruption occurred on April 13, 2021 with a maximum column height of 500-1600 meters above the summit.
The volcano was clear until it was covered in fog. The smoke from the crater was observed to be white with a strong thickness, rising about 50 to 300 meters above the summit. The weather is sunny to cloudy. Light to moderate winds to the Southeast, South, Southwest and West.
According to the seismographs of April 18, 2021, it was recorded:
8 eruption earthquakes
137 avalanche earthquakes
4 emission earthquakes
13 low frequency earthquakes
53 hybrid / multi-phase earthquakes
2 deep volcanic earthquakes
1 local tectonic earthquake
6 distant tectonic earthquakes
Source : Magma Indonésie , PVMBG.
Photo : Nachelle Homestay .