January 25 , 2020.
Philippines , Taal :
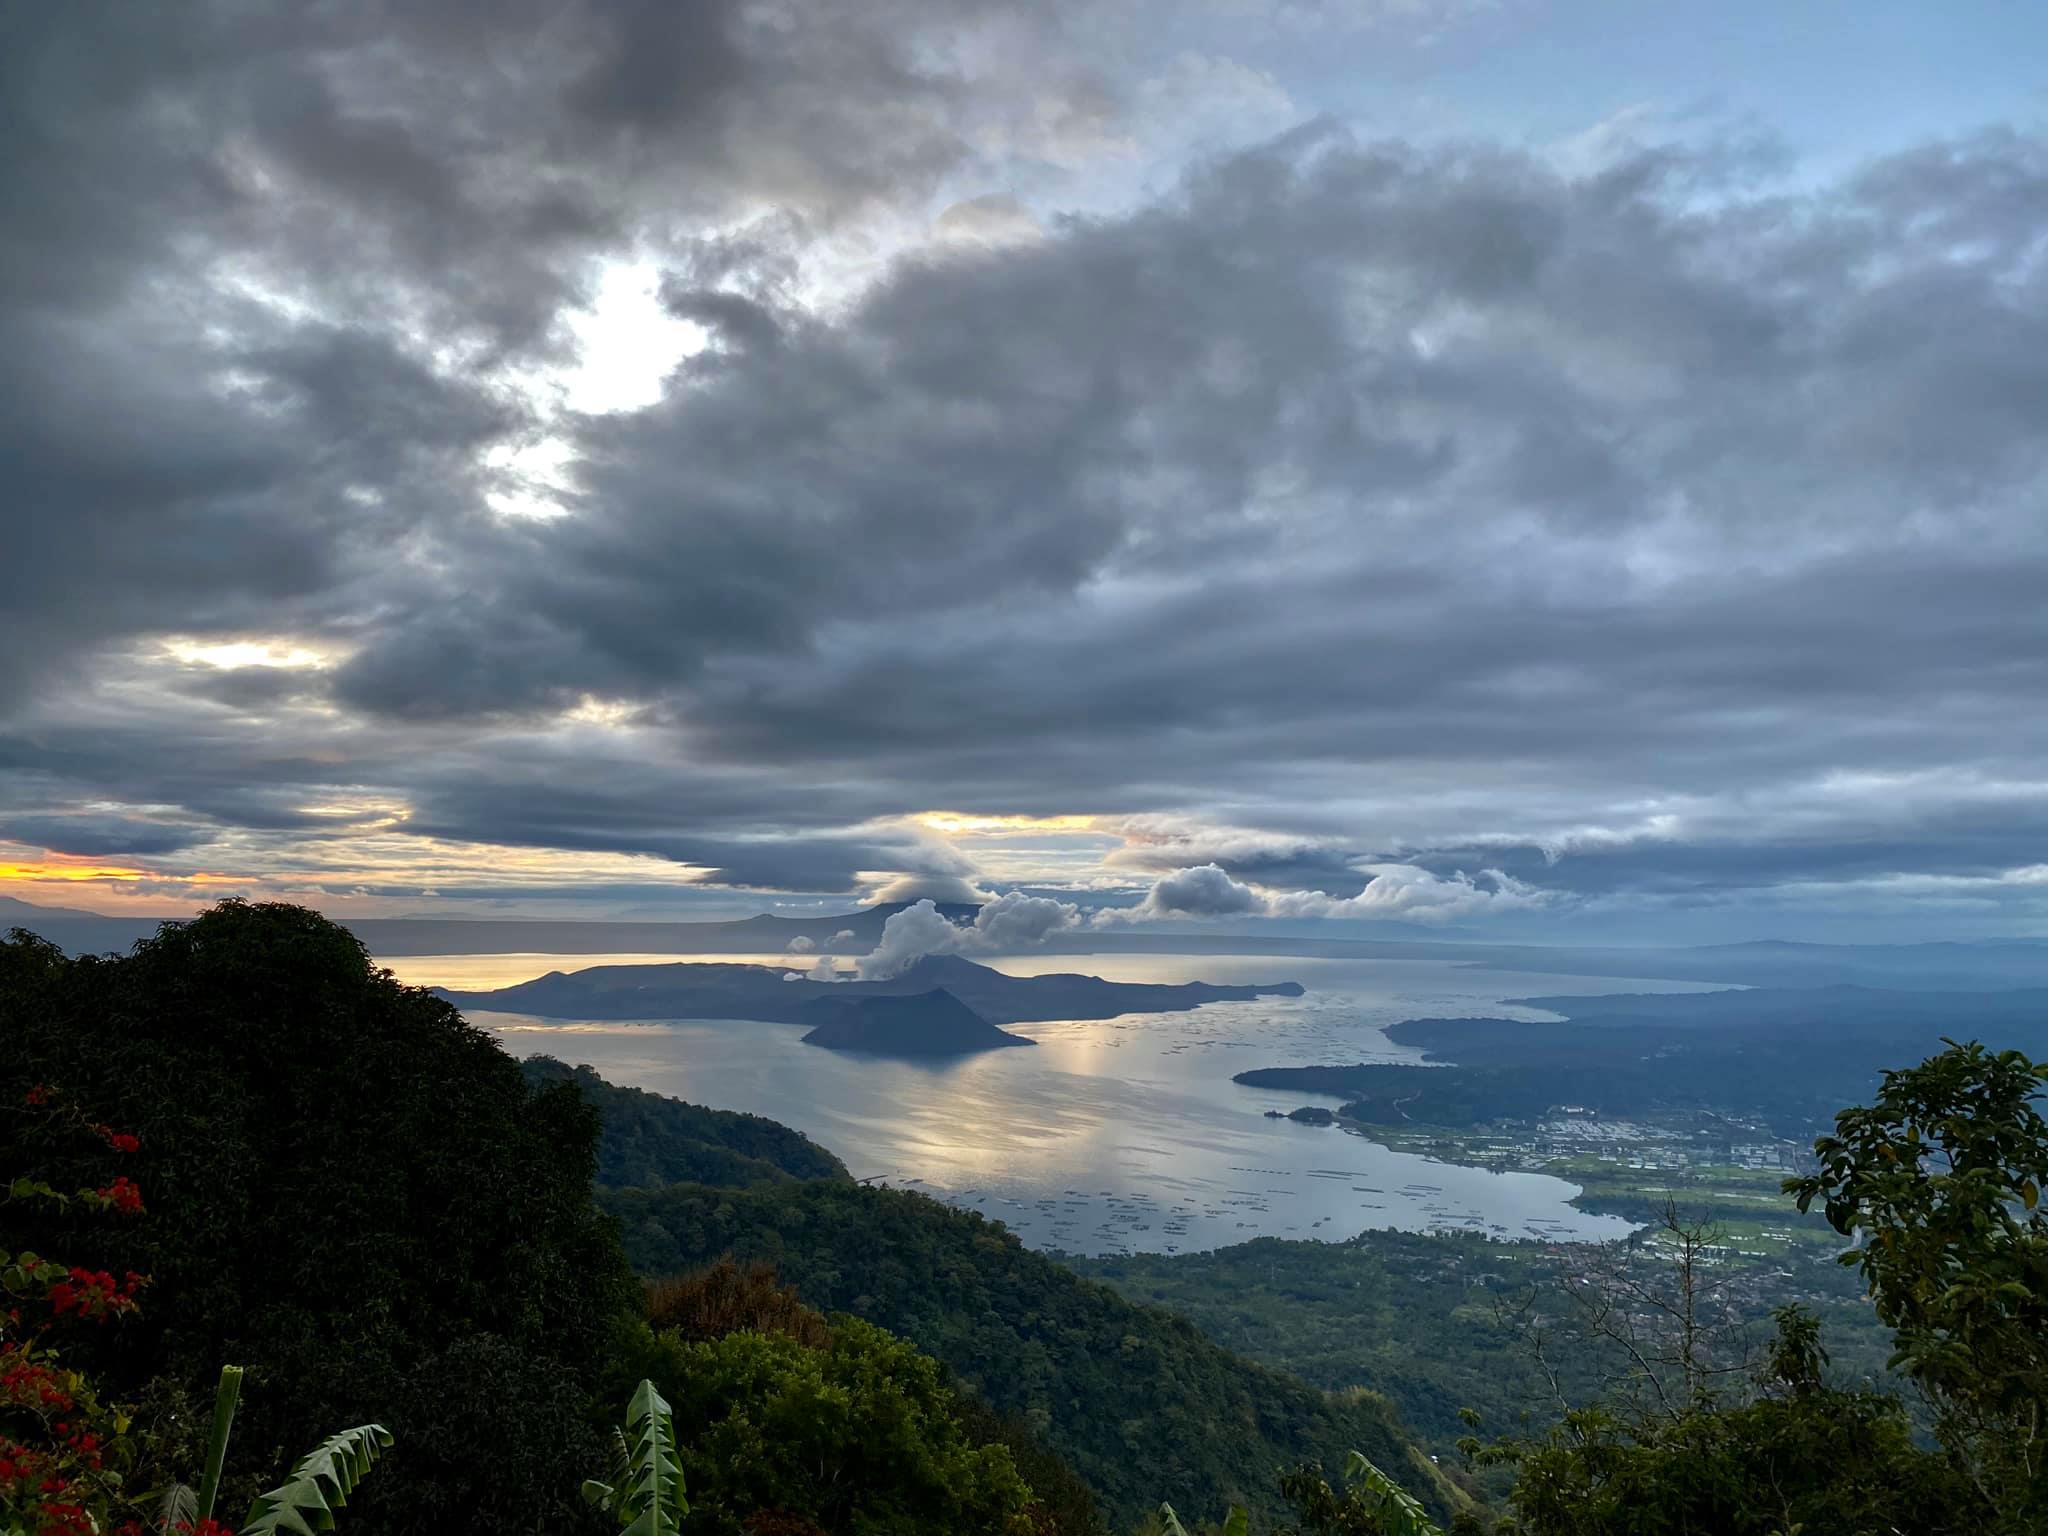
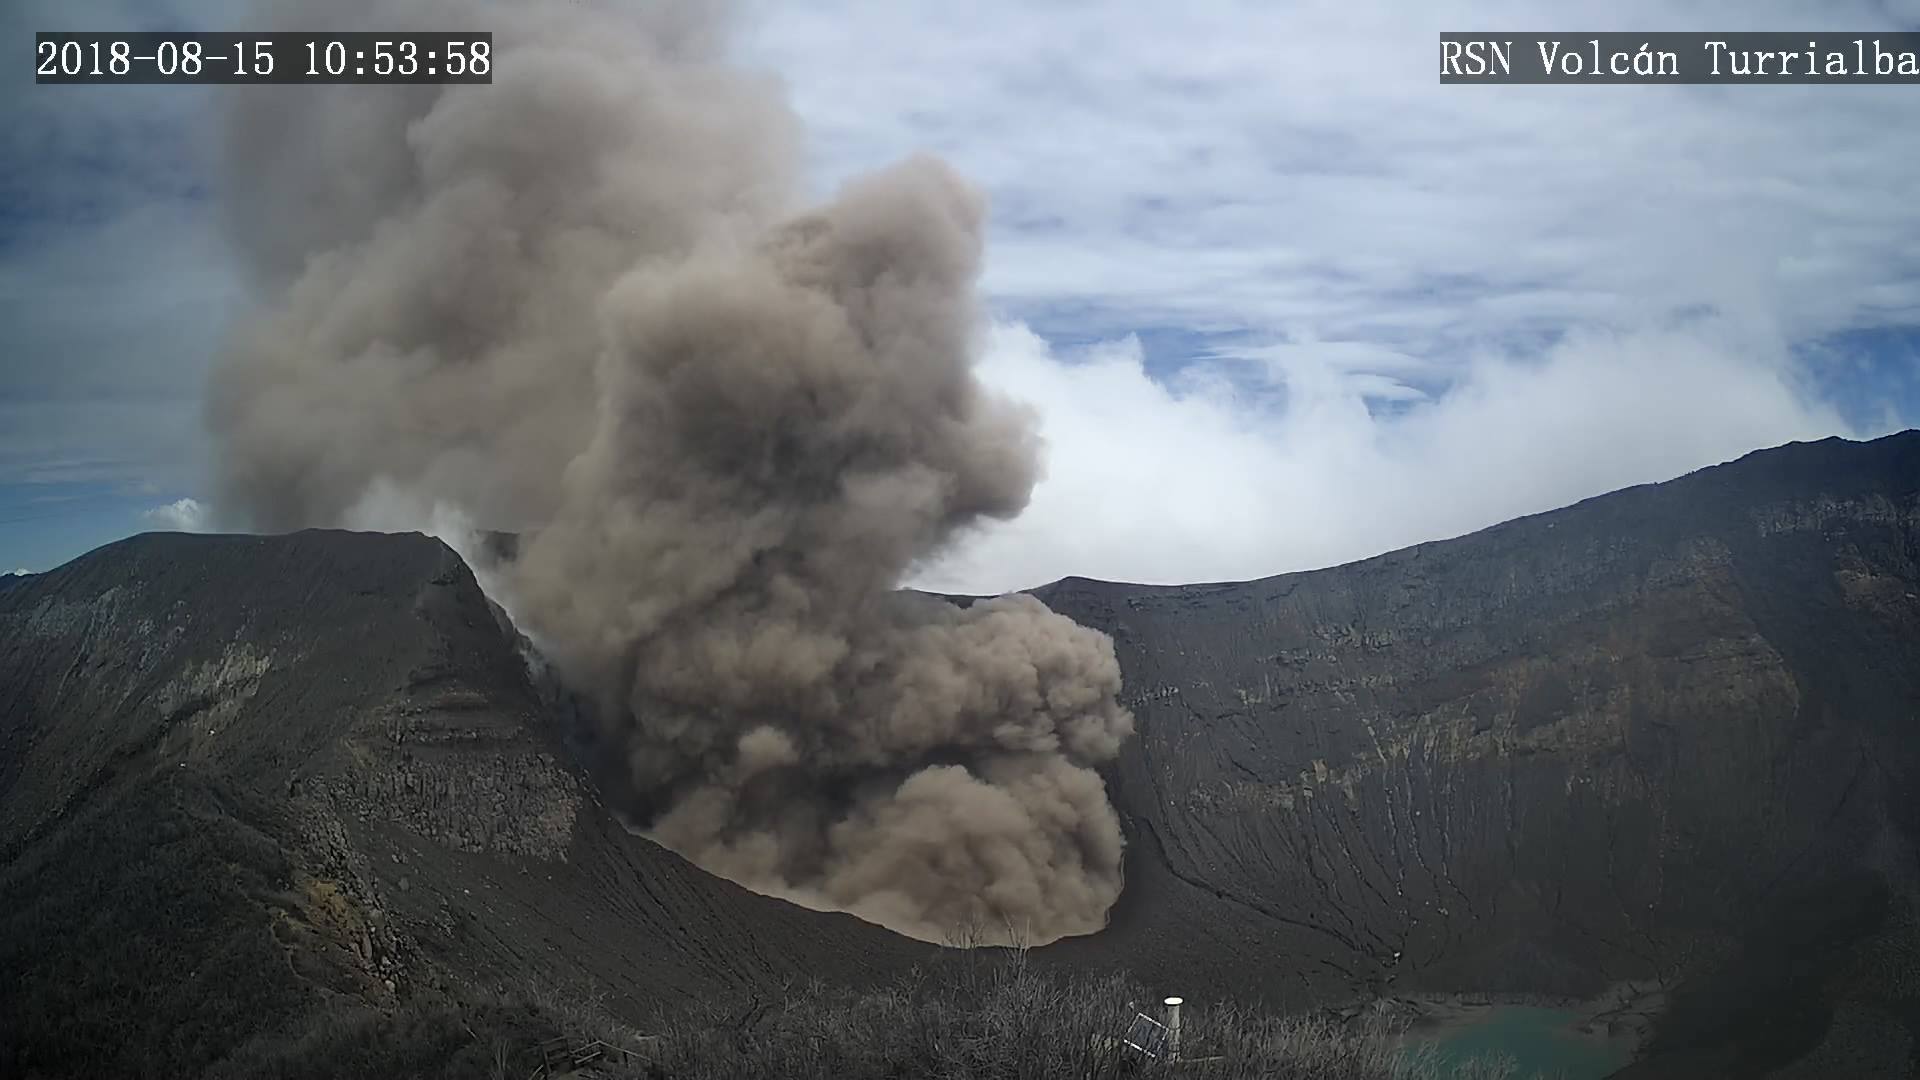
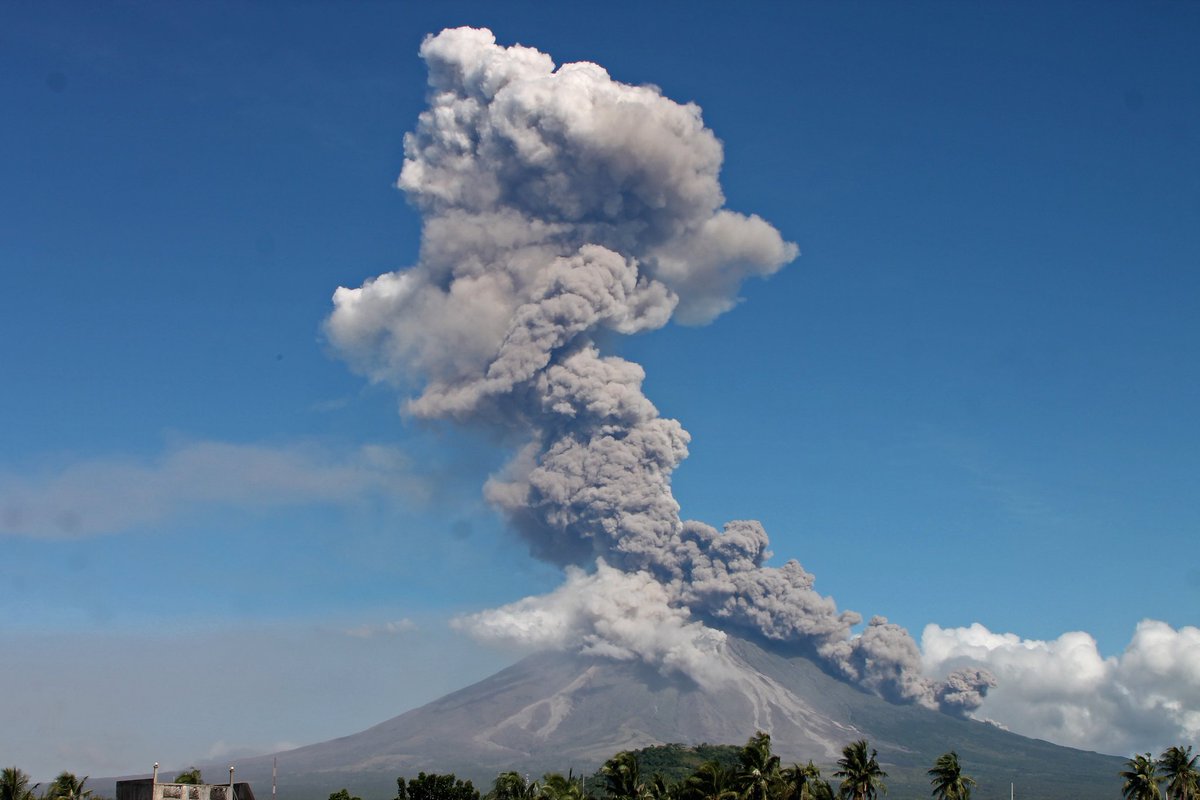
TAAL VOLCANO BULLETIN 25 January 2020 8:00 A.M.
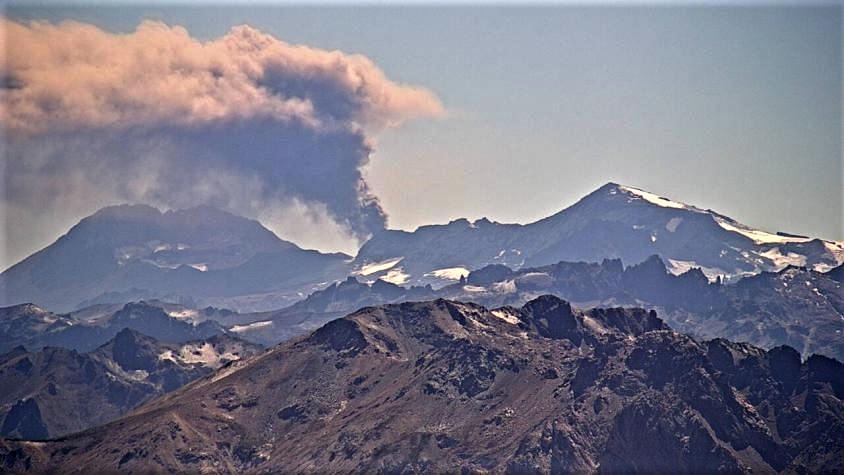
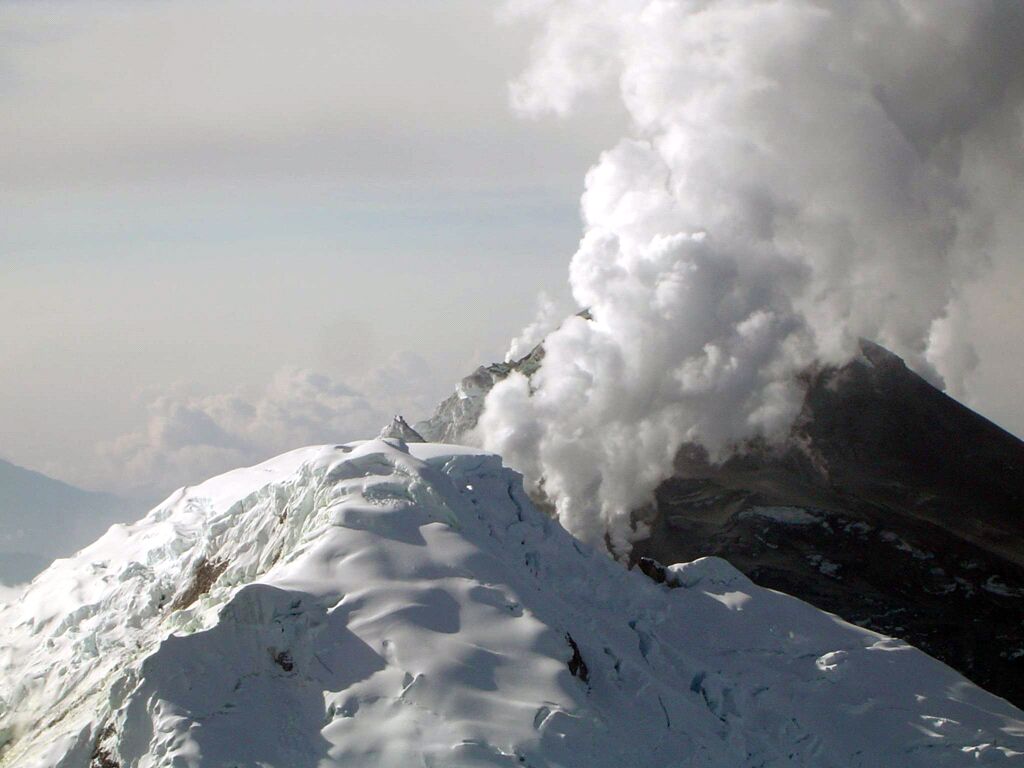
Activity in the Main Crater in the past 24 hours has been characterized by weak to moderate emission of white steam-laden plumes 100 to 800 meters high from the Main Crater that drifted southwest. Sulfur dioxide (SO2) emission was measured at an average of 409 tonnes/day.
The Philippine Seismic Network (PSN) plotted a total of seven hundred forty-four (744) volcanic earthquakes since 1:00 PM, January 12, 2020. One hundred seventy-six (176) of these registered at magnitudes M1.2-M4.1 and were felt at Intensities I-V. Since 5:00 AM on January 24, 2020 until 5:00 AM today, there were six (6) volcanic earthquakes plotted that registered at magnitudes M1.5-M2.3 with no felt event.
For the past 24 hours, the Taal Volcano Network, which can record small earthquakes undetectable by the PSN, recorded four hundred twenty (420) volcanic earthquakes including eleven (11) low-frequency earthquakes. Seismic activity likely signifies magmatic intrusion beneath the Taal edifice that may lead to eruptive activity.
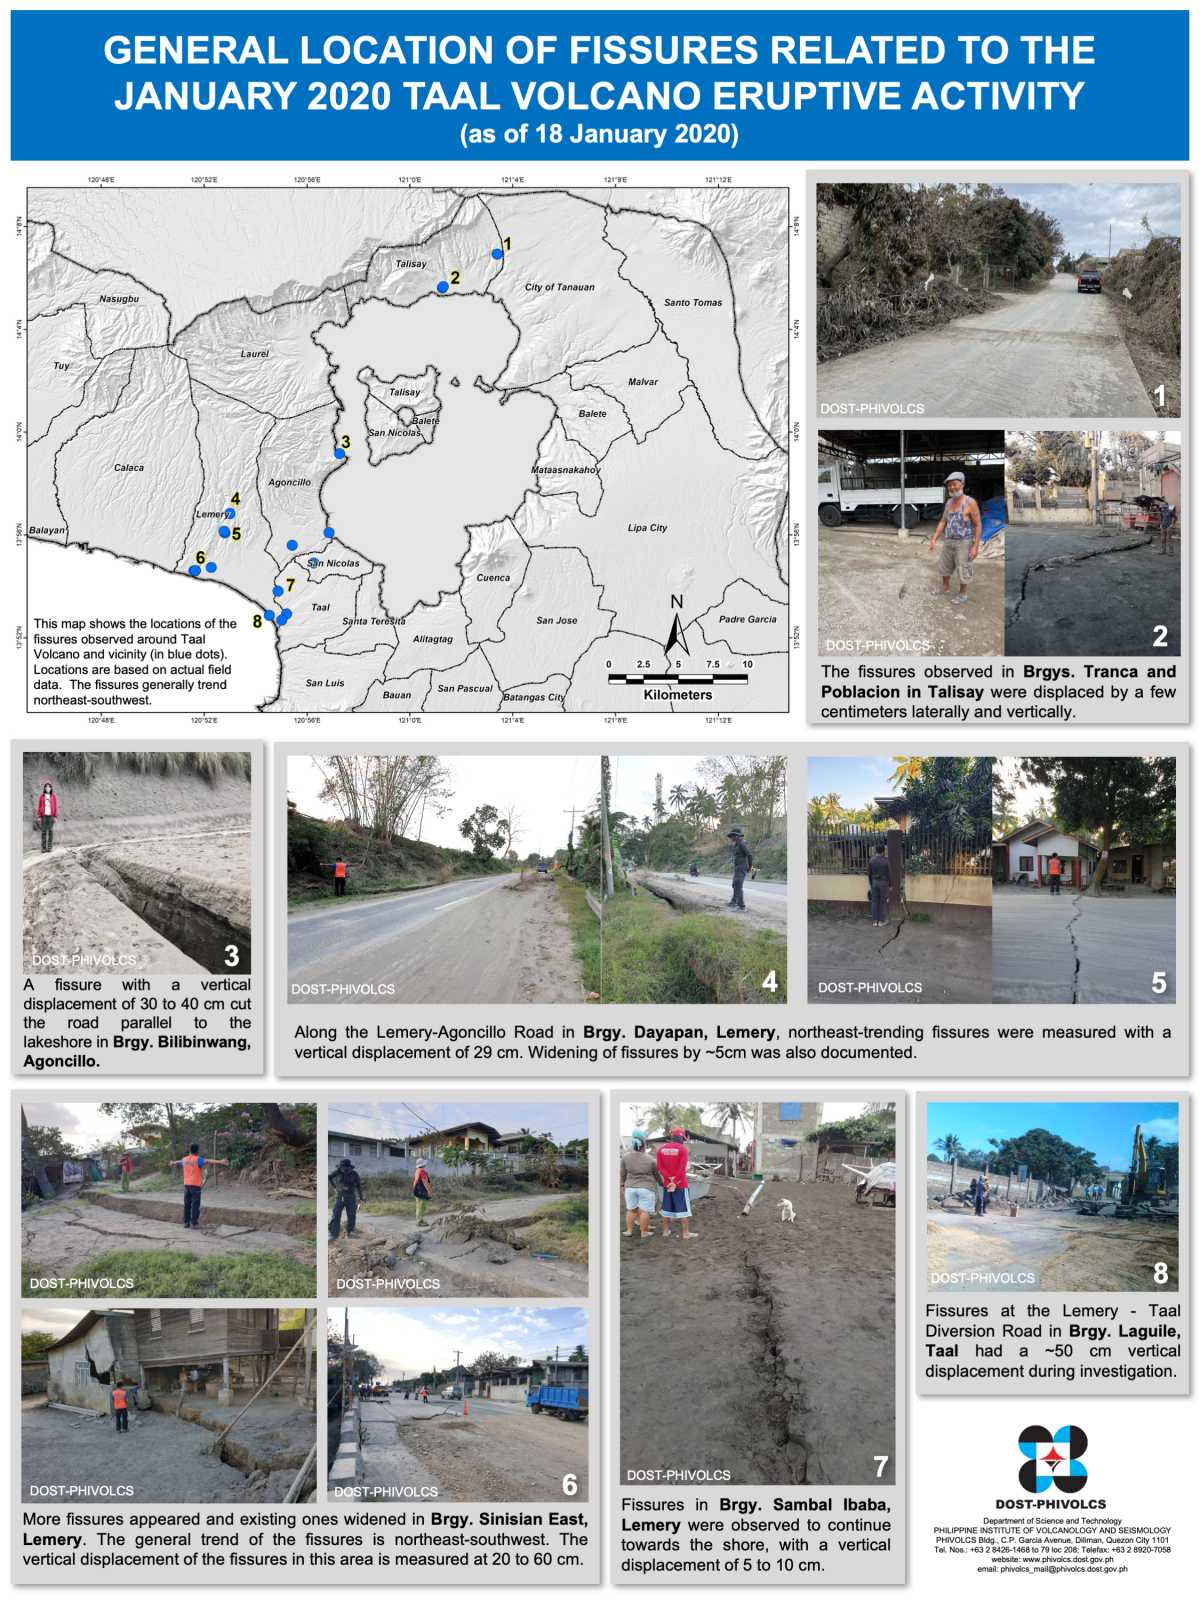
Alert Level 4 still remains in effect over Taal Volcano. DOST-PHIVOLCS recommends total evacuation of Taal Volcano Island and high-risk areas as identified in the hazard maps within the 14-km radius from Taal Main Crater and along the Pansipit River Valley where fissuring has been observed. Based on PAGASA wind forecast, if the eruption plume remains below five (5) km, ash will be drifted to the municipalities west and northwest of the Main Crater; however, if a major eruption occurs during the day and the eruption column exceeds 7 km, ash will also be drifted over the western parts of Laguna and Quezon provinces. Residents around the volcano are advised to guard against the effects of heavy and prolonged ashfall. Civil aviation authorities must advise pilots to avoid the airspace around Taal Volcano as airborne ash and ballistic fragments from the eruption column pose hazards to aircraft.
DOST-PHIVOLCS is continually monitoring the eruption and will update all stakeholders of further developments.
Source : Phivolcs.
Video : Raffy Tima .
Indonesia , Semeru :
VOLCANO OBSERVATORY NOTICE FOR AVIATION – VONA .
Issued: January 24 ,2020
Volcano: Semeru (263300)
Current Aviation Colour Code: ORANGE
Previous Aviation Colour Code: orange
Source: Semeru Volcano Observatory
Notice Number: 2020SMR06
Volcano Location: S 08 deg 06 min 29 sec E 112 deg 55 min 12 sec
Area: East java, Indonesia
Summit Elevation: 11763 FT (3676 M)
Volcanic Activity Summary:
Eruption with volcanic ash cloud at 23h15 UTC (06h15 local).
Volcanic Cloud Height:
Best estimate of ash-cloud top is around 12723 FT (3976 M) above sea level, may be higher than what can be observed clearly. Source of height data: ground observer.
Other Volcanic Cloud Information:
Ash cloud moving to north
Remarks:
Seismic activity is characterized by eruption, avalanche and gas emission earthquakes
Information on the Semeru volcano eruption, January 24, 2020
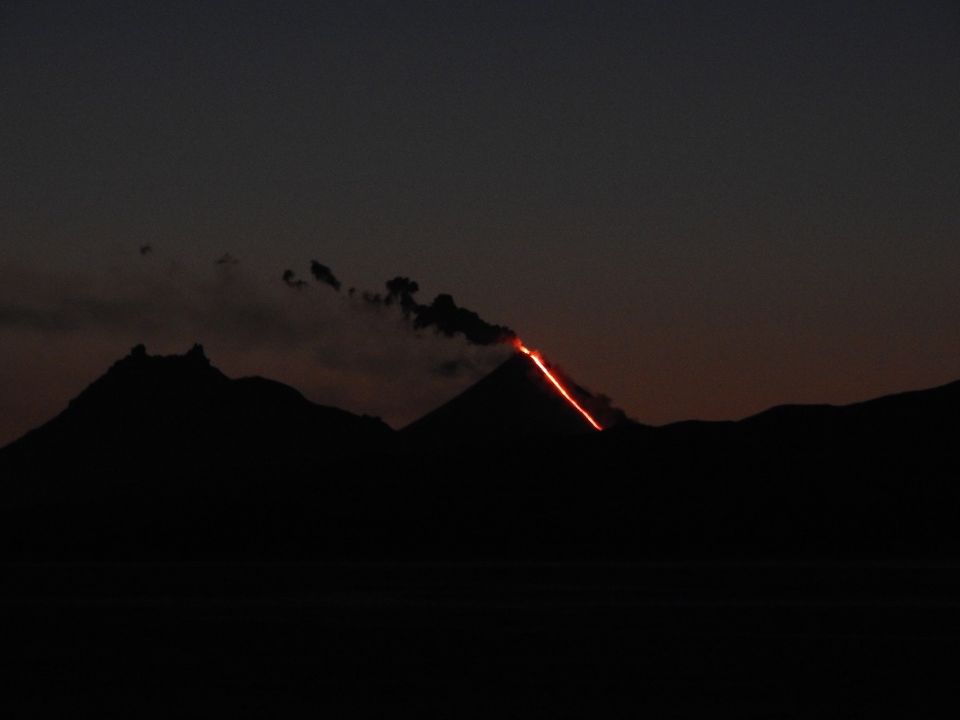
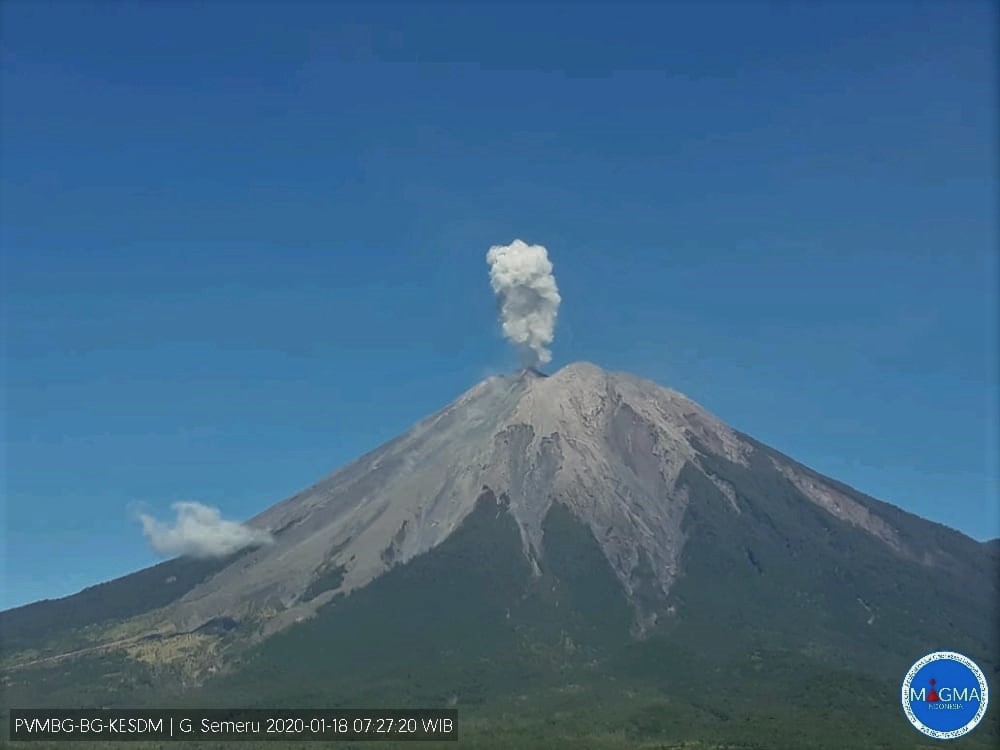
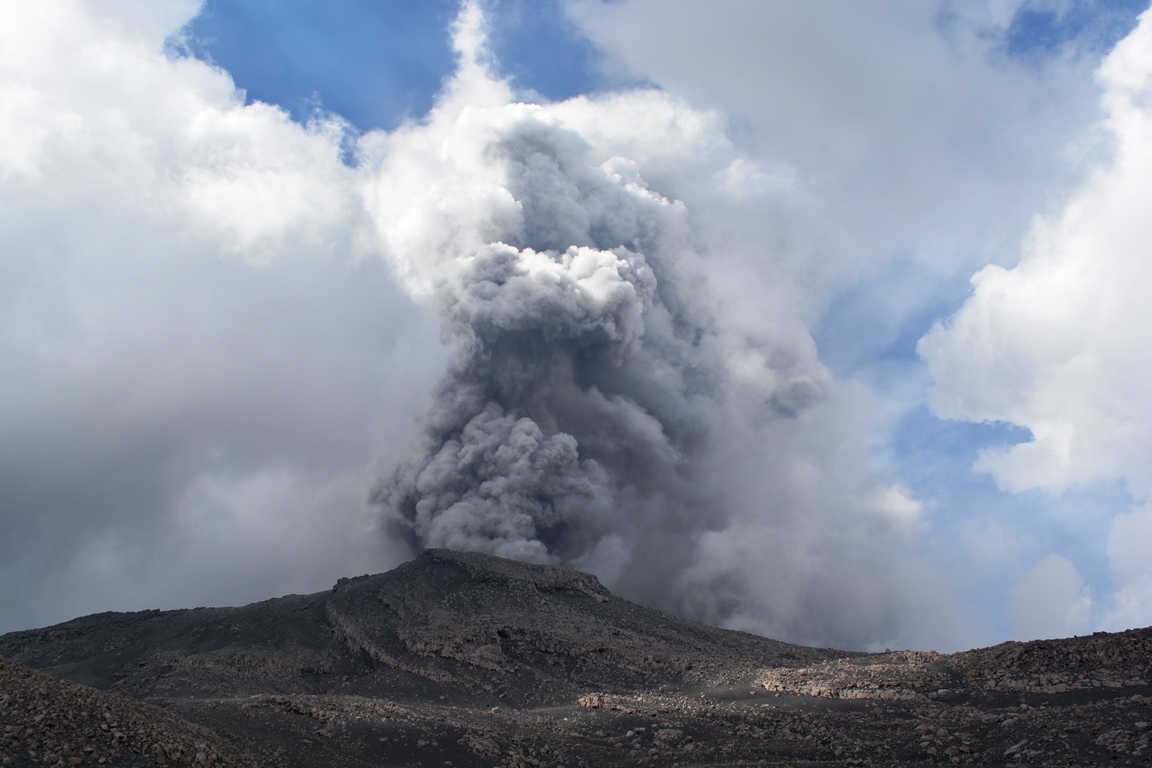
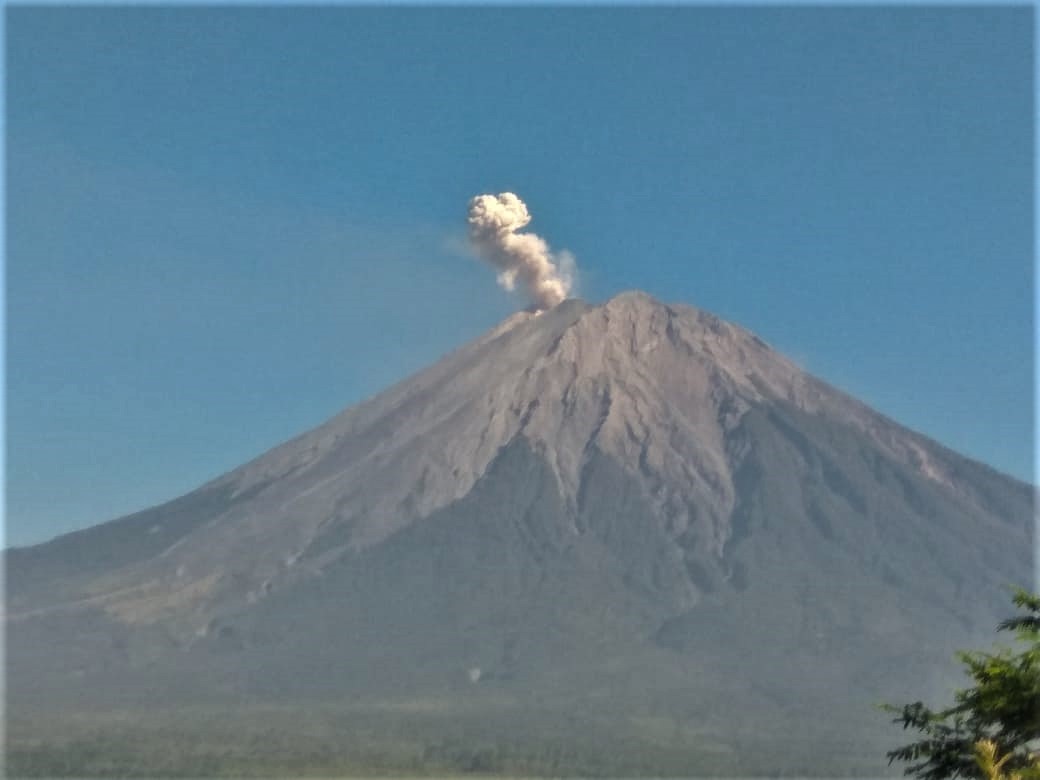
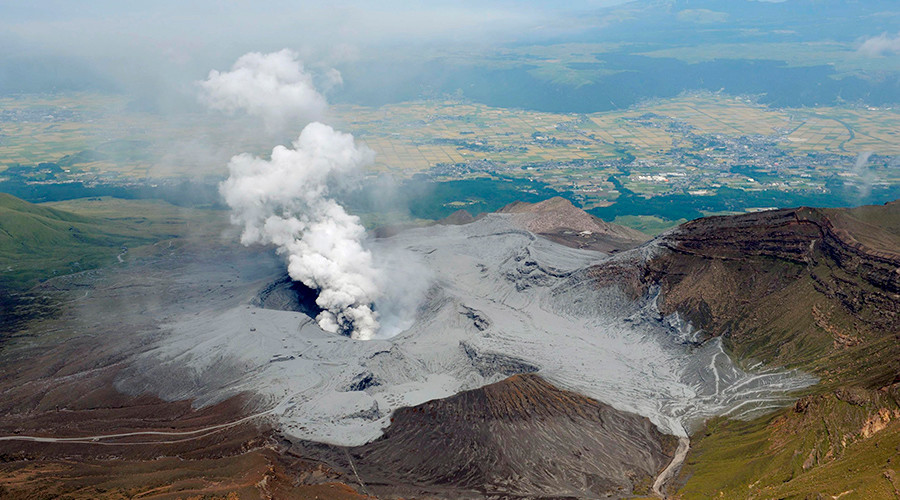
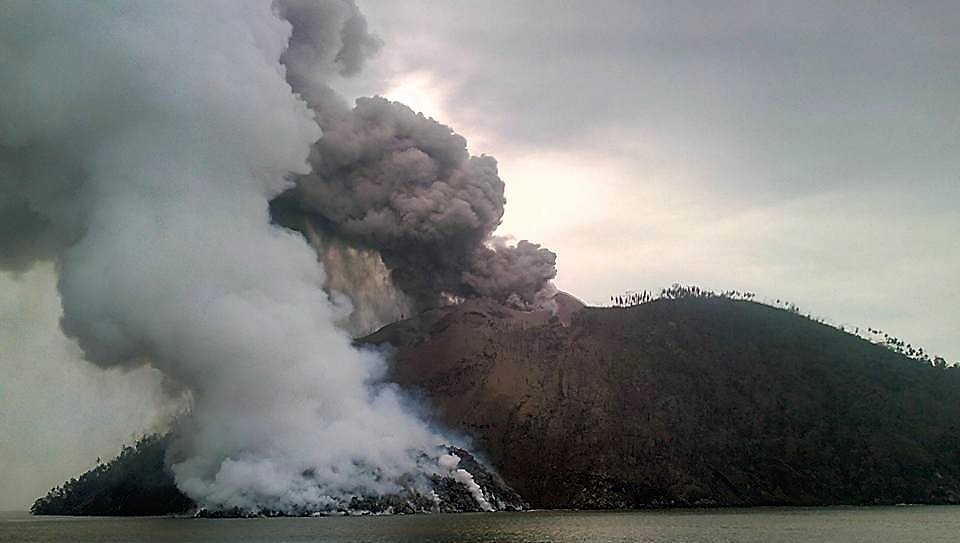
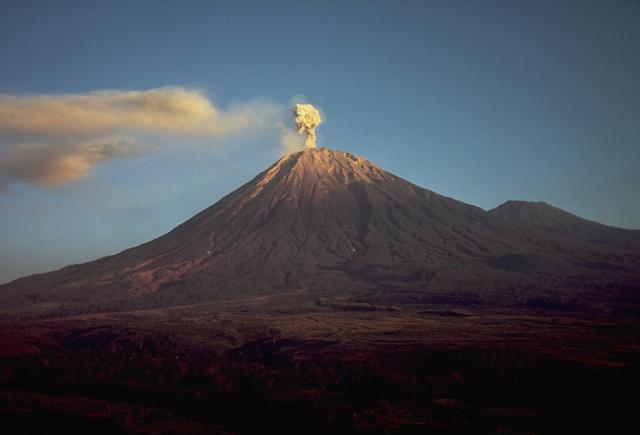
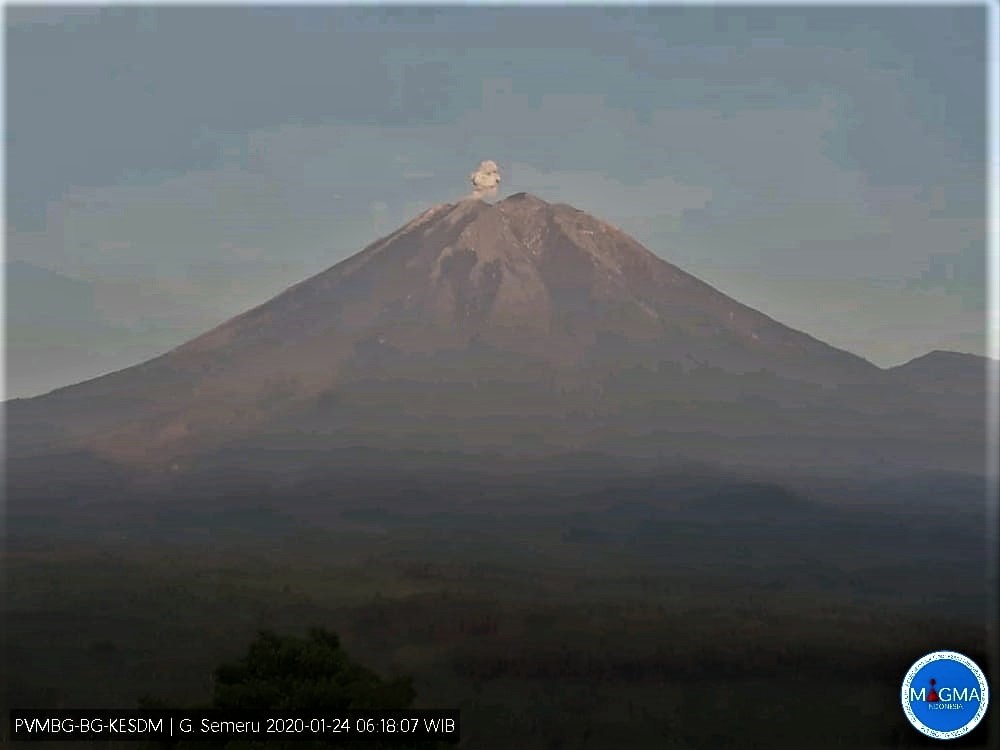
There was an eruption of G. Semeru, East Java on January 24, 2020 at 05:43 WIB with an ash column height observed ± 400 m above the peak (± 4076 m above sea level) . The ash column was observed to be gray with medium intensity, tilted to the northeast. This eruption was recorded on a seismogram with a maximum amplitude of 24 mm and a duration of ± 1 minute 45 seconds.
G. Semeru is currently at level II (alert) with recommendations:
The communities must not carry out activities within a radius of 1 km and in the zone up to 4 km on the sector of the South-South-East slopes of the active crater which is an active opening zone of the crater of G. Semeru (Jongring Seloko) as a channel for sliding warm clouds.
Be aware of the presence of the lava dome in the Seloko Jongring crater..
Source : Magma Indonesie , PVMBG .
Photo : Thomas J. Casadevall, USGS — Smithsonian – Global Volcanism Program, PVMBG.
Italy , Campi Flegrei :
The Pisciarelli fumarolic tremor and the state of activity of the Campi Flegrei volcanic area.
The Campi Flegrei are a volcanic caldera, which was formed following the emptying of a superficial magmatic chamber, due to the great eruption of the Ignimbrite Campana which occurred about 40,000 years ago (Figure 1 ). This area, rich in history and naturalistic emergencies, is characterized, like the other calderas of the world, by the deformations of the ground, the seismicity and by the presence of a vast hydrothermal system.
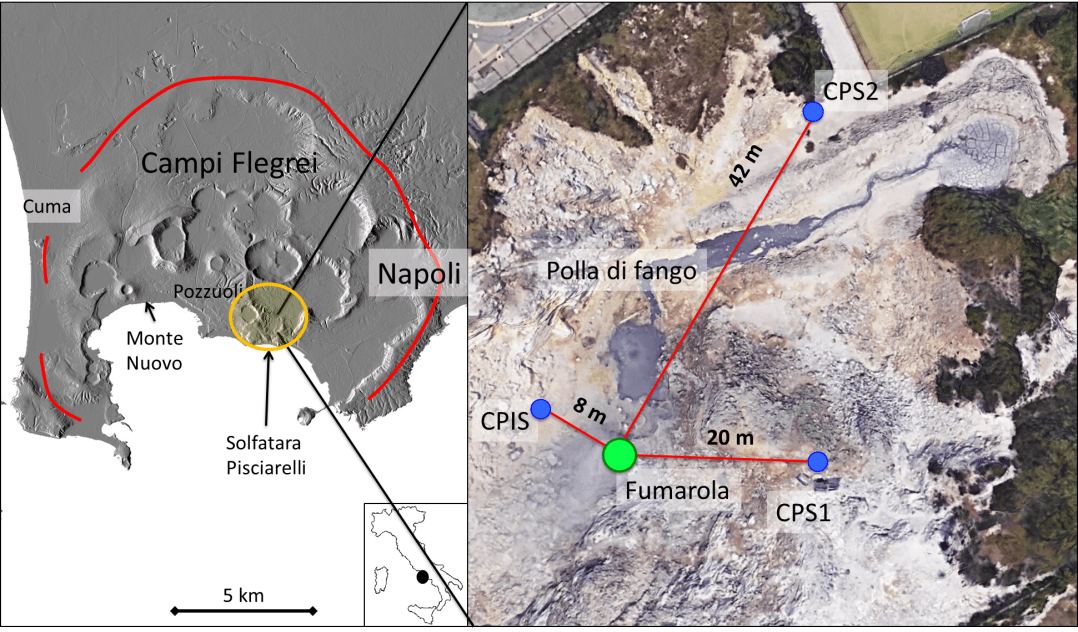
Figure 1 – Map of the Campi Flegrei caldera (left) and the Pisciarelli hydrothermal area (right). In the left panel, the red line indicates the edge of the caldera and the orange circle highlights the hydrothermal area of Solfatara-Pisciarelli. The right panel shows the Pisciarelli fumarole field. The blue circles indicate the position of the seismic stations (CPIS, CPS1 and CPS2) and the green circle indicates the position of the main fumarole. (Modified by Giudicepietro et al. 2019).
Since the 1950s, episodes characterized by earthquakes and rising ground, known as bradyseism, have occurred in the Campi Flegrei region. The main phases of intensification of volcanic processes occurred around 1950, in the period 1968-72 and in the period 1982-85.
From 2004 to today, there is again a moderate but progressive intensification of volcanic manifestations: the lifting resumed, the seismicity, although represented by earthquakes of small magnitude, increased and the activity of the hydrothermal system became more intense in terms of diffuse degassing and degassing of fumaroles. The acceleration of these processes between late 2012 and early 2013 led the Department of Civil Protection to decree the transition from the green alert level (basic) to the yellow level (attention).
The Pisciarelli zone (Figure 2) is a hydrothermal site located on the outer edge of the Solfatara volcano, towards the Agnano basin (Figure 1). Numerous studies carried out by INGV researchers, also in the framework of international collaborations, show that Pisciarelli is a key site for monitoring the changes underway in the Phlegraean area. This fumarolic field acts as a window that allows us to observe what is happening in the vast hydrothermal system present in the central area of the phlegrean caldera. For this reason, in 2010, the Vesuvius Observatory, Neapolitan section of the INGV, installed a new seismic station a short distance (8 m) from the mouth of the main fumarole Pisciarelli, dedicated to recording the tremor generated by the fumarol field of this location, in which, since 2009, there has been an increase in activity.
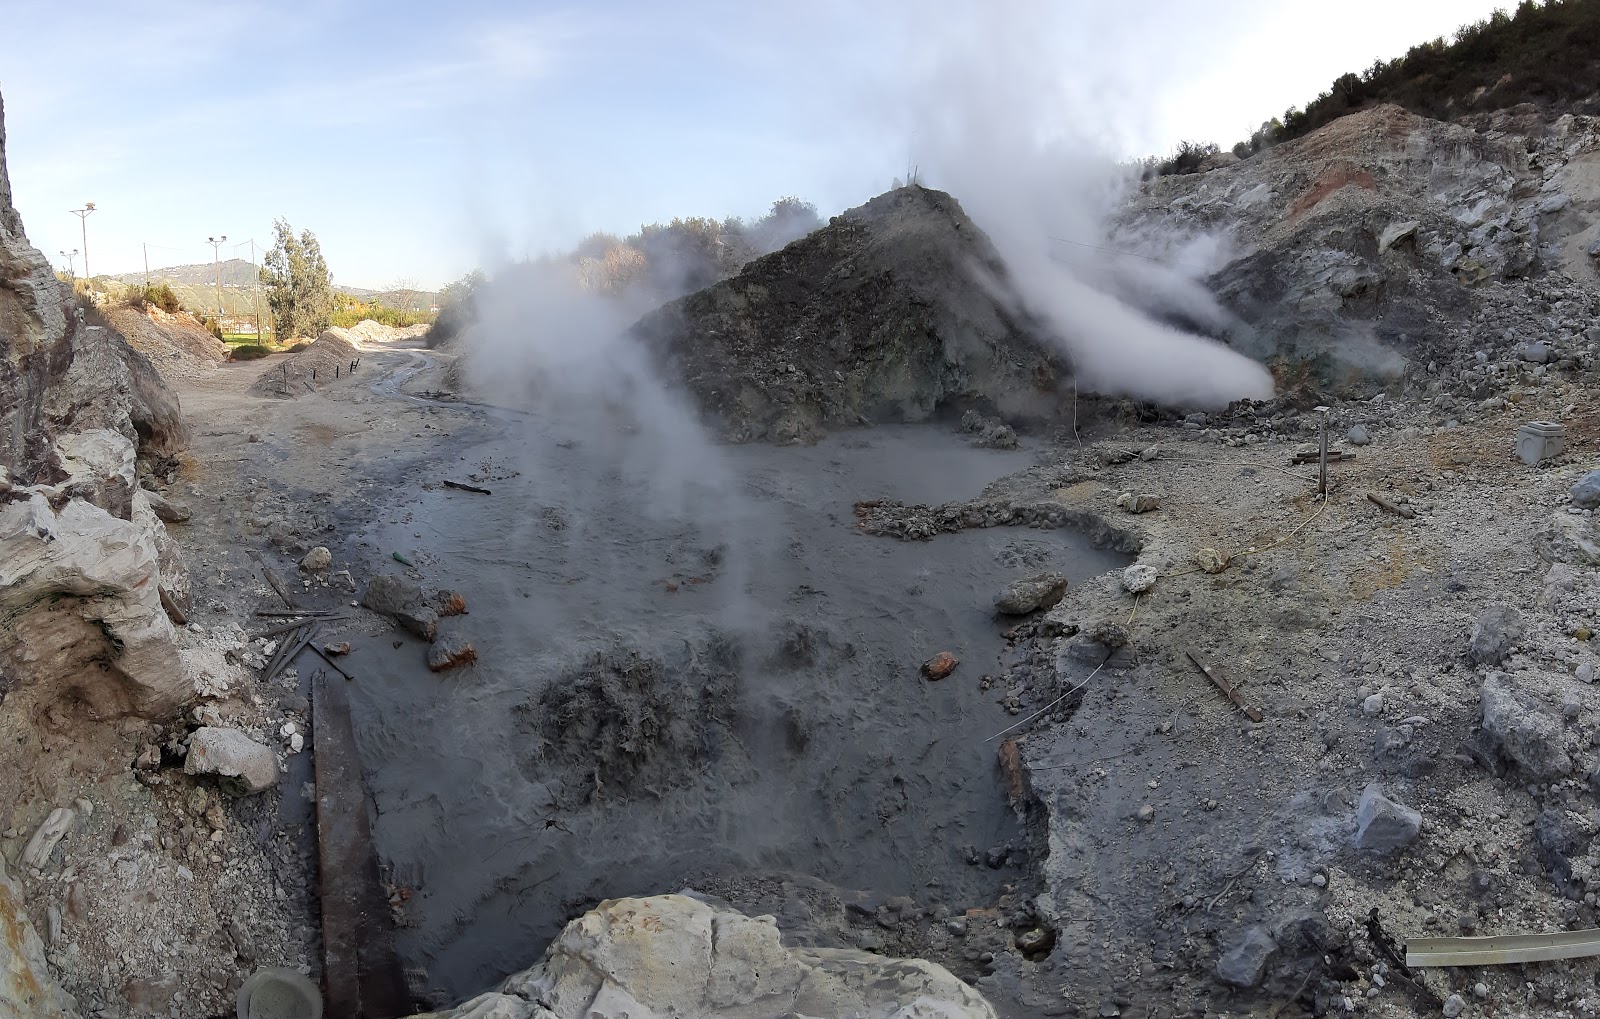
Figure 2 – The Pisciarelli fumarolic field. In the foreground the bubbling mud basin (Photograph by Tullio Ricci, December 2019).
By analyzing the amplitude of the fumarolic tremor over a long period, from January 2010 to April 2019 (Figure 3), there was a gradual increase. The fact that the increase in the amplitude of fumarolic tremor over time is reflected in the trends in geochemical parameters, which have undergone comparable increases, in seismicity (Figure 4), which since 2000 is generally located in the area hydrothermal between Solfatara and Agnano and concentrated to a depth of less than 1 km, in the Pisciarelli area, and in the ground deformations, which from 2005 to 2019 generated a maximum lift of about 60 cm (in the Rione Terra area of Pozzuoli), underlines that the fumarolic tremor of Pisciarelli is not only attributable to local factors, but rather represents an important indicator of the state of activity of the Campi Flegrei , controlled by the activity of a vast hydrothermal system. In fact, the aforementioned geochemical and geophysical parameters (Figure 5), since 2010, have shown an obvious correlation with the amplitude of the seismic tremor recorded in the main fumarole of Pisciarelli.
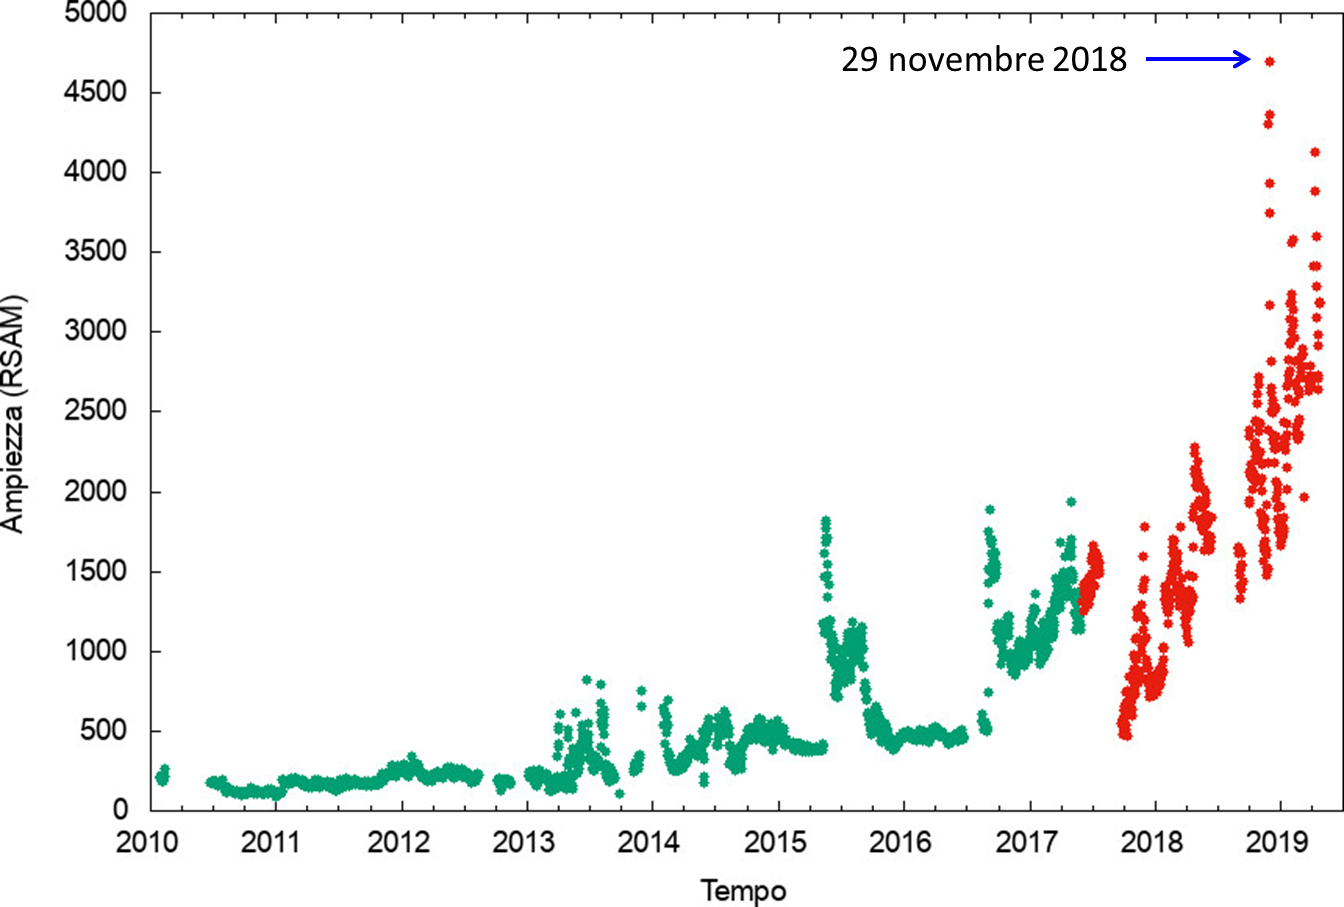
Figure 3 – Amplitude of the seismic signal of the vertical component of the CPIS station. Green dots represent the time series from January 2010 to April 30, 2017, published in Chiodini et al., 2017. Red dots indicate the time series from May 1, 2017 to April 23, 2019. The maximum value in the graph was observed on November 29, 2018 (modified by Giudicepietro et al. 2019). Recent studies based on these observations have shown that the measurement of fumarolic tremor enhances the ability to monitor both the hydrothermal activity of the Pisciarelli area and, more generally, the changes that occur in the Campi Flegrei caldera.
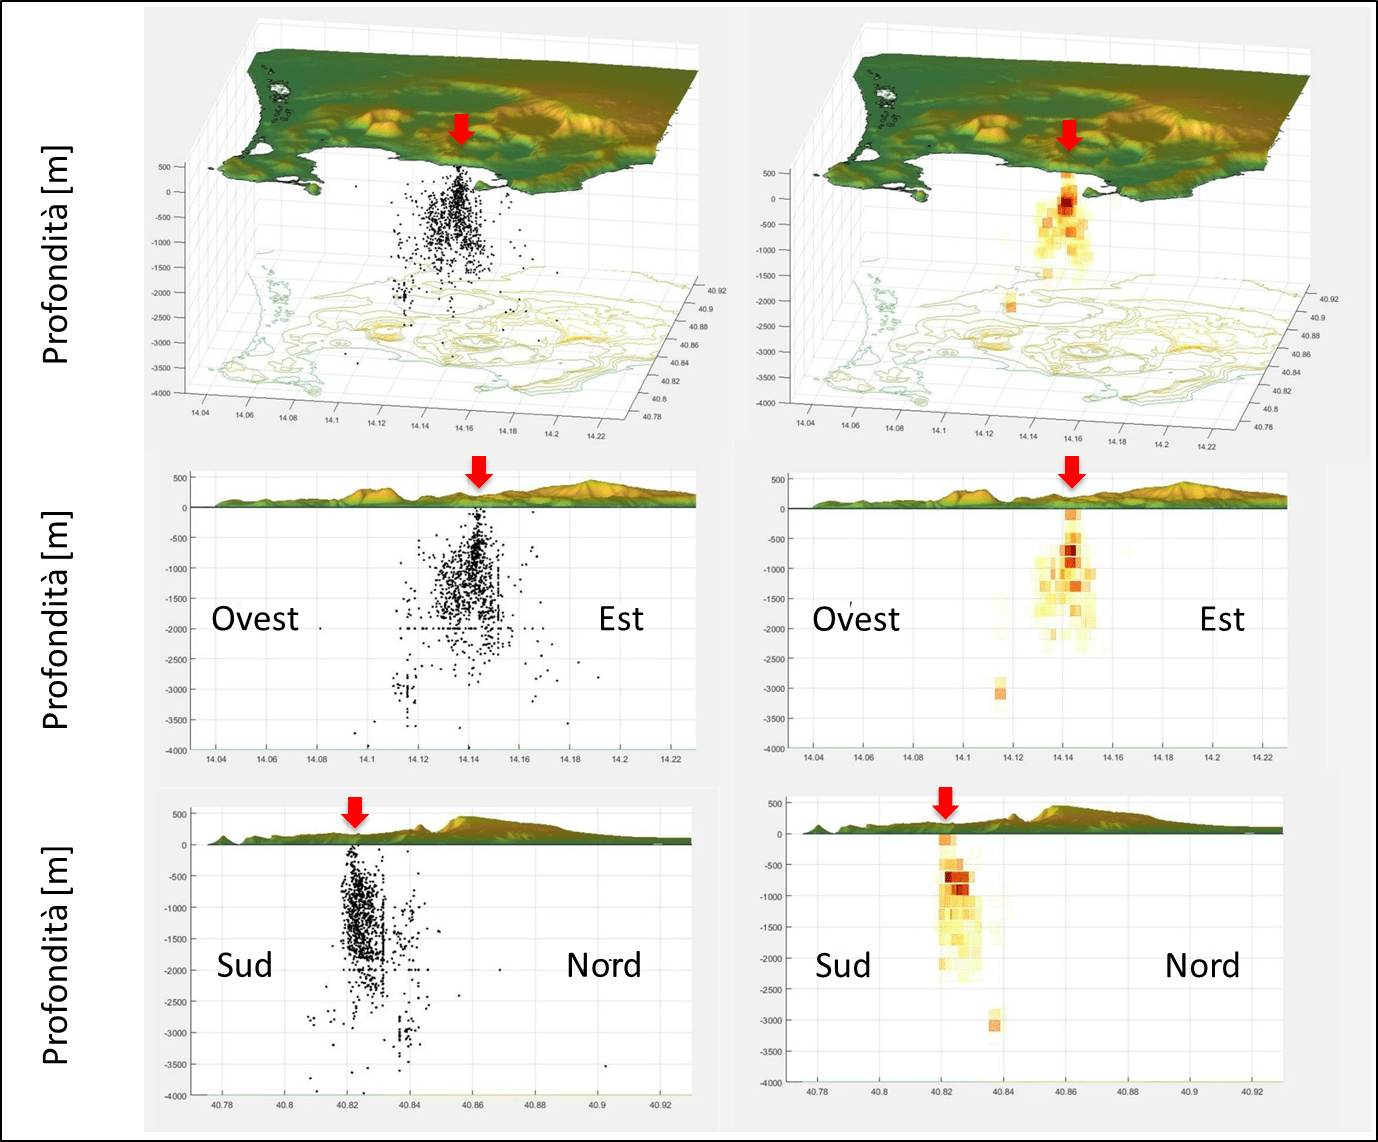
Figure 4 – Seismicity in Campi Flegrei since 2000. The black dots on the images on the left show the locations of earthquakes recorded in Campi Flegrei since 2000. On the right, the distribution of earthquakes in space is illustrated by hypocentral density, which indicates how many earthquakes are included in a certain volume of space (cell). The minimum value (light yellow) is two earthquakes per cell; the maximum (red) is 10 earthquakes per cell. The red arrow indicates the position of the Pisciarelli hydrothermal area. The graphs have an exaggeration of the vertical dimension by a factor of 2 (modified by Giudicepietro et al. 2019).
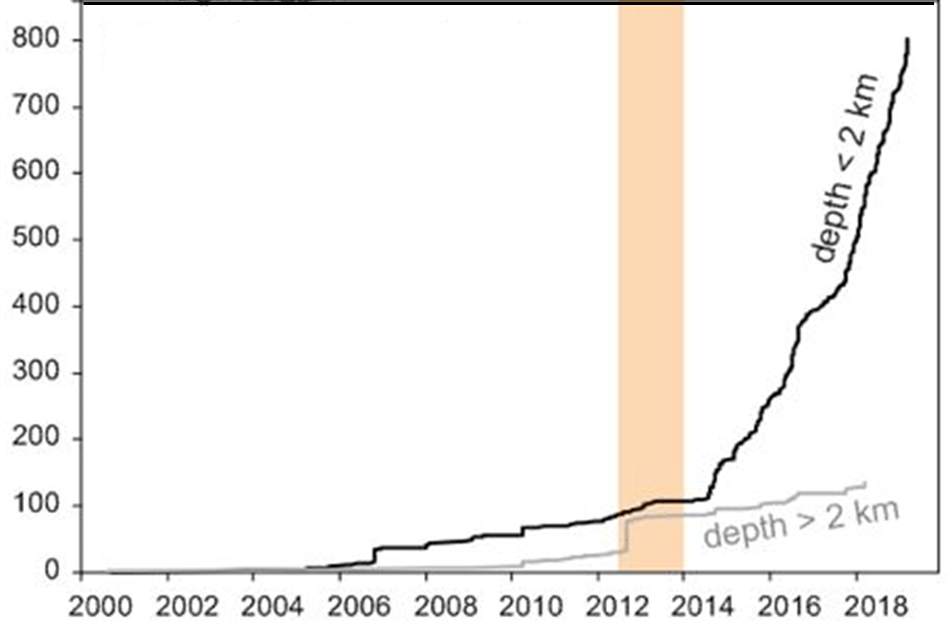
Figure 5 – Trend in seismicity of Campi Flegrei over time. The solid black curve indicates the cumulative number of earthquakes located in the Campi Flegrei zone with a depth <2 km. The gray curve indicates the same parameter with respect to earthquakes with a depth greater than 2 km. The yellow bar indicates a lifting acceleration period (modified by Giudicepietro et al. 2019).
Source : INGV Vulcani .
Written by : Flora Giudicepietro, Giovanni Chiodini, Stefano Caliro, Walter De Cesare, Antonietta Maria Esposito, Danilo Galluzzo, Domenico Lo Bascio, Giovanni Macedonio, Massimo Orazi, Patrizia Ricciolino, Jean Vandemeulebrouck.
Read the whole article : https://ingvvulcani.com/2020/01/24/il-tremore-fumarolico-di-pisciarelli-e-lo-stato-di-attivita-dellarea-vulcanica-dei-campi-flegrei/?fbclid=IwAR1HcqEjOf5ooN5wyAoU7vDVVkZDCTQC78ckrjEceHhMWaIpxS9-ggdB0eo
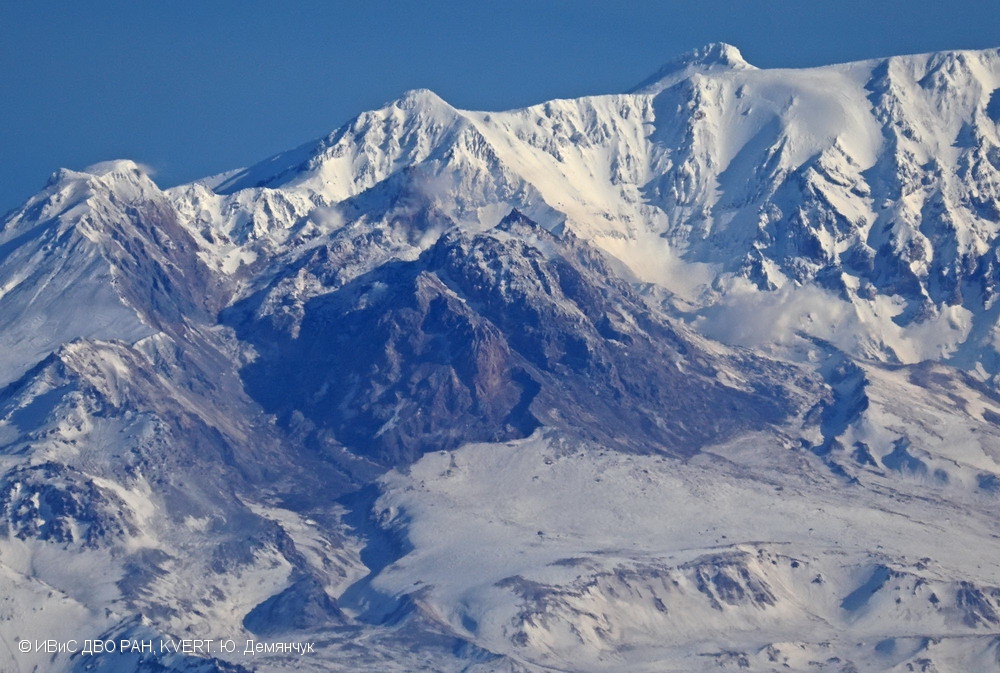
Alaska , Shishaldin :
54°45’19 » N 163°58’16 » W,
Summit Elevation 9373 ft (2857 m)
Current Volcano Alert Level: WATCH
Current Aviation Color Code: ORANGE
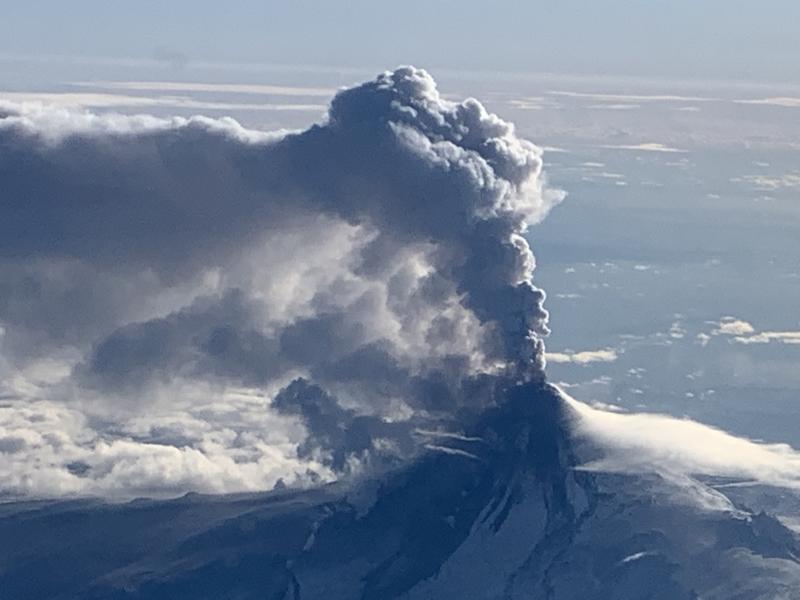
No significant activity has occurred at Shishaldin Volcano since the eruption on Sunday, January 19. This eruption sent lava flows and lahars down the north and northeast flanks, and produced a steam and ash plume that extended offshore up to 150 km (~90 miles) east-southeast, prompting AVO to raise the Aviation Color Code to RED and Alert Level to WARNING Sunday morning. Activity continued throughout the day, with ash production increasing at around 3:30 PM (local time) and the cloud height increasing from about 20,000 to 30,000 ft above sea level.
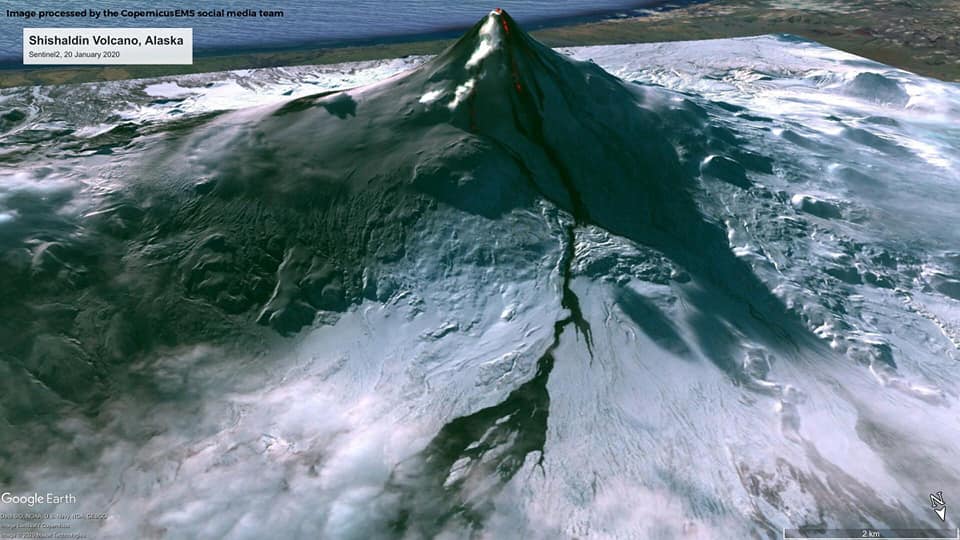
In this 3D rendering of the image acquired on 20 January, by #Sentinel2 we can see the cooling lava flow on the northern flank of the volcano
Trace ash fall was reported in False Pass. Ash production continued until about 8:00 PM when activity declined, and AVO lowered the Aviation Color Code to ORANGE and Alert Level to WATCH. Elevated surface temperatures were seen in satellite images in the days since the eruption, and steaming is visible in web camera images. Seismic and infrasound data suggest small explosions continued at the summit through yesterday, although activity has declined over the past 24 hours.
Though activity has declined over the past few days, eruptive activity at Shishaldin has been episodic over the past several months. It remains possible for unrest to escalate at any time with little warning, and additional lava flows, lahars, and ash-producing eruptions may occur.
Shishaldin is monitored by local seismic and infrasound sensors, satellite data, web cameras, a telemetered geodetic and tilt network, and distant infrasound and lightning networks.
Source : AVO.
Photos : Setiawan , Copernicus.