June 13 , 2020.
Ecuador , Sangay :
Summary:
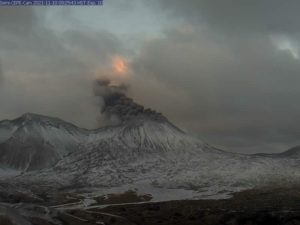
The Sangay volcano continues its current eruptive process started on May 7, 2019 (a total of 402 days until the publication of this report). Ash falls have been recorded in recent days in areas far from the volcano due to strong winds that directed the ashes to the provinces of Chimborazo, Cañar, Bolívar, Guayas, Santa Elena, Tungurahua and Cotopaxi.
Over the past 24 hours, a slight increase in eruptive activity has been recorded with a higher gas and ash emission height, reaching between 1.5 and 2.8 km above the crater level, an increase in the importance of ash clouds to the west and southwest, reaching up to more than 600 km from the volcano, and an increase in the number of thermal anomalies located on the southeast flank of the volcano, associated with a higher emission of lava. Therefore, surface activity is characterized as HIGH with an increasing trend. An impulse of seismic activity associated with this increase in surface activity was also detected.
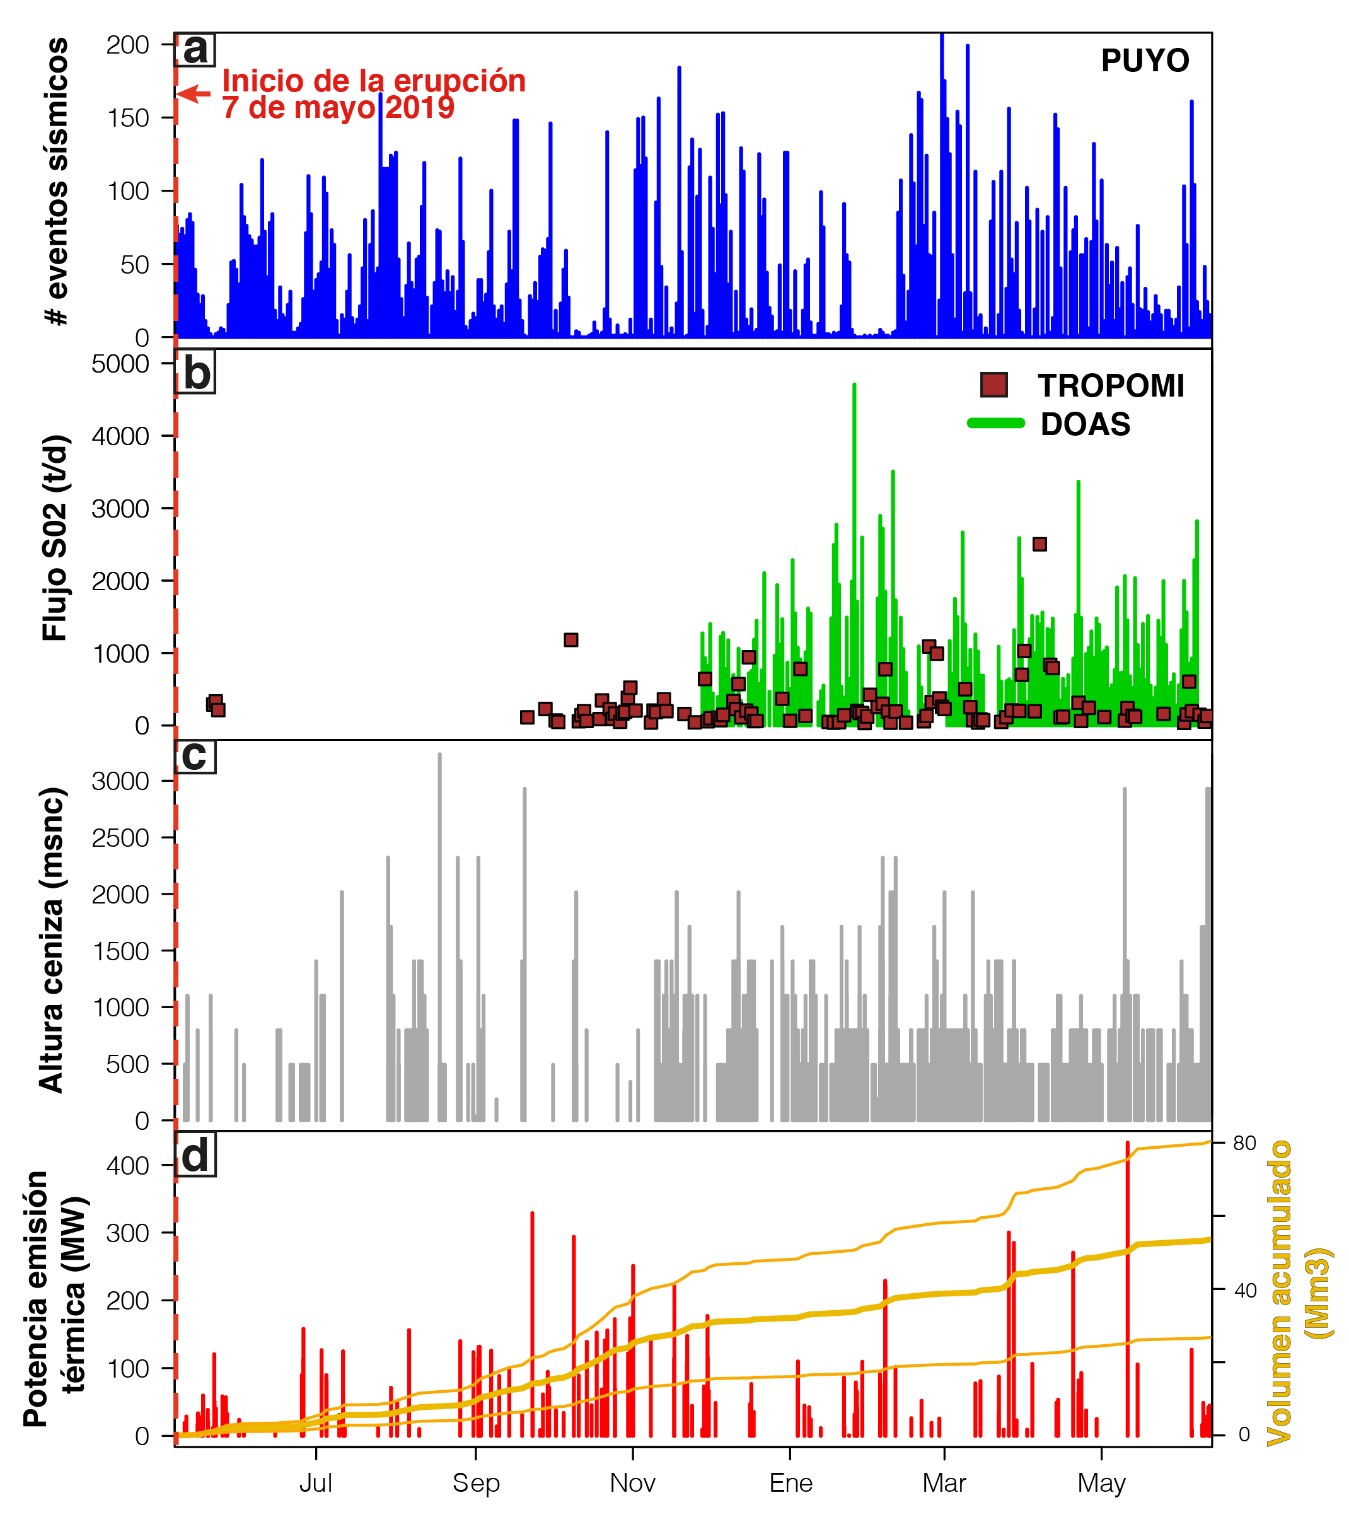
Figure 1. Multiparametric graph of the activity of the Sangay volcano from May 2019 to June 12, 2020. a: seismic activity (number of events per day) detected at the PUYO station (source: IG-EPN); b: SO2 emissions (tonnes per day) detected by the Sentinel-5P satellite sensor (TROPOMI: red squares; source: MOUNTS) and by IGEPN (DOAS: green bars); c: height of the ash clouds (m above the crater level) detected by the GOES-16 satellite sensor (source: Washington VAAC); d: thermal emission power (megawatt) detected by the MODIS satellite sensor (source: MODVOLC) and estimate of the accumulated lava volume (millions of m3, the fine lines represent the error range).
Based on the monitoring parameters, it is evident that the eruptive process continues (Figure 1). Therefore, it is estimated that the most likely short-term scenario is that activity will continue with the same phenomena observed until the date of publication of this report. However, the possibility of a sudden variation in the activity of the volcano is not excluded, the potential eruptive scenarios are detailed at the end of the technical-scientific appendix. The Geophysical Institute of the National Polytechnic School is attentive to the current eruptive process of the Sangay volcano and will inform in good time of any variation in its behavior.
Deformation:
For the analysis of the deformation, the interferometric processing of the synthetic aperture radar (InSAR) images was carried out, with Sentinel-1 images from the European Space Agency (ESA), using the LICSBAS software. (COMET). The figure corresponds to a speed map obtained on the basis of InSAR with Sentinel-1 images in descending orbit from January 04, 2019 to June 03, 2020.
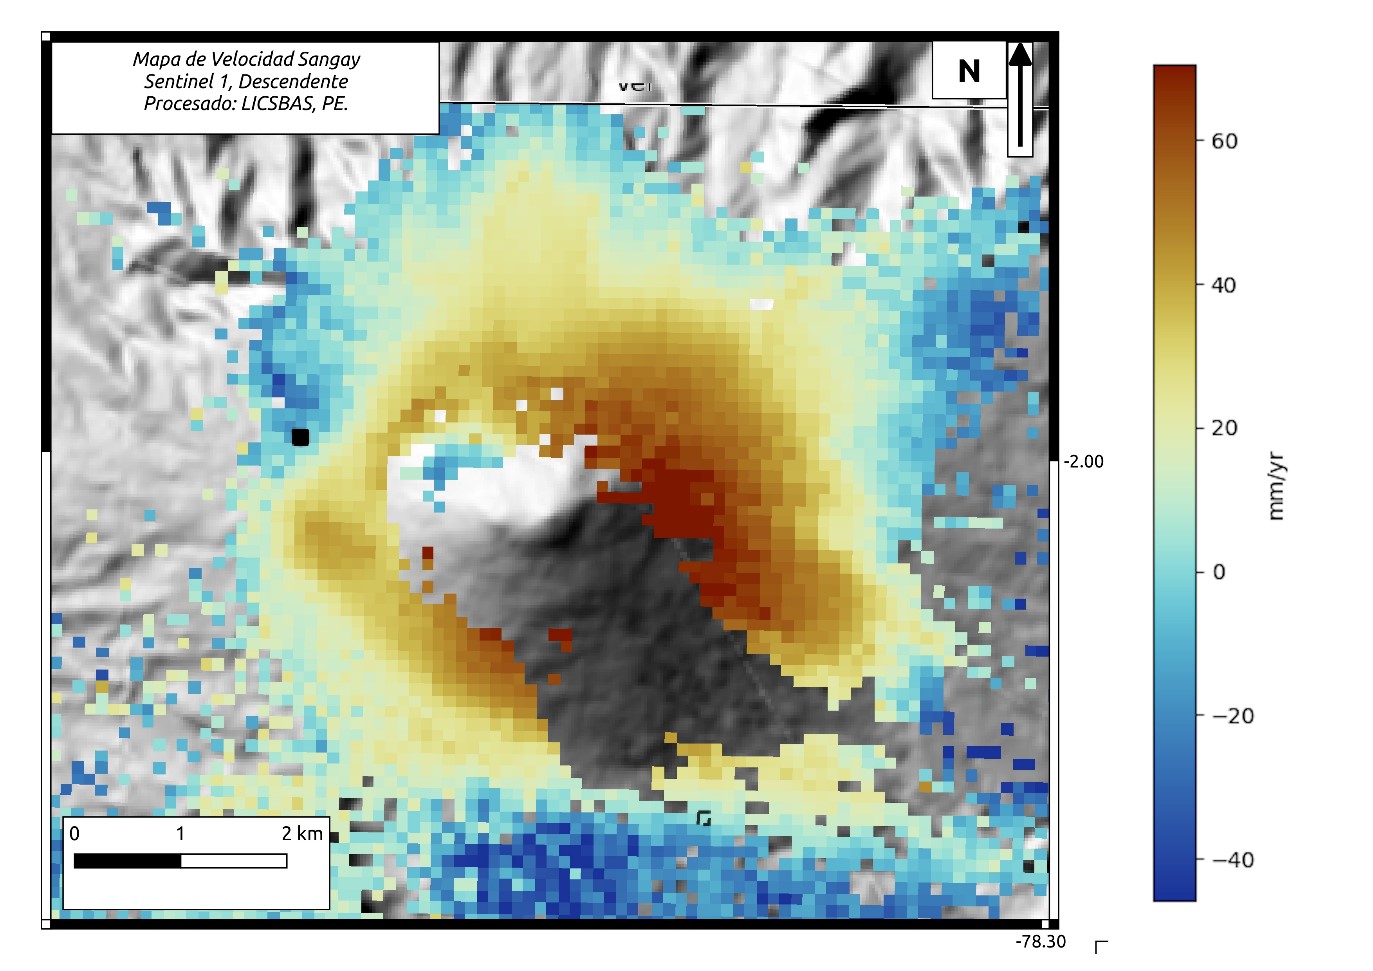
Figure 5. Map of the strain rates obtained by InSAR, based on Sentinel-1 images of the descending orbit in the Sangay volcano, between January 04, 2019 and June 03, 2020. Processing with LICSBAS software (COMET).
The zones represented in orange-red color record the displacement of the flanks of the volcano at a speed greater than or equal to 40 mm / year in line of sight from the satellite (LOS). This displacement is considered as a positive deformation called « inflation ». In the south-eastern part of the map, shown in gray, the consistency is weak due to recent volcanic materials, deposited in the area due to current activity (lava flows and pyroclastic deposits). These new and changing deposits prevent the measurement of deformation in this area.
Changes in the summit area:
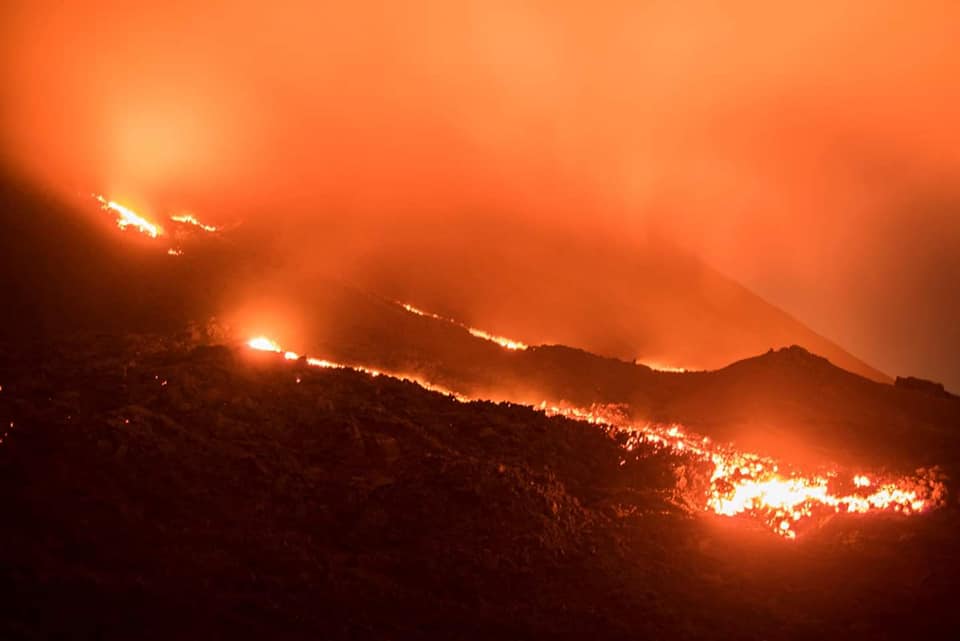
During the current eruptive period of the Sangay volcano, two emission centers with different types of activity were identified. The central crater is characterized by the generation of gas and ash emission columns, which are transported depending on the wind speed and direction, and the vent of Ñuñurco, characterized by the emission of lava flows . The latter was responsible for the most significant changes in the morphology of the volcano. These changes are associated with the high emission rates of lava flows from the vent and due to this type of activity, strong erosion was observed on the southeast flank.
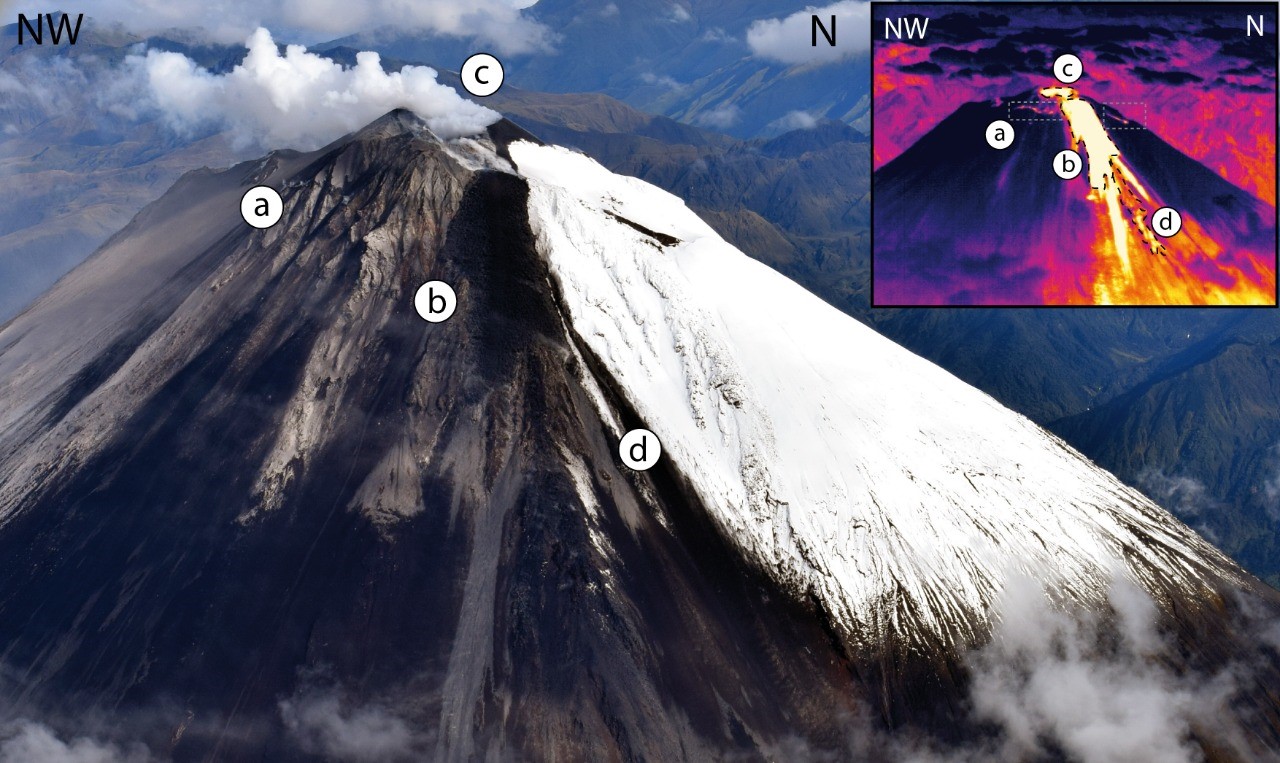
Figure 8. Above: First overview of the Sangay volcano (May 17, 2019), we observe: a. aligned fumarole field, b. lava flow, c. central crater, d. small pyroclastic deposits (Source: IGEPN). Bottom left (December 18, 2019): observation of the channel eroded by lava and pyroclastic flows. Bottom right (June 10, 2020): observation of the channel which has grown (width and depth). (Source: courtesy J. ANHALZER).
This gradual erosion has led to the formation of a large gully through which new lava flows and pyroclastic density currents (pyroclastic flows) derived from the collapse of their fronts are channeled. The fixed cameras of the integrated monitoring system ECU911 in the province of Morona Santiago, confirmed that this gully has increased in size, length, width and depth… / …
Source : IGEPN
Read the whole article : https://www.igepn.edu.ec/servicios/noticias/1818-informe-especial-del-volcan-sangay-n-3-2020.
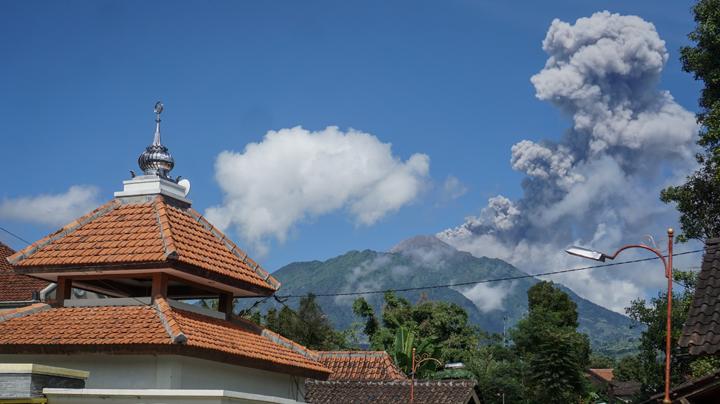
Indonesia , Merapi :
Report on the activity of the Merapi volcano, from June 5 to 11, 2020.
OBSERVATION RESULTS
Visual
The weather around Mount Merapi is generally sunny in the morning and at night, while the day until evening is foggy. There is a white smoke, from thin to thick with low pressure. The maximum smoke height of 350 m was observed from the Kali Merapi observation post on June 11, 2020 at 8:10 a.m.
Morphological analysis of the crater area based on photos of the Southeast sector showed no change in the morphology of the dome. The volume of the lava dome based on measurements using aerial photos with a drone on February 19, 2020, is 291,000 m3.
Seismicity:
This week, the seismicity of Mount Merapi recorded:
72 emission earthquakes (DG),
45 Multiple Phase (MP) earthquakes,
9 low frequency earthquakes (LF),
13 avalanche earthquakes. (RF),
17 tectonic earthquakes (TT).
The intensity of the seismicity this week is higher than last week.
Deformation:
The deformation of the Merapi which was monitored by EDM and GPS this week did not show any significant changes.
Rain and lahars:
This week, there was rain at the Mount Merapi observation post with the highest rain intensity of 10 mm / hour for 60 minutes at the Babadan post on June 5, 2020. There is had neither lahar nor additional flow in the rivers that descend from Mount Merapi.
Conclusion:
Based on the results of the visual and instrumental observations, it was concluded that:
1. The lava dome is currently in a stable state.
2. The volcanic activity of Mount Merapi is still quite high and is determined by the level of activity « WASPADA ».
Source : BPPTKG.
Photo : Tempo .
Hawaii , Mauna Loa :
19°28’30 » N 155°36’29 » W,
Summit Elevation 13681 ft (4170 m)
Current Volcano Alert Level: ADVISORY
Current Aviation Color Code: YELLOW
Activity Summary:
Mauna Loa Volcano is not erupting. Rates of deformation and seismicity have not changed significantly over the past week and remain above long-term background levels.
Observations:
During the past week, HVO seismometers recorded 107 small-magnitude earthquakes on the volcano. Most of these earthquakes occurred at shallow depths of less than 8 kilometers (~5 miles) below sea level. The largest earthquake was a magnitude 2.8 (M2.8) event that occurred below the Pahala area on June 10.
Global Positioning System (GPS) measurements show long-term slowly increasing summit inflation, consistent with magma supply to the volcano’s shallow storage system.
Gas concentrations and fumarole temperatures at both the summit and the Sulphur Cone on the Southwest Rift Zone remain stable.
Webcams show no changes to the landscape.
Source et photo : HVO.
Guatemala , Pacaya :
Type of activity: Strombolian
Morphology: composite stratovolcano
Location: 14 ° 22’50’ Latitude N; 90 ° 36’00˝Longitude W
Height: 2552msnm
Atmospheric conditions: partly cloudy.
Wind: northeast
Precipitation: 0.0 mm.
Activity:
There are white degassing fumaroles that disperse to the south and southwest. Strombolian explosions are also generated which expel incandescent materials from 25 to 75 m above the crater. Seismic stations record tremors associated with the rise of magma and gases on the surface. Two lava flows are active in the North and North-West.
Source : Insivumeh .
Photo : David Rojas .