
March 28 , 2023.
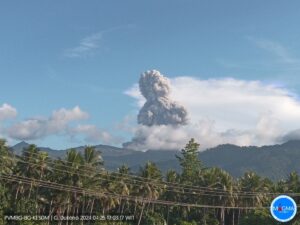
Indonesia , Ili Lewotolok :
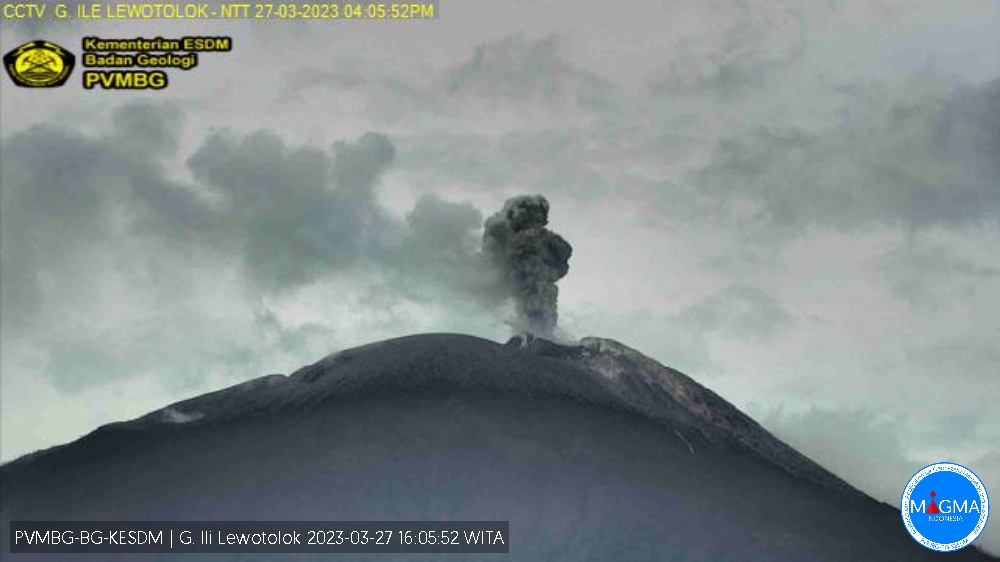
An eruption of G. Ili Lewotolok occurred on Monday, March 27, 2023 at 4:04 p.m. WITA with the height of the ash column observed at ± 750 m above the summit (± 2173 m above sea level) . The ash column was observed to be gray with a thick intensity oriented to the west and northwest. This eruption was recorded on a seismograph with a maximum amplitude of 8.7 mm and a duration of 52 seconds.
VOLCANO OBSERVATORY NOTICE FOR AVIATION – VONA
Issued : March 27 , 2023
Volcano : Ili Lewotolok (264230)
Current Aviation Colour Code : ORANGE
Previous Aviation Colour Code : orange
Source : Ili Lewotolok Volcano Observatory
Notice Number : 2023LEW012
Volcano Location : S 08 deg 16 min 19 sec E 123 deg 30 min 18 sec
Area : East Nusa Tenggara, Indonesia
Summit Elevation : 4554 FT (1423 M)
Volcanic Activity Summary :
Eruption with volcanic ash cloud at 08h04 UTC (16h04 local).
Volcanic Cloud Height :
Best estimate of ash-cloud top is around 6954 FT (2173 M) above sea level or 2400 FT (750 M) above summit. May be higher than what can be observed clearly. Source of height data: ground observer.
Other Volcanic Cloud Information :
Ash cloud moving from west to northwest. Volcanic ash is observed to be gray. The intensity of volcanic ash is observed to be thick.
Remarks :
Eruption recorded on seismogram with maximum amplitude 8.7 mm and maximum duration 52 second.
Source et photo : Magma Indonésie.
Colombia , Nevado del Ruiz :
Nevado del Ruiz Weekly Activity Bulletin
Regarding the monitoring of the activity of the NEVADO DE RUIZ VOLCANO, the MINISTRY OF MINES AND ENERGY through the COLOMBIAN GEOLOGICAL SERVICE (SGC) informs that:
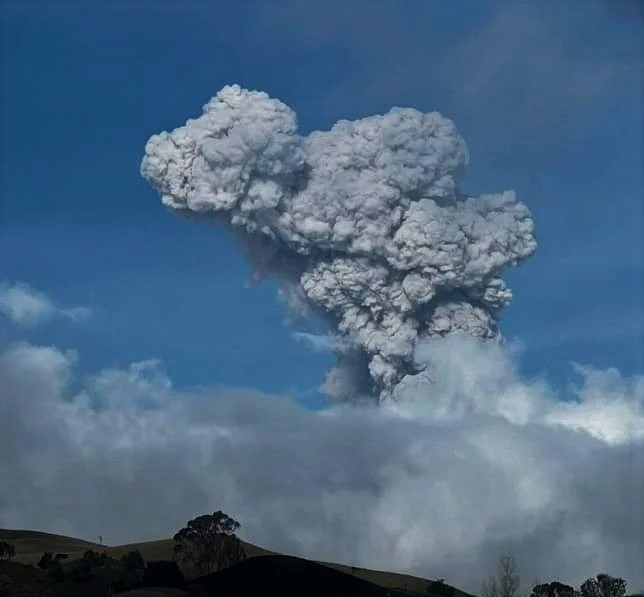
Seismic activity related to the movement of fluids inside volcanic conduits decreased in the number of recorded events and increased in the seismic energy released compared to the previous week. The recording of several seismic signals of longer duration (pulses of volcanic tremor) with moderate energy levels and frequent emissions of gas and ash stands out. According to images captured by conventional and thermographic cameras installed in the volcano area, several gas and ash emissions and temperature changes of the emitted material have been confirmed. Both phenomena were related to some of the seismic signals recorded. The strongest gas and ash emission occurred on March 20, at 9:02 a.m., reaching a height of 2700 meters measured at the top of the volcano, visible from several municipalities of Caldas, Tolima and Risaralda due to favorable weather conditions. From remote satellite sensors, thermal anomalies have been detected in the Arenas crater, of low to moderate energy for this week.
Seismic activity associated with rock fracturing decreased in the number of earthquakes recorded and seismic energy released compared to the previous week. The earthquakes were located mainly in the South-East, South-West and North-East sectors and in the Arenas crater. Depths fluctuated between 1.0 and 5.7 km (reference level 5100 m). The maximum local magnitude was 0.9 corresponding to the earthquake of March 16 at 12:15 a.m., located in the Arenas crater, 1.6 km deep. On March 19, several episodes of seismicity related to the process of ascent, establishment, growth and evolution of a lava dome at the bottom of the Arenas crater were recorded. These episodes were low energy and short in duration. Deformation of the volcanic surface continued to show minor changes.
The activity level of the volcano remains at YELLOW LEVEL (III): CHANGES IN THE BEHAVIOR OF VOLCANIC ACTIVITY
Source : SGC.
Photo : Entérate Ciénaga
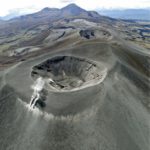
Indonesia , Galunggung :
The Galunggung volcano’s center of activity is currently a circular crater with a diameter of 1000 meters and a depth of 150 meters. This crater is inside the horseshoe-shaped Galunggung caldera which opens to the southeast over a length of about 9 km and a width of between 2 and 7 km. The walls of Galunggung have a maximum height of about 1000 meters in the West-North-West and decrease to 10 meters in the East-South-East.
The latest developments in the activity of the G. Galunggung crater until March 24, 2023 at 12:00 WIB are as follows:
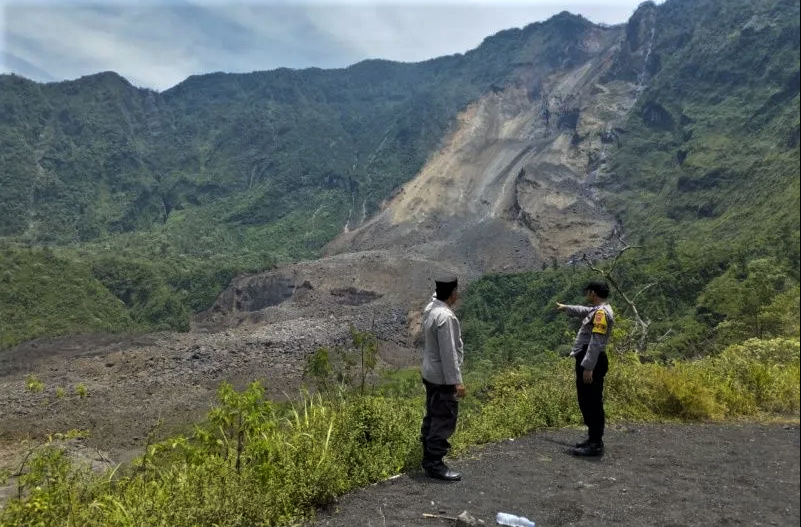
On March 12, 2023 at 01:06 WIB, there was a major landslide on the west side of the Galunggung caldera wall. This landslide was recorded on a seismograph with an amplitude of 13.5 mm and a duration of 242 seconds. Landslide events on the walls of the caldera are still recorded on simographs until March 16, 2023 with increasingly smaller amplitudes, ranging from 1.5 to 2 mm and a duration of 65 to 110 seconds. On March 24, 2023, avalanches still occurred but with decreasing intensity.
Visual observations up to March 24, 2023, both by the crater camera and by direct field monitoring, show that there has been no change in the volcanic activity of the Galunggung crater. The color of the water in the crater lake has not changed, namely light green and yellow/turbid. The smoke from the solfatara was not observed and the sulphurous gas was not felt. The water temperature of the crater lake has not changed, still around 23 C – 25 C.
The seismic observations of G. Galunggung in the period from March 1 to March 24, 2023 were still dominated by distant tectonic earthquakes which recorded 51 events. Deep volcanic earthquakes have not seen an increase and only 6 events have been recorded. Observations of deformation with an inclinometer and the global positioning system (GPS) show that there is no deformation of the body of the volcano.
Source : Magma Indonésie.
Photo : ANTARA/HO-Polsek Sukaratu
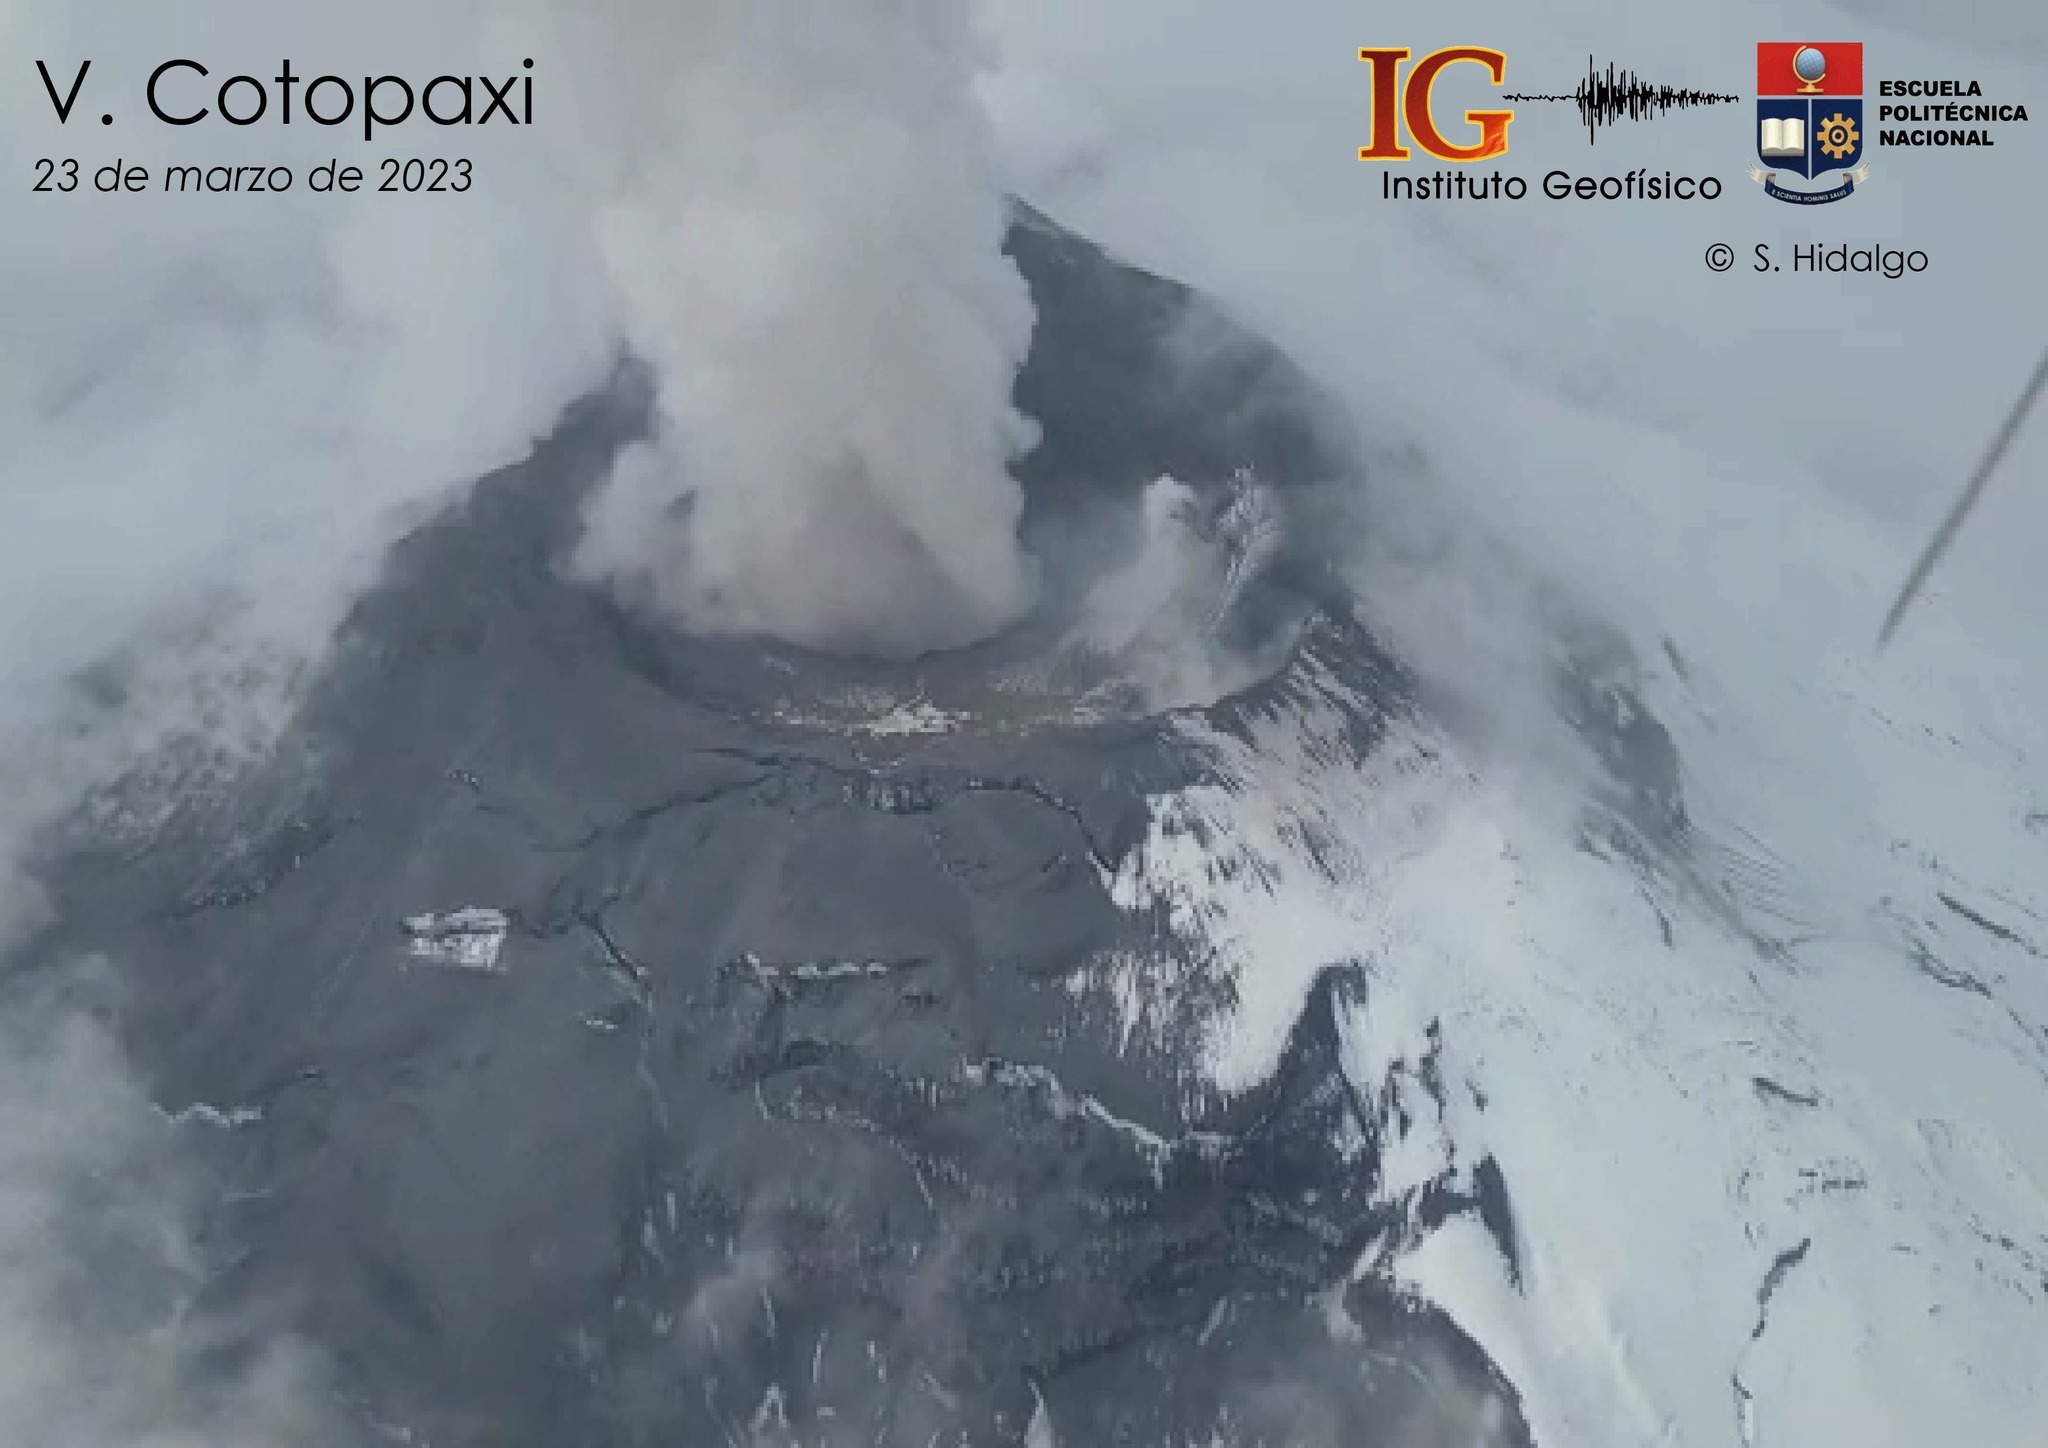
Ecuador , Cotopaxi :
Seismicity:
From February 19, 2023 to the date of issuance of this report, several seismic parameters showed a gradual decrease compared to previous months. Starting from the fact that the process of magmatic fragmentation that generates the emission of ash causes episodes of seismic tremors, the most obvious and clearest indication of a decrease in the internal activity of Cotopaxi is the progressive decrease in the seismic intensity recorded in recent weeks due to longer and longer periods of time without ash emission.
Current emissions consist mainly of gas and water vapor, which do not generate levels of seismic tremors comparable to ash emissions. There is therefore an overall decrease in the process of fragmentation at depth which results in the decrease in seismic tremor.
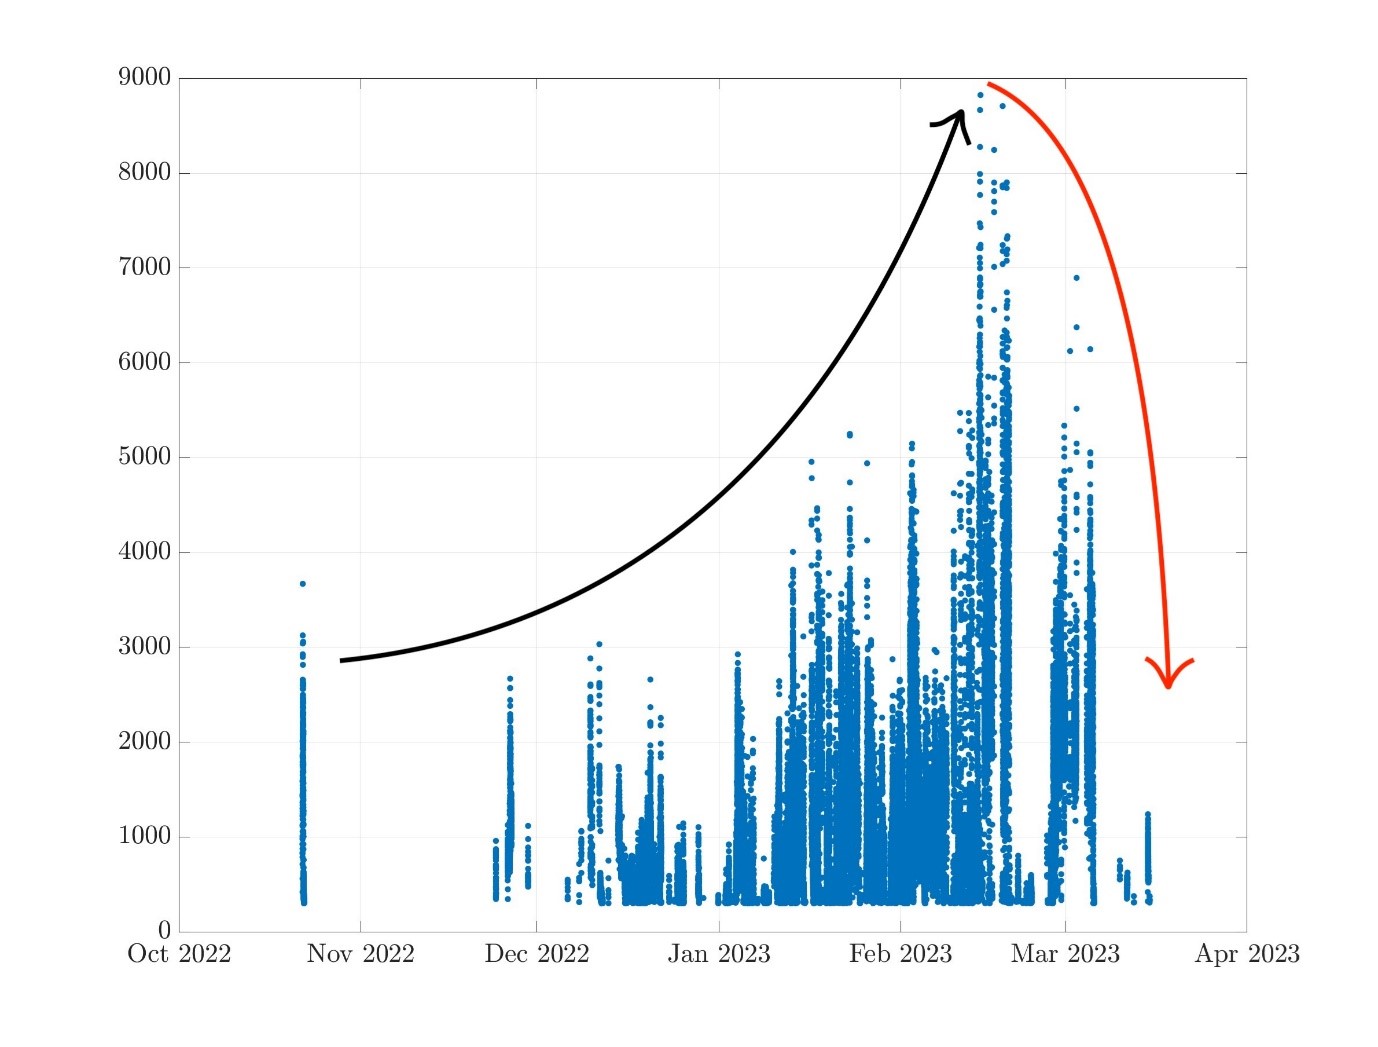
Seismic amplitude measured in nm/s, corrected for the distance to the source and averaged over all available stations of the seismic network. Note the increase it has had until February 2023 (black arrow) and the subsequent decrease so far (red arrow).
The daily number of LP, VT and VLP type earthquakes has also shown a decrease since mid-February. However, it is shown that the average magnitude of localized seismic events is the only one that remains at relatively high levels compared to the observed data from October 2022 to mid-January 2023. Although the average magnitudes and localized events do not show not the same obvious decrease observed in the tremor, the energetic contribution of these events was low compared to the periods when the seismic tremor was high. These two observations (decrease in seismic tremor and decrease in localizable event rates) coincide with a downward internal trend for moderate internal behavior.
Deformation:
Internal processes of the volcano, such as the entry of new magma into the system, produce increases in pressure and changes in stress states within the volcanic edifice. These phenomena are manifested at the superficial level by deformations of the ground, detectable by means of high-precision instruments.
However, during the month of February-March a change of trend in the deformation could be observed. The positioning data shows a stable rate (horizontal), indicating that the inflation process has stopped and a deflation process can begin.
Data interpretation
Based on the information available, it is concluded that the Cotopaxi volcano has a moderate level of eruptive activity with a downward trend. The joint analysis of the different monitoring parameters shows that the recent activity of Cotopaxi is caused by the presence of a small body of magma within the volcanic conduit, which is responsible for the SO2 and ash emissions reported during these five months of activity. So far, there is NO evidence showing a larger volume of magma entering the surface system. On the contrary, current evidence suggests that the Cotopaxi eruption is steadily decreasing in intensity.
Monitoring data indicate a gradual decrease in surface and internal activity of the volcano. Surface activity is characterized by the emission of columns of gas and ash between 500 and 1,000 meters above summit level, and with maximum values of 2,500 m between the months of February and March. Magmatic gases, particularly SO2, are abundant in the volcanic plume, but show a gradual decrease since February in both permanent instruments and satellite data. Internally, the seismicity continues to be dominated by LP and VLP type earthquakes and less and less energetic tremor episodes; while the deformation shows a stable trend, varying within a range of 2 mm since February this year.
Source : IGEPN.
Read the full article : https://www.igepn.edu.ec/
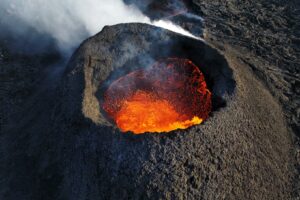
Hawaii , Kilauea :
Monday, March 27, 2023, 9:34 AM HST (Monday, March 27, 2023, 19:34 UTC)
19°25’16 » N 155°17’13 » W,
Summit Elevation 4091 ft (1247 m)
Current Volcano Alert Level: ADVISORY
Current Aviation Color Code: YELLOW
Activity Summary:
Kīlauea volcano is not erupting. The summit eruption of Kīlauea volcano, within Halemaʻumaʻu crater, remains paused. Lava is no longer flowing on the crater floor. Resumption of eruptive activity may occur in the near future with little or no warning. No significant changes have been observed along either of the volcano’s rift zones. Low rates of ground deformation and modest rates of seismicity continue across the volcano.
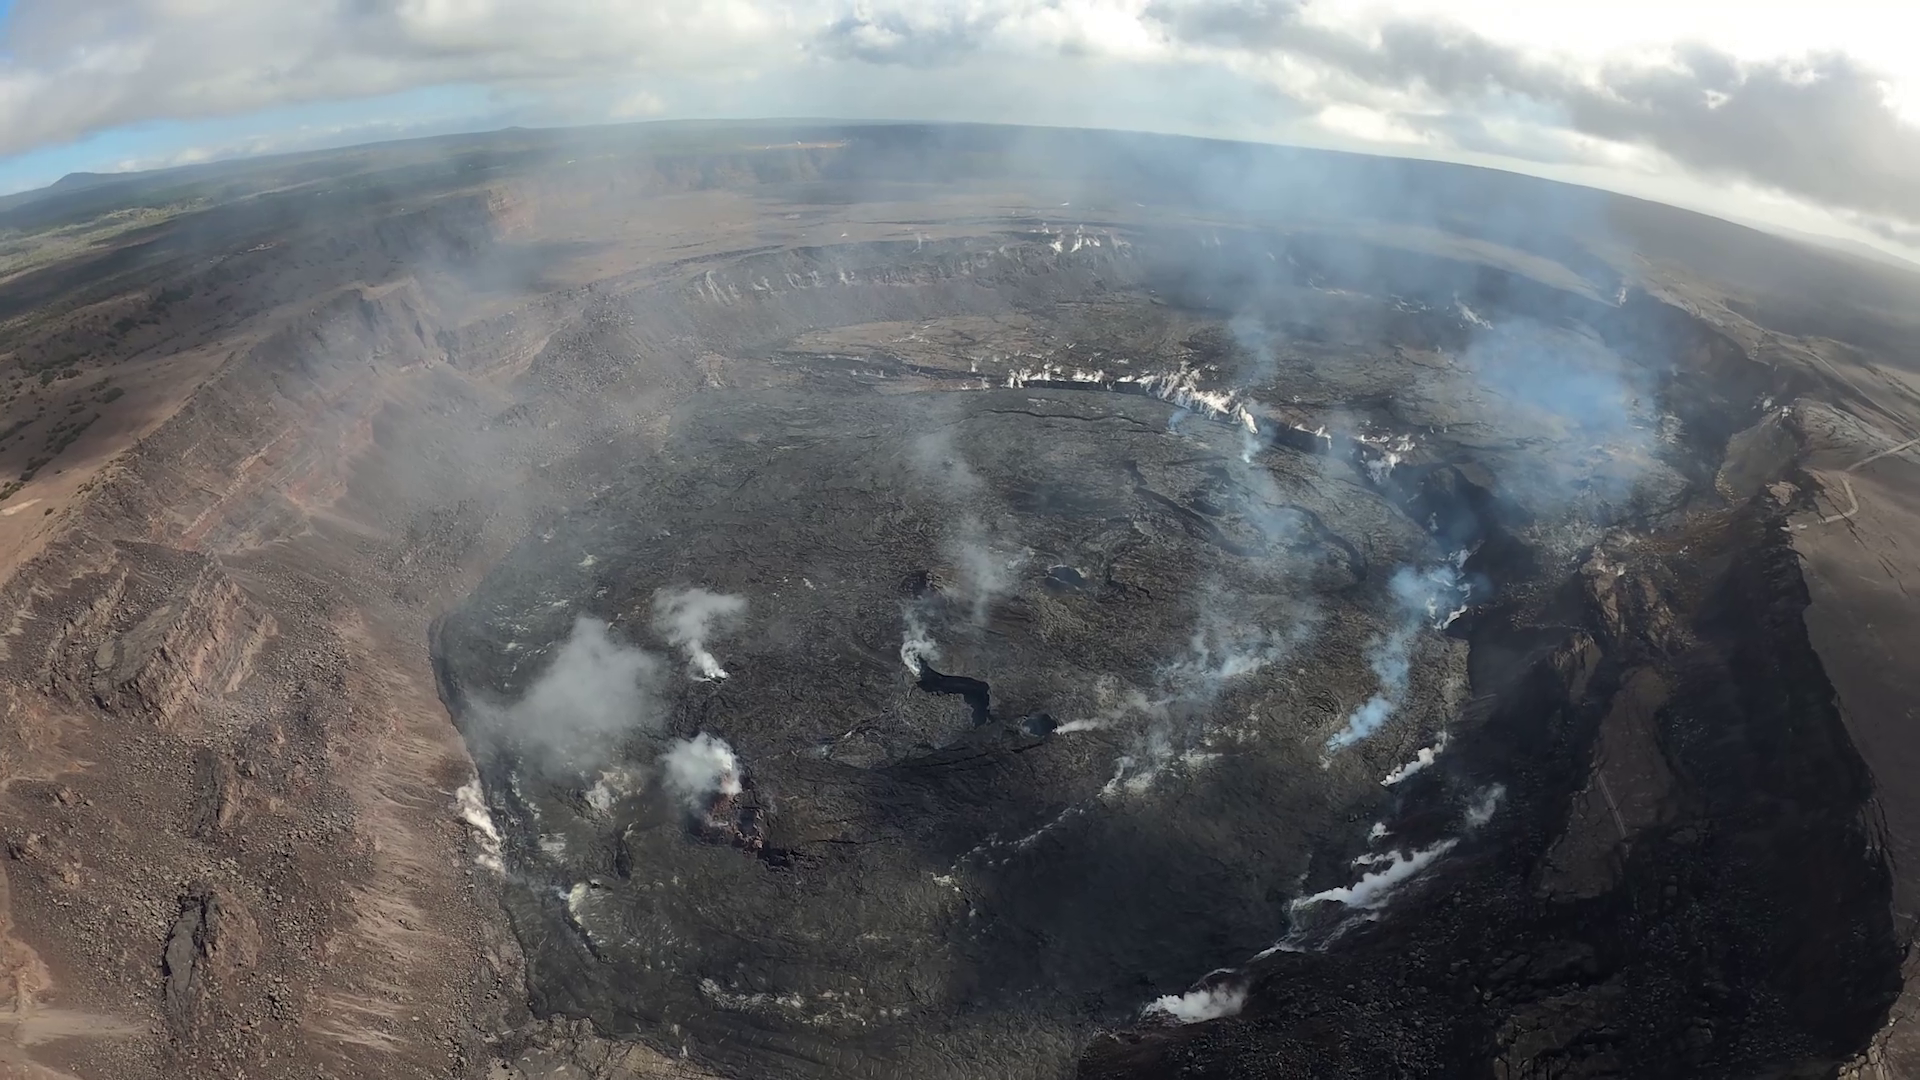
Halemaʻumaʻu crater Lava Lake Observations:
No active lava has been observed over the past 24 hours.
Summit Observations:
Uēkahuna tiltmeter is recording minor inflation at the summit as part of a DI event. Seismicity is at background levels. The last SO2 emission rate of approximately 321 tonnes per day (t/d) was measured on March 21.
Rift Zone Observations:
No unusual activity has been noted along the Rift Zones; steady rates of ground deformation and seismicity continue along both. Measurements from continuous gas monitoring stations in the middle East Rift Zone are below detection limits for SO2.
Source : HVO
Photo : USGS/ M. Patrick.
No comment yet, add your voice below!