
March 28 , 2021 .
Alaska , Semisopochnoi :
51°55’44 » N 179°35’52 » E,
Summit Elevation 2625 ft (800 m)
Current Volcano Alert Level: WATCH
Current Aviation Color Code: ORANGE
Unrest continues. Two explosions were detected on regional infrasound sensors over the past day at 06:30 and 09:30 UTC (21:30 on March 26 and 00:30 on March 27 HADT). High meteorological clouds (> 30,000 ft asl) were in the region during the time of these explosions and no ash cloud was observed rising above them in satellite data. Satellite observations of the volcano were obscured by clouds over the past day. No evidence of sulfur dioxide emissions was observed in satellite data yesterday afternoon. These small explosions are typical for the recent eruptive behavior at Semisopochnoi.
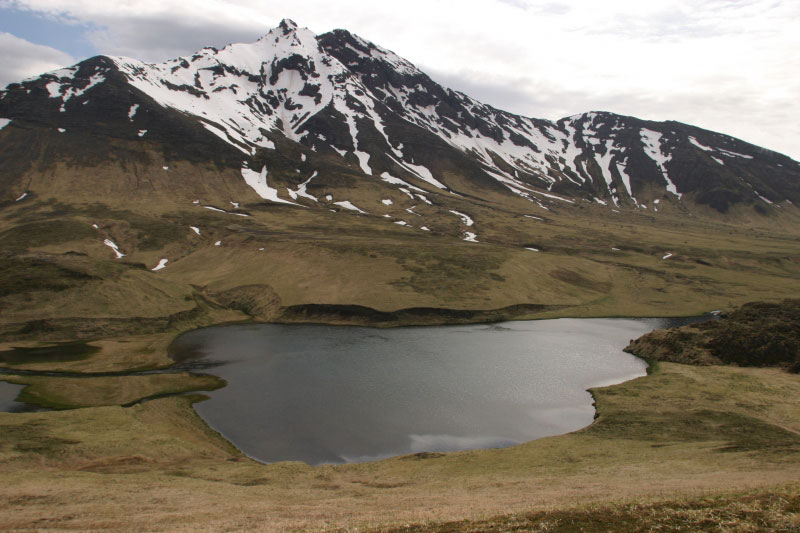
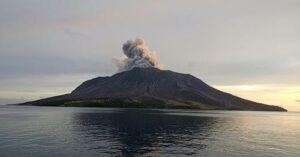
Semisopochnoi, view of Ragged Top from the west.
Semisopochnoi is monitored by satellite data, regional infrasound, and lightning detection instruments. An infrasound array on Adak Island may detect explosive emissions from Semisopochnoi with a slight delay (approximately 13 minutes) if atmospheric conditions permit.
Source : AVO.
Photo : Jones, Ian.
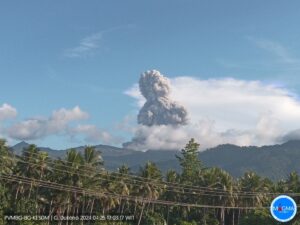
Indonesia , Sinabung :
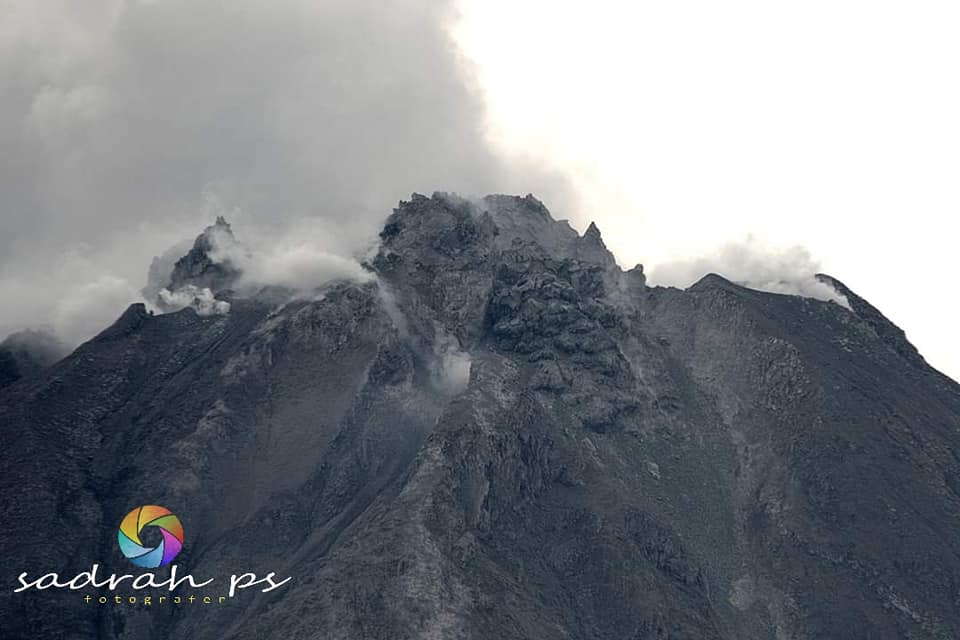
The activity level has been at level III (SIAGA) since May 20, 2019 at 10:00 a.m. WIB. Mount Api Sinabung (2460 m above sea level) has been erupting since 2013. The last eruption occurred on March 23, 2021 with a column height of 700 meters above the summit.
The volcano was clearly visible until it was covered in fog. We observe that the crater emits white smoke with a strong thickness, about 50-500 meters above the summit. The weather is sunny to cloudy, with light to moderate winds north, east, west and northwest.
According to the seismographs of March 27, 2021, it was recorded:
1 eruption / explosion earthquake
50 avalanche earthquakes
3 emissions earthquakes
28 hybrid / multi-phase earthquakes
1 local tectonic earthquake
5 distant tectonic earthquakes
Recommendation:
Communities and visitors / tourists should not conduct activities in villages that have been displaced, as well as within a radial radius of 3 km around the summit of Mount Sinabung, as well as a sector radius of 5 km for the sector. South-East, and 4 km for the North-East sector.
Source : PVMBG.
Photo : Sadrah PS.
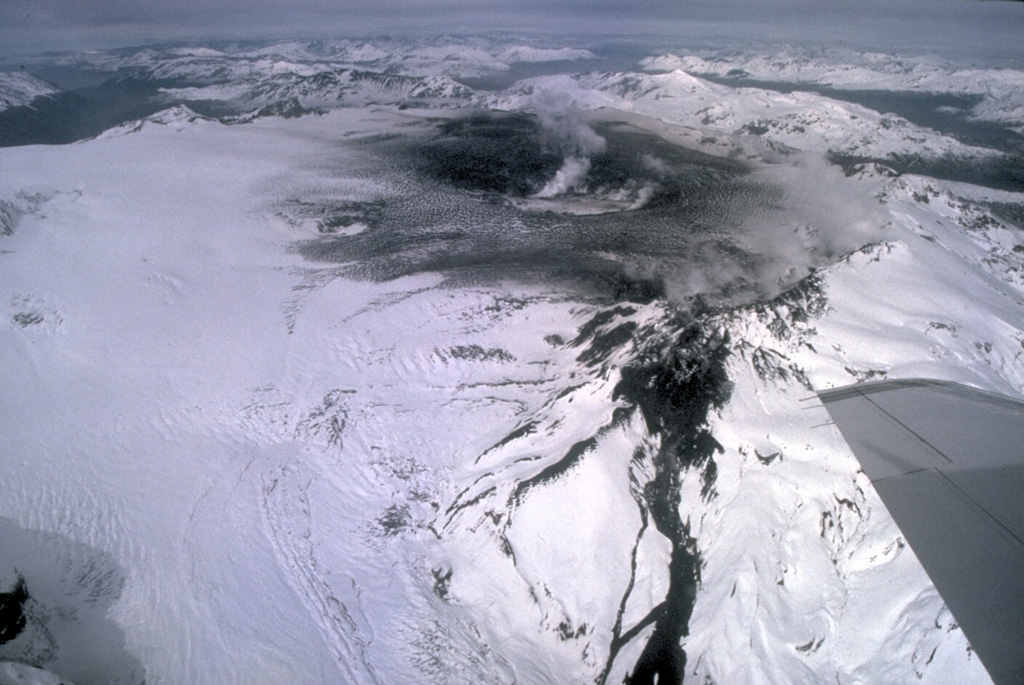
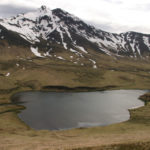
Chile / Argentina , Cerro Hudson :
For the period evaluated, the seismic activity associated with rock fracturing (VT) showed a slight increase in the number of events, while maintaining similar magnitudes compared to the previous fortnight.
The highest energy event had a local magnitude (ML) of 2.7 and was located 5.5 km south (S) of the caldera center with a depth of 4.6 km.
The seismic activity associated with the fluid dynamics inside the volcano (LP and HB types) showed similar levels to the previous period with regard to the number of events, but showed a decrease in its energy.
The data provided by the GNSS stations did not record any variations suggesting changes in the internal dynamics of the volcano.
No abnormal surface activity was recorded for the period evaluated.
The YELLOW technical alert level implies the appearance of changes in the behavior of the volcano’s activity.
Source : Segemar .
Photo : Norm Banks, (U.S. Geological Survey).
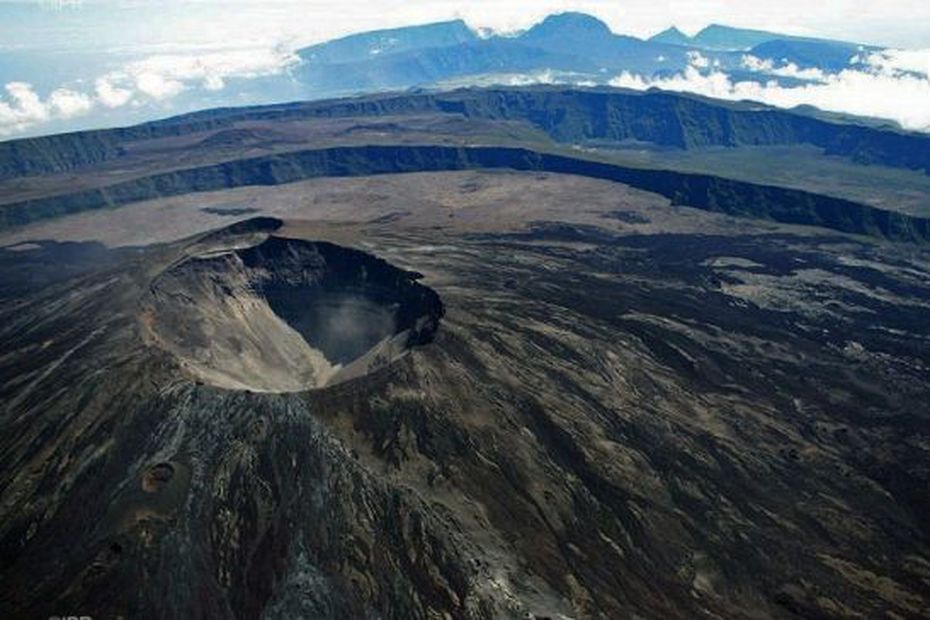
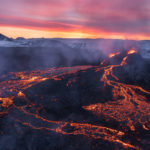
La Réunion , Piton de la Fournaise :
Preliminary activity bulletin of March 27, 2021.
Alert level: Vigilance.
Seismology
– Number of landslides on 03-27-2021: 1
Areas affected by landslides:
Summit cone
Enclos
Outside Enclos
– Number of volcano-tectonic earthquakes (VT) of 03-27-2021: 55
Zone affected by VT:
Summit cone
– Larger magnitude volcano-tectonic earthquake of 03-27-2021:
Length: 25.04 s
Magnitude of duration: 1.93.
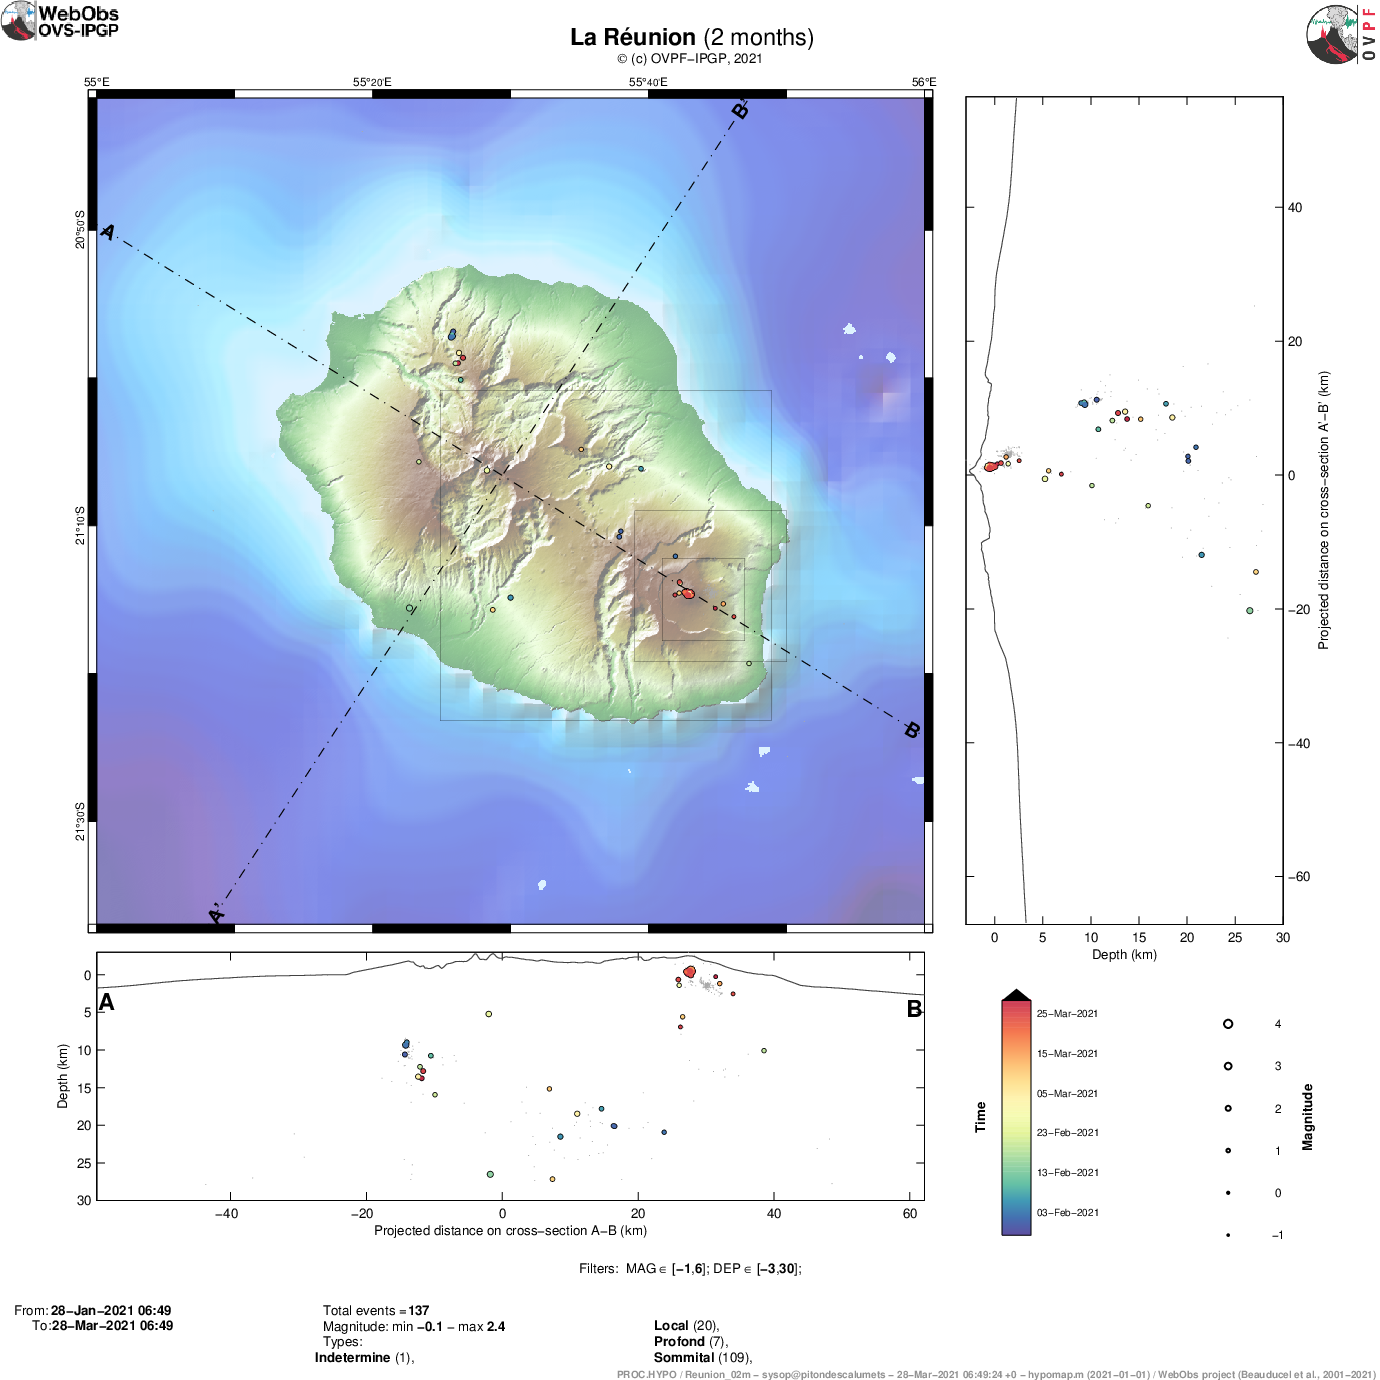
Location map (epicenters) and North-South and East-West sections (showing the location in depth, hypocenters) of the earthquakes recorded and located by the OVPF-IPGP over 2 months in Reunion Island. Only localizable earthquakes have been shown on the map.
The observatory records seismic events that are not shown on this map because they cannot be located, due to their too low magnitude.
To find out about the number of earthquakes detected by the observatory networks, you can refer to the latest Activity Bulletin.
Deformations
– The GPS of the summit area record inflation, witnessing the pressurization of a surface source.
– Far-field GPS record an inflation, witnessing the pressurization of a deep source.
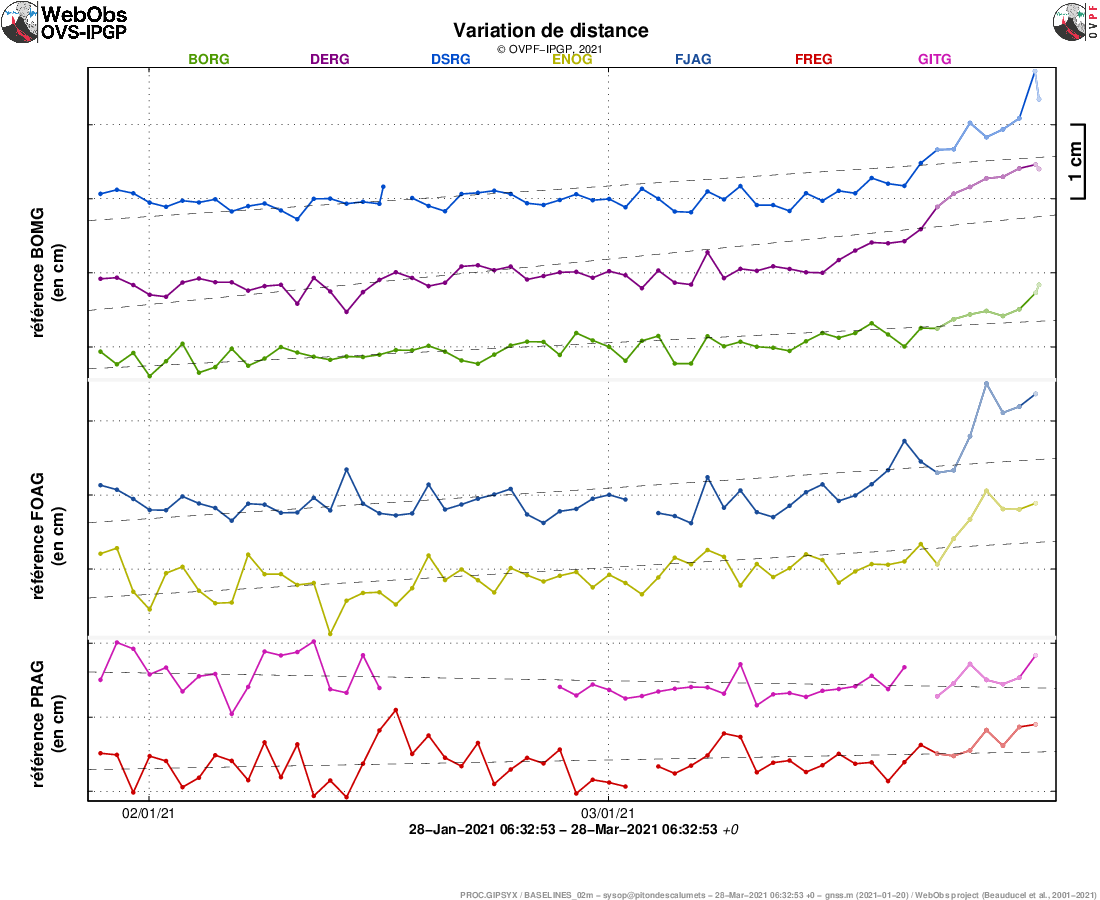
Illustration of the deformation over 2 months. The baselines (variation of distance between two GPS receivers) crossing the Piton de la Fournaise building, at the top (top), the base of the terminal cone (in the middle) and in the far field (bottom) are shown here. ) (see location on the associated maps). A rise is synonymous with elongation and therefore swelling of the volcano; conversely, a decrease is synonymous with contraction and therefore deflation of the volcano. Any periods colored in light pink correspond to eruptions.
Geochemistry
SO2 emissions at the top of the volcano: close to the detection threshold.
CO2 emissions from the ground: increasing throughout the network.
Source : OVPF.
Photo : Imaz Press
No comment yet, add your voice below!