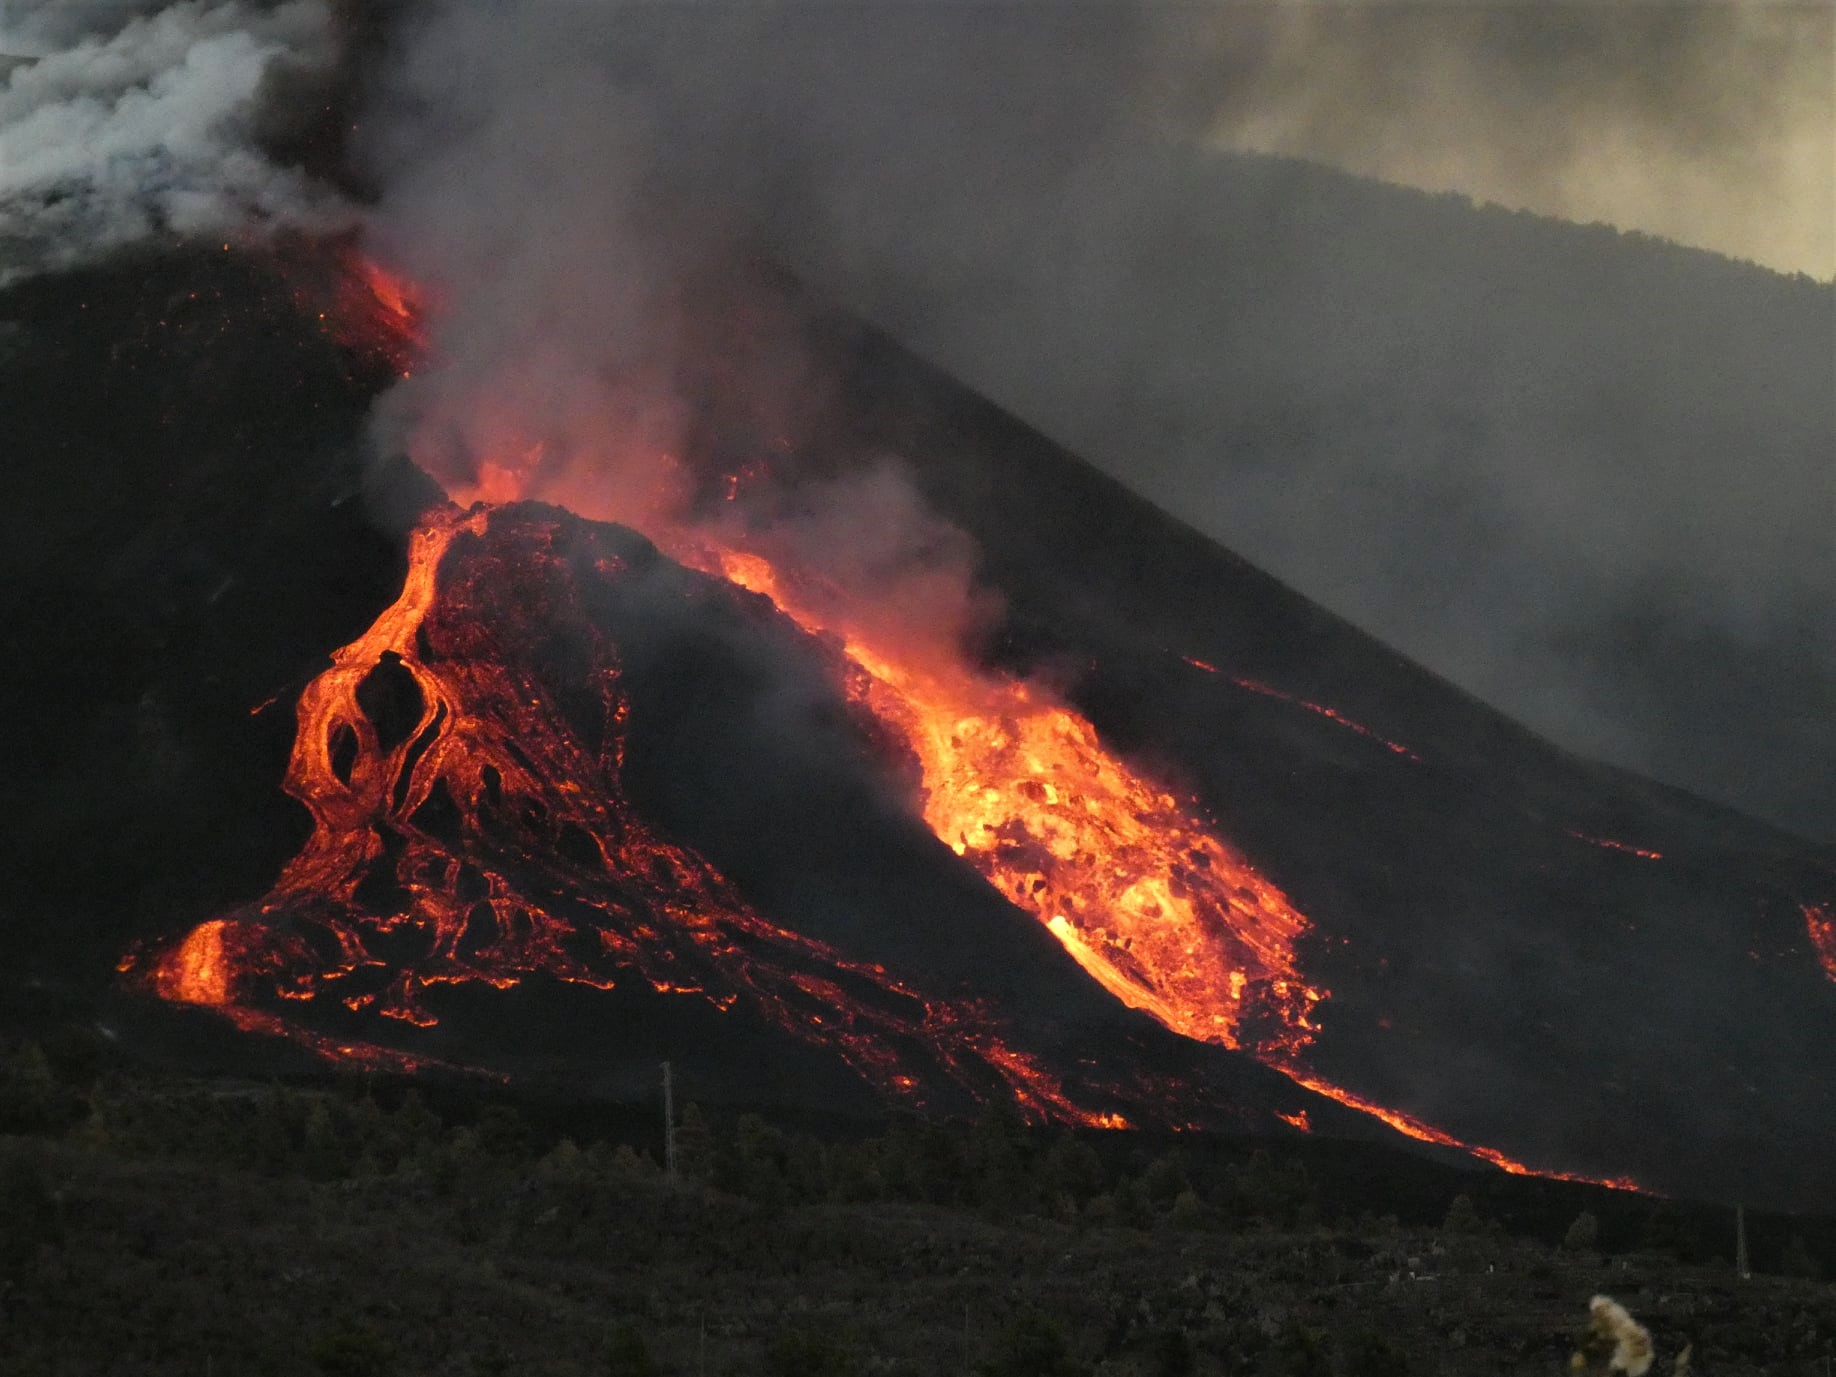
October 27, 2021. EN. Spain / La Palma : Cumbre Vieja , Indonesia : Ili Lewotolok , Chile / Argentina : Nevados de Chillan , Italy : Stromboli , Italy : Vulcano .

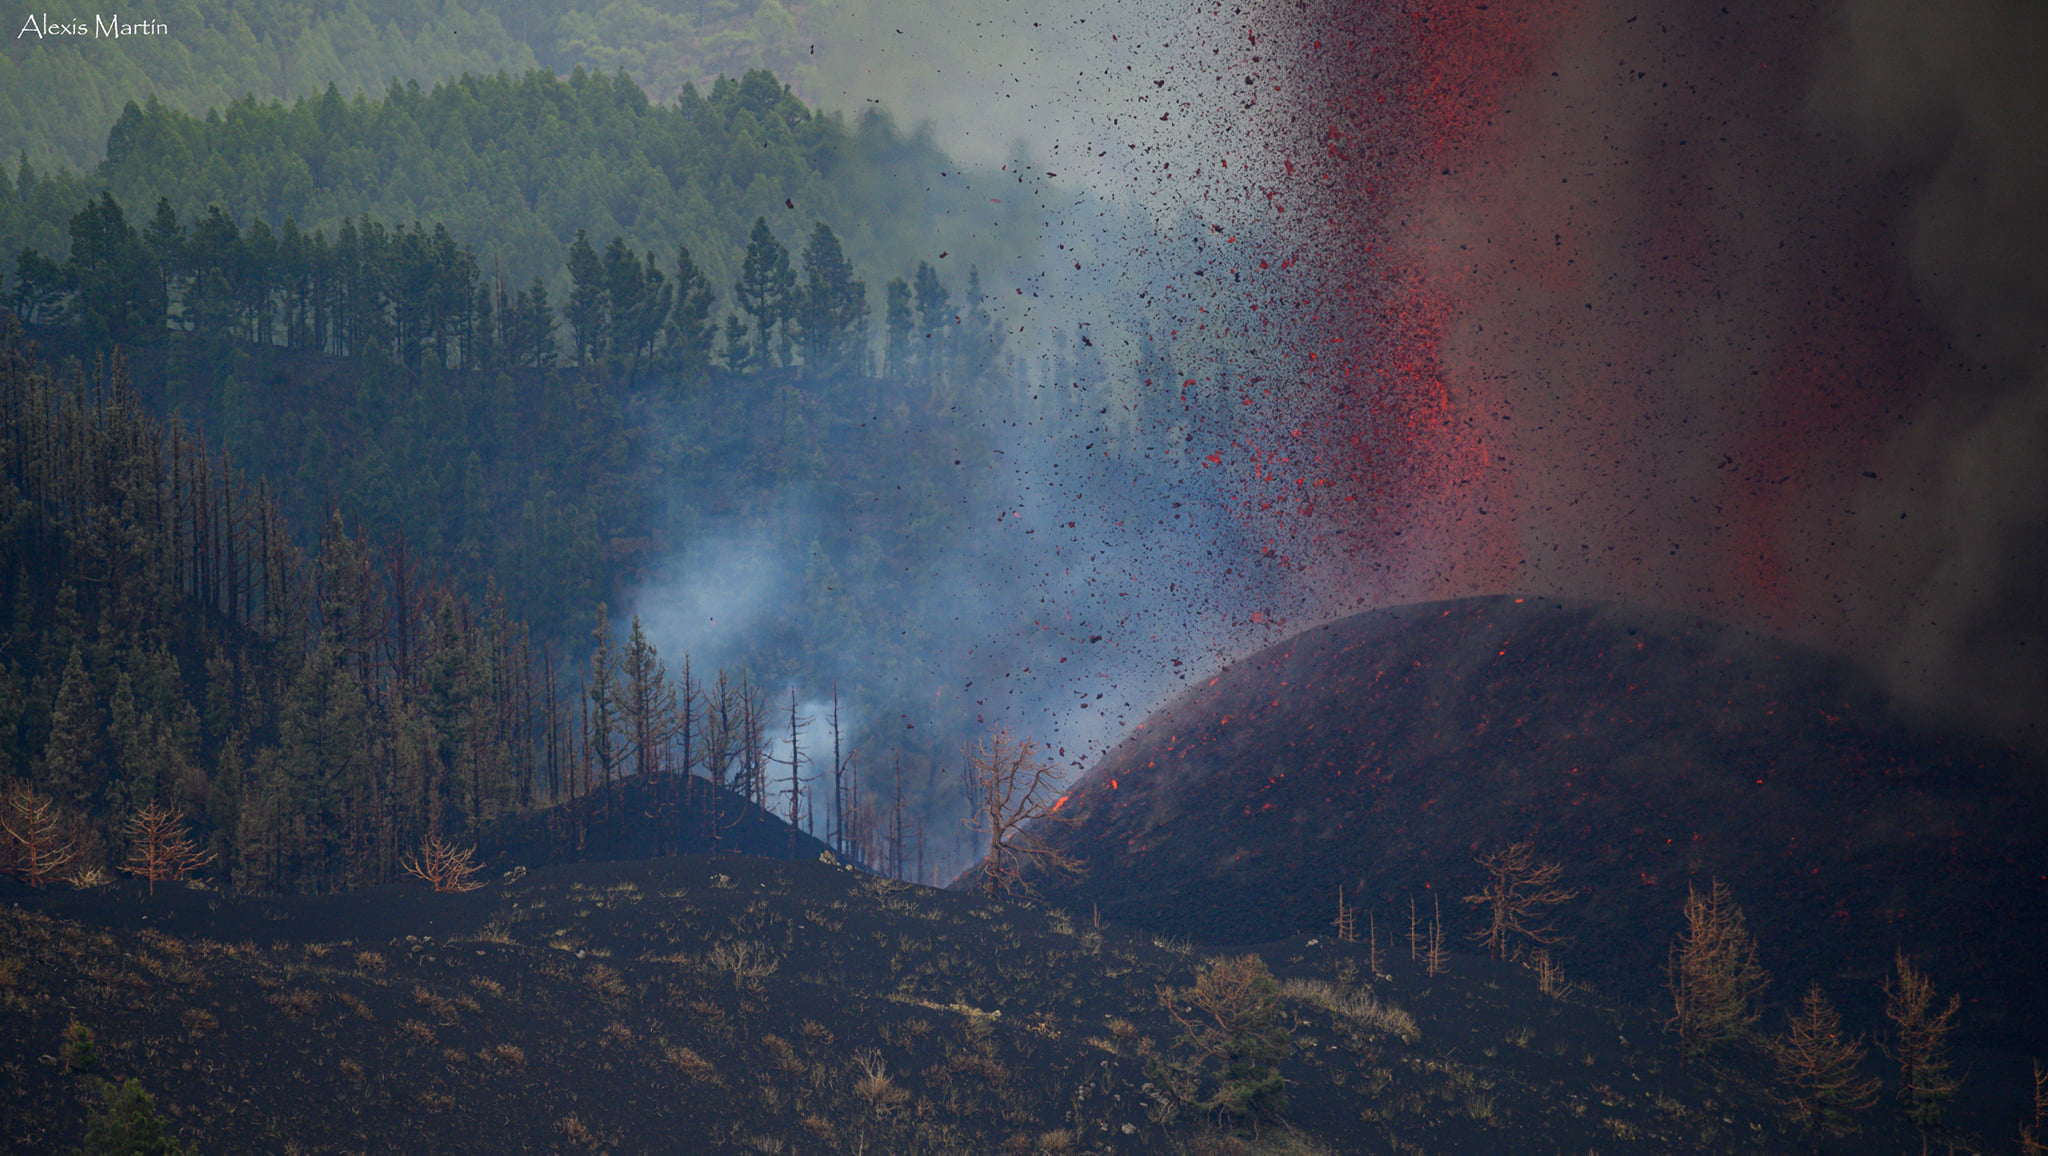
October 27 , 2021.


Spain / La Palma , Cumbre Vieja :

October 26, 2021, 08:00 UTC. Eruptive activity continues on La Palma.

Since the last declaration, 184 earthquakes have been located in the area affected by the volcanic reactivation of Cumbre Vieja, 17 of these earthquakes were felt by the population, the maximum intensity being in the epicentral zone IV (EMS98) for 4 earthquakes. Of all localized earthquakes, 80 have a magnitude equal to or greater than 3.0 mbLg.
The earthquake that occurred at 6:05 am (UTC) today was the largest (4.2 mbLg) during the reporting period.

Five earthquakes were located at depths of about 30 km, the rest of the hypocenters of the period are located at a shallower depth, about 12 km.
The amplitude of the volcanic tremor signal was maintained at high average levels, with intensifying pulses.

The emission cloud at 08:00 UTC reaches 2000 m.
The island’s network of permanent GNSS stations shows an elevation of more than 10 cm from yesterday and a southerly deformation at station LP03, which is closest to the eruptive centers.
On the other hand, at the most distant stations, a slight deflation is maintained, possibly linked to deep seismicity.

With the high daily emission rate of sulfur dioxide (SO2) and the strong tremors observed on the volcano of La Palma, what is clear says the volcanologist of the Sociological Center for Scientific Research (CSIC) Vicente Soler, it is that the eruption that began on September 19 « will not end tomorrow ». The volcano is still very active, said Vicente Soler, who commented that the collapse of part of the volcano’s crater that occurred on Sunday afternoon was « spectacular ».

He also referred to the seismicity at depth, which over the past night has been lower than in previous days, and noted that there were « ups and downs » in this regard. He pointed out that the high daily sulfur dioxide emission rate of over 5,000 tons is something that needs to be taken into account, because being so high means there is a large amount of magma growing in the shallow end of the volcano. Vicente Soler explained that sulfur dioxide comes from the shallower degassing of magma.

As for the tremor, which had a « high » on Sunday, he said it continues to rise from the previous 15 days. The tremor is « simply » the vibration produced by the magma which climbs the 2 or 3 kilometers in which it was stored before the eruption until it is evacuated, that is to say it This is the sound of the supply duct of the rash. Vicente Soler acknowledged that the ideal would be for there to be little seismicity and reiterated that with such a high rate of daily sulfur dioxide emission and with increasing tremors, the eruption will not end tomorrow. although there is little seismic movement.

The volcanologist from CSIC pointed out that the magma has in the volcano of La Palma the « open field » and is concerned that there will be strong earthquakes with the eruption in progress, because it means that something is wrong. not fully in phase with the eruption.

Images from the Canary Islands Volcanological Institute show another collapse in the cone of the Cumbre Vieja volcano, recorded around 6:50 p.m. Tuesday. The collapse occurred in the inner part of the cone, which collapsed on itself, momentarily blocking the lava outlet. The collapse follows the series of collapses that were recorded on Monday that led to the release of a large amount of lava, dragging large boulders with them. An hour after the collapse, the height of the lava fountain reached 600 meters, according to the Canary Islands Volcanological Institute. The technical director of Pevolca, Miguel Ángel Morcuende, communicated that on Tuesday afternoon there was an earthquake of magnitude 4.8 with epicenter in La Palma which was felt in other islands of the archipelago such than Tenerife and La Gomera. The earthquake occurred 34 kilometers below the surface and is part of the eruptive process that the island is experiencing.

Source : IGN es. El Pais .

Photos : TV Canarias , Micha Fürer.


Indonesia , Ili Lewotolok :

VOLCANO OBSERVATORY NOTICE FOR AVIATION – VONA

Issued : October 27 , 2021
Volcano : Ili Lewotolok (264230)
Current Aviation Colour Code : ORANGE
Previous Aviation Colour Code : orange
Source : Ili Lewotolok Volcano Observatory
Notice Number : 2021LEW53
Volcano Location : S 08 deg 16 min 19 sec E 123 deg 30 min 18 sec
Area : East Nusa Tenggara, Indonesia
Summit Elevation : 4554 FT (1423 M)

Volcanic Activity Summary :
Eruption with volcanic ash cloud at 03h25 UTC (11h25 local). Eruption and ash emission is not continuing.

Volcanic Cloud Height :
Best estimate of ash-cloud top is around 7754 FT (2423 M) above sea level, may be higher than what can be observed clearly. Source of height data: ground observer.

Other Volcanic Cloud Information :
Ash-cloud moving to West

Remarks :
Seismic activity is characterized by continuous volcanic tectonic earthquake

Level of activity at level III (SIAGA) since November 29, 2020 at 1:00 p.m. WITA.

The volcano was clearly visible until it was covered in fog. The smoke from the crater is white, gray / black with moderate to strong intensity, about 50-700 meters high from the summit. The eruption was accompanied by a low to moderate rumble and a low explosion sound. The weather is sunny to rainy, the wind is weak in the South-East and West. The air temperature is around 25-34.3 ° C.


According to the seismographs of October 26, 2021, it was recorded:
4 eruption / explosion earthquakes
32 earthquakes of emissions
9 harmonic tremors
104 non-harmonic tremors
1 hybrid earthquake
1 shallow volcanic earthquake
3 deep volcanic earthquakes
1 distant tectonic earthquake
4 Continuous tremors, amplitude 0.5-37 mm (predominantly 10 mm)

Sources : Magma Indonésie , PVMBG.

Photos :  @InfoBencan/twitter/volcanodiscovery , PVMBG ( archive).


Chile / Argentine , Nevados de Chillan :

The seismicity parameters associated with the fracturing processes of rigid materials (type VT) recorded a slight decrease, while the events associated with fluid dynamics (types LP and EX) recorded a slight increase compared to the previous fortnight in in terms of number of events and energy released. It should be noted that during this fortnight very long period signals (VLP type) and tremor pulses (TR) were recorded.

The highest energy VT event, with a local magnitude (ML) of 2.3, was located 1.0 km northeast (NNE) of the active crater and at a depth of 3.8 km.
From the analysis of the images provided by the surveillance cameras belonging to OVDAS as well as the satellite images, it was observed that the first lava flow « L7 » presents a channel located in the depression between the flows « L5 » and « L6 » with an adjacent lobe named « L7b ». The L7 flow was advancing at a speed of 1.5 m / h, with a length of 930 m. The second flow, called « L8 », flows next to the west of « L5 » reaching a speed of 0.2 m / h and a range of 280 m. In contrast, the L5 flow has not increased since September.

The explosive activity showed an evolution in the columns emitted from a whitish degassing towards a greyish color due to the higher content of pyroclasts, in turn presenting heights which for the most part did not exceed 400 m in height. However, an increase was observed compared to September with columns exceeding 1000 m, the maximum recorded event being that which occurred on October 9 with a height of 1620 m. Incandescence was observed throughout the reported period with a slight increase in intensity compared to the previous fortnight. Pyroclastic flows have not been recorded.

According to data obtained by the network of GNSS stations installed on the volcano, the low-magnitude inflationary process was maintained with maximum vertical deformation rates of 0.5 cm / month, accumulating a maximum of 1.4 cm / month . In turn, the surveillance lines and horizontal components remained stable. The inclinometer stations have remained stable and only with occasional changes caused by changes in environmental temperature.
34 thermal alerts were recorded in the area with a maximum value of 48 MW on October 7 and 9, considered moderate for this volcano. In turn, radiance anomalies were detected on October 2, 5, 7, 10, 12 and 15 from Sentinel 2-L2A image analysis.
The processing of thermal images made it possible to observe an increase in temperatures in the crater area, associated with both the explosions and the development of the L7 and L8 lava flows. During the explosive activity phase, it was possible to record temperatures exceeding the measurement range of the OVDAS chamber (above 360 ​​° C) on October 3, 7, 8, 9 and 10.

Source : Segemar 

Photos : Segemar , Josefauna .


Italy , Stromboli :

Weekly Bulletin, from October 18, 2021 to October 24, 2021 (issue date October 26, 2021)

SUMMARY STATEMENT OF ACTIVITY

In view of the monitoring data, it is highlighted:
1) VOLCANOLOGICAL OBSERVATIONS: During this period a normal explosive activity of strombolian type was observed. The total hourly frequency of explosions fluctuated between the average values (10-14 events / h) with the sole exception of October 22 with average-low values (7 events / h). The intensity of the explosions was low in the North crater area and variable from low to high in the Center-South area.

2) SEISMOLOGY: The seismological parameters monitored do not show significant variations.
3) DEFORMATIONS: The island’s soil deformation monitoring networks did not show any significant changes to report for the period under review.
4) GEOCHEMISTRY: The flow of SO2 at an average level
The flow of CO2 emitted by the ground at Pizzo Sopra la Fossa is at medium-high levels.
There is no update from the previous bulletin (C / S = 4.41).
5) SATELLITE OBSERVATIONS: The thermal activity in the summit area is at a low level.

VOLCANOLOGICAL OBSERVATIONS

In the observation period, the eruptive activity of Stromboli was characterized by the analysis of the images recorded by the surveillance cameras of the INGV-OE (altitude 190m, Punta
Corvi, altitude 400m and Pizzo). The explosive activity was mainly produced by 4 (four) eruptive vents located in the area of ​​the North crater and 5 (five) eruptive vents located in the area of ​​the
Center-South crater. All the vents are placed inside the depression which occupies the terrace of the crater (Fig. 3.1).

Fig. 3.1 – The crater terrace seen by the thermal camera placed on Pizzo sopra la Fossa with the delimitation of the zones of the crater, Center-South Zone and North Zone (ZONE N, ZONE C-S respectively). Abbreviations and arrows indicate the names and locations of active vents, the area above the crater terrace is divided into three height ranges relating to the intensity of the explosions.

The N1 crater located in the North zone, with three emission points, produced explosions of a generally low intensity (less than 80 m in height) emitting fine materials (ash) mixed with coarse materials (lapilli and bombs ). Vent N2 showed low intensity explosive activity (less than 80 m in height) emitting fine material mixed with coarse material. The average frequency of explosions varied from 4 to 8 events / h.
In the Center-South zone, sector S1 did not show any explosive activity, while the three vents located in sector S2 produced explosions, even simultaneously, of varying intensity from low to high (the products of some explosions exceeded 150 m in height) emitting coarse materials. Sector C did not show explosive activity emitting coarse materials with low intensity until October 23. The frequency of the explosions varied from 6 to 7 events / h.

Source : INGV.

Read the full article : https://www.ct.ingv.it/index.php/monitoraggio-e-sorveglianza/prodotti-del-monitoraggio/bollettini-settimanali-multidisciplinari/549-bollettino-settimanale-sul-monitoraggio-vulcanico-geochimico-e-sismico-del-vulcano-Stromboli20211026/file

Photos : Webcam , INGV.


Italy , Vulcano :

The temperature of the gases emitted by the fumaroles is one of the parameters measured as part of the geochemical monitoring activities of volcanoes (Figure 1). We have also discussed this in a previous article, describing the campaign of measures organized on Vulcano, following the change from the green alert level to the yellow alert level. On that day (October 12, 2021), a temperature of 344 ° C was detected. But is this temperature high or is it low? How far can the temperature of volcanic gases go?

Figure 1 – A moment of the fumarole monitoring campaign on the island of Vulcano, carried out in June 2021. Photograph by © Roberto Boccaccino.

The answer is: it depends. The temperature of a gas mixture depends on many factors related to the conditions of the volcanic system and the atmospheric conditions present at the time of the surface measurement (atmospheric pressure, rain).

The volcanic gases which feed the fumaroles are first dissolved in the magma, which can reach temperatures between 950 and 1200 ° C. If the conditions are suitable, the gases are released from the magma and rise up, filtering through the networks of pores and fractures, until they reach the surface. During this ascent, the gases expand, sometimes mix with more superficial fluids and, in general, cool. The extent of this cooling depends on the ease with which the gases reach the surface: when the magma that generates them is superficial and the fumarolic ducts are well developed, the temperatures observed at the mouths of the fumaroles can reach 800-900 ° C. Conversely, if the magma is deep or if the path that the gases must follow to reach the surface is long and winding, the temperature will be lower. The possible presence of groundwater can help cool the rising gases, stabilizing the temperature at the boiling value of water (100 ° C, at sea level). Even the appearance of heavy rains can significantly reduce the measured temperature, but in this case the variation is only temporary and the fumarole will tend to restore the values ​​measured before the meteoric event.

In the case of Vulcano Island, the La Fossa crater is home to numerous fumaroles, both on the northern edge and along the inner flanks (Figure 2). The temperature of the gases emitted is measured both periodically, as part of measurement campaigns, and continuously using instruments capable of acquiring measurements with an hourly frequency (Figure 3).

Each one reflects its own way to the surface and for this reason we observe different temperatures between one fumarole and another, with differences of up to 200 ° C. At the start of 2021, the temperatures recorded in different fumaroles ranged from a minimum of around 100 ° C to a maximum of about 360 ° C.

Figure 2 – La Fossa crater on Vulcano Island and the main fumarolic field as it appeared on September 29, 2021. Photograph by Marco Anzidei.

Figure 3 – Monitoring station for the continuous measurement of the temperature of the fumaroles. The station is installed on the northern edge of the crater and has been operational since 1989. The temperature of the fumaroles is monitored by the Palermo Section of the INGV. (Photo by Iole Serena Diliberto).

In addition, even for the same fumarole, the temperatures are not constant over time. Figure 4 compares, by way of example, the temperatures measured for two fumaroles found in the main fumarolic field, which is located on the northern edge of the crater of La Fossa. The F5AT fumarole reached temperatures above 500 ° C in 1996, while from 2013 it underwent a gradual cooling to a value of around 200 ° C in 2019. This cooling was interrupted during 2021.

Figure 4 – Temperature data from the time series of fumaroles located on the upper edge of the La Fossa cone. The measurements are carried out by the continuous monitoring network which records a measurement every hour. Temperature monitoring is provided by the Palermo section of the INGV (graph taken from the scientific article by Diliberto, 2021).

The observed variability becomes even more remarkable if the time interval considered is widened. Thanks to the observation and continuous study of these gaseous emissions for a long time, we have had measurements since the beginning of the 1900s (Figure 5) and this historical heritage of data shows us that the temperatures measured at the fumaroles of the crater have exceeded 600 ° C on several occasions: first in 1924 (615 ° C) then again in the early 1990s (650 ° C in 1991, 690 ° C in 1993).

Graph 6 – The fumarolic emissions from the crater cause a surface thermal anomaly that can be detected with an infrared thermal camera. The image refers to a survey carried out in 2014 (Figure taken from the scientific article by Silvestri et al., 2019).

Source : INGV.

Read the full article:  https://ingvvulcani.com/2021/10/26/quanto-sono-calde-le-fumarole-di-vulcano/?fbclid=IwAR1_h7pBqsChhKmVk1OsRKe4X8rM9XwWqoIjWHtVOcSITw6GZkfLBd-4khQ


27 Octobre 2021. FR. Espagne / La Palma : Cumbre Vieja , Indonésie : Ili Lewotolok , Chili / Argentine : Nevados de Chillan , Italie : Stromboli , Italie : Vulcano .

27 Octobre 2021.


Espagne / La Palma , Cumbre Vieja :

26 Octobre 2021 , 08:00 UTC. L’activité éruptive se poursuit sur La Palma.

Depuis la dernière déclaration, 184 tremblements de terre ont été localisés dans la zone touchée par la réactivation volcanique de Cumbre Vieja, 17 de ces tremblements de terre ont été ressentis par la population, l’intensité maximale étant dans la zone épicentrale IV (EMS98) pour 4 tremblements de terre. De tous les séismes localisés, 80 ont une magnitude égale ou supérieure à 3,0 mbLg.
Le séisme qui s’est produit à 6h05 (UTC) aujourd’hui était le plus important (4,2 mbLg) de la période considérée.

Cinq séismes ont été localisés à des profondeurs d’environ 30 km, le reste des hypocentres de la période sont situés à une profondeur plus faible, d’environ 12 km.
L’amplitude du signal de tremor volcanique s’est maintenue à des niveaux moyens élevés, avec des impulsions d’intensification.

Le nuage d’émission à 08h00 UTC atteint 2 000 m.
Le réseau de stations GNSS permanentes de l’île montre une élévation de plus de 10 cm par rapport à hier et une déformation vers le Sud à la station LP03, qui est la plus proche des centres éruptifs.
En revanche, aux stations les plus éloignées, une légère déflation est maintenue, éventuellement liée à une sismicité profonde.

Avec le taux quotidien élevé d’émission de dioxyde de soufre (SO2) et les fortes secousses observées sur le volcan de La Palma, ce qui est clair déclare le volcanologue du Centre sociologique de la recherche scientifique (CSIC) Vicente Soler, c’est que l’éruption qui a commencé le 19 septembre « ne se terminera pas demain ». Le volcan est toujours très actif, a déclaré Vicente Soler , qui a commenté que l’effondrement d’une partie du cratère du volcan qui s’est produit dans l’après-midi de dimanche était « spectaculaire ».

Il a également évoqué la sismicité en profondeur, qui au cours de la nuit écoulée a été inférieure à celle des jours précédents, et a souligné qu’il y avait des « hauts et des bas » à cet égard. Il a souligné que le taux quotidien élevé d’émission de dioxyde de soufre, supérieur à 5 000 tonnes, est quelque chose qui doit être pris en compte, car le fait qu’il soit si élevé signifie qu’il y a une grande quantité de magma poussant dans la partie peu profonde du volcan. Vicente Soler a expliqué que le dioxyde de soufre provient du dégazage moins profond du magma.

Quant au tremor, qui a eu dimanche un « high », il a indiqué qu’il continue d’augmenter par rapport à celui des 15 jours précédents. Le tremor est « simplement » la vibration produite par le magma qui grimpe les 2 ou 3 kilomètres dans lesquels il a été stocké avant l’éruption jusqu’à ce qu’il s’évacue, c’est-à-dire qu’il s’agit du bruit du conduit d’alimentation de l’éruption. Vicente Soler a reconnu que l’idéal serait qu’il y ait peu de sismicité et a réitéré qu’avec un taux aussi élevé d’émission quotidienne de dioxyde de soufre et avec la montée des secousses, l’éruption ne se terminera pas demain bien qu’il y ait peu de mouvements sismiques.

Le volcanologue du CSIC a souligné que le magma a dans le volcan de La Palma le « champ ouvert » et s’inquiète du fait qu’il y ait de forts séismes avec l’éruption en cours, car cela signifie que quelque chose n’entre pas complètement en phase avec l’éruption. 

Les images de l’Institut volcanologique des îles Canaries montrent un autre effondrement dans le cône du volcan Cumbre Vieja, enregistré vers 18h50 mardi. L’effondrement s’est produit dans la partie interne du cône, qui s’est effondrée sur elle-même en colmatant momentanément la sortie de lave. Cet effondrement fait suite à la série d’effondrements qui ont été enregistrés lundi et qui ont conduit à la sortie d’une grande quantité de lave, entraînant de gros blocs avec eux. Une heure après l’effondrement, la hauteur de la fontaine de lave atteint 600 mètres, selon l’Institut volcanologique des îles Canaries . Le directeur technique du Pevolca, Miguel Ángel Morcuende, a communiqué que mardi après-midi, il y a eu un tremblement de terre de magnitude 4,8 avec épicentre à La Palma qui a été ressenti dans d’autres îles de l’archipel telles que Tenerife et La Gomera. Le tremblement de terre a eu lieu à 34 kilomètres de profondeur et fait partie du processus éruptif que connaît l’île .

Source : IGN es. El Pais .

Photos : TV Canarias , Micha Fürer.


Indonésie , Ili Lewotolok :

AVIS D’OBSERVATION DU VOLCAN POUR L’AVIATION – VONA

Émis : 27 octobre 2021
Volcan : Ili Lewotolok (264230)
Code Couleur Aviation Actuel : ORANGE
Code Couleur Aviation précédent : orange
Source : Observatoire du volcan Ili Lewotolok
Numéro d’avis : 2021LEW53
Emplacement du volcan : S 08 deg 16 min 19 sec E 123 deg 30 min 18 sec
Zone : East Nusa Tenggara, Indonésie
Altitude du sommet : 4554 FT (1423 M).

Résumé de l’activité volcanique :
Eruption avec nuage de cendres volcaniques à 03h25 UTC (11h25 local). L’éruption et l’émission de cendres ne se poursuivent pas.

Hauteur des nuages volcaniques :
La meilleure estimation du sommet du nuage de cendres est d’environ 7754 FT (2423 M) au-dessus du niveau de la mer, peut être plus élevée que ce qui peut être clairement observé. Source des données de hauteur : observateur au sol.

Autres informations sur les nuages volcaniques :
Nuage de cendres se déplaçant vers l’Ouest

Remarques :
L’activité sismique est caractérisée par un séisme tectonique volcanique continu.

Niveau d’activité de Niveau III (SIAGA) depuis le 29 novembre 2020 à 13h00 WITA.

Le volcan était clairement visible jusqu’à ce qu’il soit recouvert de brouillard. La fumée issue du cratère est blanche, grise / noire avec une intensité modérée à forte, à environ 50-700 mètres de haut depuis le sommet. L’éruption s’est accompagnée d’un grondement faible à modéré et d’un faible bruit d’explosion. Le temps est ensoleillé à pluvieux, le vent est faible au Sud-Est et à l’Ouest. La température de l’air est d’environ 25-34,3°C.


Selon les sismographes du 26 octobre 2021, il a été enregistré :
4 tremblements de terre d’éruptions/explosions
32 tremblements de terre d’émissions
9 tremors harmoniques
104 tremors non harmoniques
1 tremblement de terre hybride
1 tremblement de terre volcanique peu profond
3 tremblements de terre volcaniques profonds
1 séisme tectonique lointain
4 Tremors continu, amplitude 0,5-37 mm (prédominance 10 mm)

Sources : Magma Indonésie , PVMBG.

Photos :  @InfoBencan/twitter/volcanodiscovery , PVMBG ( archive).


Chili / Argentine , Nevados de Chillan :

Les paramètres de sismicité associés aux processus de fracturation des matériaux rigides (type VT) ont enregistré une légère diminution, tandis que les événements associés à la dynamique des fluides (types LP et EX) ont enregistré une légère augmentation par rapport à la quinzaine précédente en termes de nombre d’événements et d’énergie libérée . Il est à noter que durant cette quinzaine des signaux de très longue période (type VLP) et des impulsions de tremor (TR) ont été enregistrés.


L’événement VT de plus haute énergie, avec une magnitude locale (ML) de 2,3, était situé à 1,0 km au Nord-Nord-Est (NNE) du cratère actif et à une profondeur de 3,8 km.
A partir de l’analyse des images fournies par les caméras de surveillance appartenant à OVDAS ainsi que des images satellites, il a été observé que la première coulée de lave « L7 » présente un canal situé dans la dépression entre les coulées « L5 » et « L6 » avec un lobe adjacent nommé « L7b ». La coulée L7 avançait à une vitesse de 1,5 m/h, avec une longueur de 930 m. La seconde coulée, appelée « L8 », coule à côté à l’Ouest de « L5 » atteignant une vitesse de 0,2 m/h et une portée de 280 m. En revanche, le flux L5 n’a pas progressé depuis septembre.

L’activité explosive a montré une évolution dans les colonnes émises d’un dégazage blanchâtre vers une couleur grisâtre en raison de la teneur plus élevée en pyroclastes, présentant à son tour des hauteurs qui pour la plupart ne dépassaient pas 400 m de hauteur. Cependant une augmentation a été observée par rapport au mois de septembre avec des colonnes dépassant les 1000 m, l’événement maximal enregistré étant celui qui s’est produit le 9 octobre avec une hauteur de 1620 m. Une incandescence a été observée tout au long de la période rapportée avec une légère augmentation d’intensité par rapport à la quinzaine précédente. Les coulées pyroclastiques n’ont pas été enregistrées.

Selon les données obtenues par le réseau de stations GNSS installées sur le volcan, le processus inflationniste de faible magnitude s’est maintenu avec des taux de déformation verticale maximale de 0,5 cm/mois, accumulant un maximum de 1,4 cm/mois. À leur tour, les lignes de surveillance et les composantes horizontales sont restées stables. Les stations inclinométriques sont restées stables et seulement avec des changements occasionnels causés par des changements de température environnementale.
 34 alertes thermiques ont été enregistrées dans la zone avec une valeur maximale de 48 MW les 7 et 9 octobre, considérée comme modérée pour ce volcan. À leur tour, des anomalies de radiance ont été détectées les 2, 5, 7, 10, 12 et 15 octobre à partir de l’analyse d’images Sentinel 2-L2A.
Le traitement des images thermiques a permis d’observer une augmentation des températures dans la zone du cratère, associée à la fois aux explosions et au développement des coulées de lave L7 et L8. Lors de la phase d’activité explosive, il a été possible d’enregistrer des températures dépassant la plage de mesure de la chambre OVDAS (supérieures à 360 °C) les 3, 7, 8, 9 et 10 octobre.

Source : Segemar 

Photos : Segemar , Josefauna .


Italie , Stromboli :

Bulletin Hebdomadaire , du 18 Octobre 2021 au 24 Octobre 2021. (date d’émission 26 Octobre 2021)

ÉTAT RÉSUMÉ DE L’ACTIVITÉ

Au vu des données de suivi, il est mis en évidence :
1) OBSERVATIONS VOLCANOLOGIQUES : Durant cette période une activité explosive normale de type strombolienne a été observée. La fréquence horaire totale des explosions a fluctué entre les valeurs moyennes (10-14 événements/h) à la seule exception du 22 octobre avec des valeurs moyennes-basses (7 événements/h). L’intensité des explosions était faible dans la zone du cratère Nord et variable de faible à élevée dans la zone Centre-Sud.

2) SISMOLOGIE : Les paramètres sismologiques suivis ne montrent pas de variations significatives.
3) DEFORMATIONS : Les réseaux de surveillance de la déformation des sols de l’île n’ont pas montré de changements significatifs à signaler pour la période sous revue.
4) GEOCHIMIE : Le flux de SO2 à un niveau moyen
Le flux de CO2 émis par le sol au Pizzo Sopra la Fossa est à des niveaux moyens-élevés.
Il n’y a pas de mise à jour par rapport au bulletin précédent (C/S = 4,41).
 5) OBSERVATIONS SATELLITES : L’activité thermique dans la zone sommitale est à un faible niveau.

OBSERVATIONS VOLCANOLOGIQUES

Dans la période d’observation, l’activité éruptive de Stromboli a été caractérisée par l’analyse des images enregistrées par les caméras de surveillance de l’INGV-OE (altitude 190m, Punta
Corvi, altitude 400m et Pizzo). L’activité explosive a été principalement produite par 4 (quatre) évents éruptifs situés dans la zone du cratère Nord et 5 (cinq) évents éruptifs situés dans la zone du
Cratère Centre-Sud. Toutes les bouches sont placées à l’intérieur de la dépression qui occupe la terrasse du cratère (Fig. 3.1).

Fig. 3.1 – La terrasse du cratère vue par la caméra thermique placée sur Pizzo sopra la Fossa avec la délimitation des zones du cratère Zone Centre-Sud et Zone Nord (ZONE N, ZONE C-S respectivement). Les abréviations et les flèches indiquent les noms et les emplacements des évents actifs, la zone au-dessus de la terrasse du cratère est divisée en trois plages de hauteur relatives à l’intensité des explosions.

Le cratère N1 situé dans la zone Nord, avec trois points d’émission, a produit des explosions d’une intensité généralement faible (moins de 80 m de hauteur) émettant des matériaux fins (cendres) mélangés à des matières grossières (lapilli et bombes). L’évent N2 a montré une activité explosive de faible intensité (moins de 80 m de hauteur) émettant des matières fine mélangée à  des matériaux grossiers. La fréquence moyenne des explosions variait de 4 à 8 événements/h.
Dans la zone Centre-Sud, le secteur S1 n’a pas montré d’activité explosive, tandis que les trois évents situés dans le secteur S2 ont produit des explosions, même simultanément, d’intensité variable de faible à élevée (les produits de certaines explosions dépassaient 150 m de hauteur) émettant des matériaux grossiers. Le secteur C n’ a montré une activité explosive émettant des matériaux grossiers avec une faible intensité que le 23 octobre. La fréquence des explosions variait de 6 à 7 événements/h.

Source : INGV.

Lire l’articlehttps://www.ct.ingv.it/index.php/monitoraggio-e-sorveglianza/prodotti-del-monitoraggio/bollettini-settimanali-multidisciplinari/549-bollettino-settimanale-sul-monitoraggio-vulcanico-geochimico-e-sismico-del-vulcano-Stromboli20211026/file

Photos : Webcam , INGV.


Italie , Vulcano :

La température des gaz émis par les fumerolles est l’un des paramètres mesurés dans le cadre des activités de surveillance géochimique des volcans (Figure 1). Nous en avons également parlé dans un article précédent, décrivant la campagne de mesures organisée sur Vulcano, suite au passage du niveau d’alerte vert au niveau d’alerte jaune. Ce jour-là (12 octobre 2021), une température de 344°C a été détectée. Mais cette température est-elle élevée ou est-elle basse? Jusqu’où peut aller la température des gaz volcaniques ?


Figure 1 – Un moment de la campagne de surveillance des fumeroles sur l’île de Vulcano, menée en juin 2021. Photographie de © Roberto Boccaccino.

La réponse est : cela dépend. La température d’un mélange gazeux dépend de nombreux facteurs liés aux conditions du système volcanique et aux conditions atmosphériques présentes au moment de la mesure en surface (pression atmosphérique, pluie).

Les gaz volcaniques qui alimentent les fumerolles sont d’abord dissous dans le magma, qui peut atteindre des températures comprises entre 950 et 1200 ° C. Si les conditions sont appropriées, les gaz sont libérés du magma et remontent, filtrant à travers les réseaux de pores et de fractures, jusqu’à ce qu’ils atteignent la surface. Au cours de cette ascension, les gaz se dilatent, se mélangent parfois à des fluides plus superficiels et, en général, refroidissent. L’étendue de ce refroidissement dépend de la facilité avec laquelle les gaz atteignent la surface: lorsque le magma qui les génère est superficiel et que les conduits fumeroliens sont bien développés, les températures observées à l’embouchure des fumerolles peuvent atteindre 800-900 ° C. Inversement, si le magma est profond ou si le chemin que les gaz doivent suivre pour atteindre la surface est long et sinueux, la température sera plus basse. La présence possible d’eau souterraine peut aider à refroidir les gaz ascendants, stabilisant la température à la valeur d’ébullition de l’eau (100 ° C, au niveau de la mer). Même l’apparition de fortes pluies peut réduire considérablement la température mesurée, mais dans ce cas, la variation n’est que temporaire et la fumerole aura tendance à rétablir les valeurs mesurées avant l’événement météorique.

Dans le cas de l’île Vulcano, le cratère La Fossa abrite de nombreuses fumerolles, tant sur le bord Nord que le long des flancs intérieurs (Figure 2). La température des gaz émis est mesurée à la fois périodiquement, dans le cadre de campagnes de mesure, et en continu grâce à des instruments capables d’acquérir des mesures avec une fréquence horaire (Figure 3).

Chacun réfléchit son propre chemin vers la surface et pour cette raison, nous observons différentes températures entre une fumerole et une autre, avec des différences pouvant atteindre 200 ° C. Début 2021, les températures enregistrées dans différentes fumerolles allaient d’un minimum d’environ 100°C à un maximum d’environ 360°C.

Figure 2 – Le cratère La Fossa, sur l’île de Vulcano et le champ fumerolien principal tel qu’il est apparu le 29 septembre 2021. Photographie de Marco Anzidei.

Figure 3 – Station de surveillance pour la mesure en continu de la température des fumerolles. La station est installée sur le bord Nord du cratère et est opérationnelle depuis 1989. La surveillance de la température des fumerolles est assurée par la Section Palerme de l’INGV. (Photo par Iole Serena Diliberto).

De plus, même pour une même fumerolle, les températures ne sont pas constantes dans le temps. La figure 4 compare, à titre d’exemple, les températures mesurées pour deux fumerolles trouvées dans le champ fumerolien principal, qui est situé sur le bord Nord du cratère de La Fossa. La fumerolle F5AT a atteint des températures supérieures à 500°C en 1996, alors qu’à partir de 2013 elle a subi un refroidissement progressif jusqu’à une valeur d’environ 200°C en 2019. Ce refroidissement a été interrompu courant 2021.

Figure 4 – Données de température de la série chronologique de fumerolles situées sur le bord supérieur du cône de La Fossa. Les mesures sont effectuées par le réseau de surveillance continue qui enregistre une mesure toutes les heures. La surveillance de la température est assurée par la section Palerme de l’INGV (graphique tiré de l’article scientifique de Diliberto, 2021).

La variabilité observée devient encore plus remarquable si l’intervalle de temps considéré est élargi. Grâce à l’observation et à l’étude continue de ces émissions gazeuses depuis longtemps, nous avons eu des mesures depuis le début des années 1900 (Figure 5) et ce patrimoine historique de données nous montre que les températures mesurées aux fumerolles du cratère ont dépassé à plusieurs reprises 600°C : d’abord en 1924 (615°C) puis à nouveau au début des années 90 (650°C en 1991, 690°C en 1993).

Graphique 6 – Les émissions fumeroliennes du cratère entraînent une anomalie thermique de surface qui peut être détectée avec une caméra thermique infrarouge. L’image fait référence à une enquête réalisée en 2014 (Figure tirée de l’article scientifique de Silvestri et al., 2019).

Source : INGV.

Lire l’article en entier https://ingvvulcani.com/2021/10/26/quanto-sono-calde-le-fumarole-di-vulcano/?fbclid=IwAR1_h7pBqsChhKmVk1OsRKe4X8rM9XwWqoIjWHtVOcSITw6GZkfLBd-4khQ


September 28, 2021. EN. Spain / La Palma : Cumbre Vieja , Peru : Sabancaya , Alaska : Pavlof , New Zealand : Ruapehu , Chile / Argentina : Nevados de Chillan .

September 28 , 2021.


Spain / La Palma , Cumbre Vieja :

September 27, 2021, 11:00 UTC.

Eruptive activity continues on La Palma.
Since the last press release and until 24 hours yesterday, September 26, there was little seismicity in the eruptive zone, with a single localized earthquake, at 21:03 UTC of magnitude 2.5 (mbLg). Throughout this morning, between 4:00 a.m. and 7:00 a.m. UTC, a seismic swarm occurred in the area with 16 earthquakes located between 7 and 14 km deep.

The largest earthquake occurred at 06:05 UTC with a magnitude of 3.2 (mbLg). The value of the average amplitude of the volcanic tremor remained around the average values during the day yesterday and began to increase sharply from 21:00. It reached a maximum value at 00:00 today and from that time until 9:00 a.m. it dropped sharply, coinciding with the observations of a decrease in surface flow.

The network of permanent GNSS stations on the island shows a slight deflation in the vertical of LP03 and to a lesser extent in that of LP04. These results are compatible with those obtained using InSAR, in which no significant variation is observed between the Sentinel1 images of September 20 and 26.

This morning, due to the decrease in the emission of ash into the atmosphere, the IGN issued a VONA (Volcano Observatory Notice for Aviation) communicating this decrease and the decrease in the maximum height reached by the eruptive column in the different impulses. This VONA was sent, in accordance with the protocols of the International Civil Aviation, to the VAAC (Volcanic Ash Advisory Center) of Toulouse, to the ACC Canarias (Area Control Center) and to the AEMET (State Meteorological Agency).

IGN continues to monitor activity, having strengthened its presence on the island, where the CAVE (Center for Attention and Monitoring of Eruptions) has been established and works daily to collect samples of volcanic material for analysis. in situ and posterior.


The National Geographical Institute has confirmed that the volcano is currently exhibiting « pulses of columns of smoke and gas.

The agency also detected 16 earthquakes in the northern area of ​​Fuencaliente, south of the volcano. The most intense was located at 6:05 am and at a depth of 10 kilometers, and in general all are above magnitude two and at depths between 9 and 13 kilometers.

This increase in seismicity may be due to the readjustment of the host rock in which the pocket of magma that flows from the new volcano is located or it may also be linked to the injection of new magma.

The volcano expelled some 46.3 million cubic meters of material

“The fissure eruption continues to show the same Strombolian mechanism since its inception as the one that focuses on the main cone. The process will continue to show pulses with increased volcanic activity and although there was a period when the Strombolian explosions ceased in the cone, it can happen again suddenly ”, explained Maria José Blanco, director of the Geophysical Center of Canaries, belonging to the National Geographic Institute (IGN).

The estimated total volume of material emitted in the streams and in the cone is approximately 46.3 million cubic meters. “The changes observed over the past few hours in the visible behavior of the rash may be related to a change in the conduit that feeds this emission. Blanco explained that the ash cloud will move south-east of the emitting center and could affect the area between La Palma, La Gomera and Tenerife in the coming days.

“There are two castings left. The southern one has very low speeds and the northern one was divided into two arms by the mountain of Todoque. Whoever goes north has found a less steep slope and has slowed down, and reconnects with the southward arm moving at a higher speed because it is in a hollow, ”Blanco detailed.

28/09: The lava flow that advances on Todoque towards the coast is already about 1,200 meters from the sea, according to government sources in the Canary Islands. Late Monday afternoon, a new flow of volcanic material came out of the main cone and descends above the previous flows with more speed, being more fluid. The Cumbre Vieja volcano again increased its explosions and lava emissions in the afternoon after several hours of relative inactivity, the National Geographic Institute (IGN) confirmed. In the morning there had been a brief halt in activity, during which the emission of lava, smoke and ash ceased. The management of the Canary Islands Volcanic Risk Prevention Plan (Pevolca) on Sunday evening ordered the containment of around 300 people from four neighborhoods in the municipality of Tazacorte if the lava ever reached the sea.

Source : IGN , El Pais.

Photos : Alexis Martin / Involcan , Volker Hildebrand , Nacho González Oramas Fotógrafo .

Carte : Copernicus .


Peru , Sabancaya :

Analysis period: September 20, 2021 to September 26, 2021, Arequipa, September 27, 2021.
Alert level: ORANGE

The Geophysical Institute of Peru (IGP) reports that the eruptive activity of the Sabancaya volcano remains at moderate levels, that is to say with the recording of an average of 29 daily explosions, with columns of ash and gas up to 2 km altitude above the summit of the volcano and their consequent dispersion. Therefore, for the following days, no significant change is expected in eruptive activity.

The IGP recorded and analyzed the occurrence of 1,067 earthquakes of volcanic origin, associated with the circulation of magmatic fluids within the Sabancaya volcano. An average of 29 explosions was recorded daily. During this period, Volcano-Tectonic (VT) earthquakes associated with rock fractures were located mainly in the North-East and East of Sabancaya and presented magnitudes between M2.0 and M4 , 5.

The monitoring of the deformation of the volcanic structure using GNSS techniques (processed with fast orbits) does not present any significant anomalies. However, in general, an inflation process was observed in the northern sector (around the Hualca Hualca volcano). Visual surveillance made it possible to identify columns of gas and ash up to 2 km altitude above the summit of the volcano, which were scattered towards the South, South-East, East, North-West, South – sectors. West and North-East of Sabancaya. Satellite recordings identified the presence of 1 thermal anomalies (maximum value of 3 MW) associated with the presence of a lava body on the surface of the volcano’s crater.

RECOMMENDATIONS
• Keep the volcanic alert level in orange.
• Do not approach within a radius of 12 km from the crater.

Source : IGP.

Photo : Martin Rietze.


Alaska , Pavlof :

55°25’2″ N 161°53’37 » W,
Summit Elevation 8261 ft (2518 m)
Current Volcano Alert Level: WATCH
Current Aviation Color Code: ORANGE

Seismicity has remained elevated over the past day with small explosions detected in infrasound data last night at 20:16 ADKT (04:16 UTC) and this morning at 07:16 AKDT (15:16 UTC). A small ash emission was observed in the web camera imagery at 16:01 AKDT yesterday (September 27, 00:01 UTC). No activity was observed in partly cloudy satellite imagery.

Small explosions accompanied by low-level ash emissions could happen at any time, and are typically a hazard in the immediate vicinity of the summit. The level of unrest at Pavlof can change quickly and the progression to more significant eruptive activity can occur with little or no warning.

Pavlof Volcano is monitored by local seismic and infrasound sensors, satellite data, web cameras, and remote infrasound and lightning networks.

Source : AVO.

Photo : Ben David Jacob.


New Zealand , Ruapehu :

Mt Ruapehu status update: Crater Lake (Te Wai ā-moe) now cooling
Published: Tue Sep 28 2021 9:30 AM

Volcanic Alert Level remains at 1
Aviation Colour Code remains at Green
Another heating phase has passed at Mt Ruapehu. Over the last two months the temperature of Crater Lake (Te Wai ā-moe) rose from 20 °C to 39.5 °C, peaking on 4 September 2021, and has now cooled to 28 °C. The Volcanic Alert Level at Mt Ruapehu remains at Level 1.
Typically, over periods of months, Ruapehu’s Crater Lake (Te Wai ā-moe) undergoes heating and cooling cycles.

In late December 2020 the lake heated to 43 °C marking the high point of that cycle. Later in April of 2021 a 2nd cycle reached a maximum of 41 °C. The latest cycle is the third this year and the heating phase lasted from early July to early September 2021, during which the temperature rose from 20 °C to 39 °C.
The temperature of Ruapehu Crater Lake (Te Wai ā-moe) is now cooling

During the heating cycle the lake colour changed to a darker grey, from a blue-green colour. This is typical as sediments on the lake floor are disturbed during the influx of hot fluids and are suspended in the lake water.
The modelled heat flow into the lake has now dropped from 350-400 MW at the peak of the heating to around 200 MW (megawatt).
The lake is currently not overflowing into the Whangaehu river.

Routine monitoring at Mt Ruapehu includes gas measurement flights and Crater Lake (Te Wai ā-moe) water sampling.

The results from these visits and of our continuous monitoring of volcanic earthquake activity, tremor levels, and lake temperature and water level indicate that key monitoring parameters remain within normal ranges.

The Volcanic Alert Level stays at Level 1 which reflects the current level of volcanic unrest. The Volcanic Alert Level should not be used to forecast future activity.

The Aviation Colour Code remains at colour Green.

Mt Ruapehu is an active volcano and has the potential to erupt with little or no warning when in a state of volcanic unrest.

Volcanic Alert Level 1 indicates the primary hazards are those expected during volcanic unrest: steam discharge, volcanic gas, earthquakes, landslides and hydrothermal activity. While Volcanic Alert Level 1 is mostly associated with environmental hazards, eruptions can still occur with little or no warning.

GNS Science and the National Geohazards Monitoring Centre continue to closely monitor Mt Ruapehu for further changes.

Source : Geonet / Craig Miller / / Duty Volcanologist.

Photos : Bradd Scott , Geonet , Photovolcanica .


Chile / Argentina , Nevados de Chillan :

The seismicity parameters associated with the fracturing processes of rigid materials (type VT) remained at similar values ​​compared to the previous period, while the events related to fluid dynamics (type LP, TR and EX) recorded a decrease in the amount and energy released, though, showing an intensification towards the end of the fortnight. It should be noted that during this fortnight there were harmonic tremor signals.
The highest energy VT-type event, with a local magnitude (ML) of 2.4, was located 4.3 km east-southeast (ESE) of the active crater and at a depth of 4 , 9 km.
From the analysis of the images provided by the surveillance cameras belonging to OVDAS as well as the satellite images, it can be seen that the advance of the L5 and L6 flows was practically zero, with slight variations observed at the beginning of the fortnight. The absence of recording of abnormal thermal radiance observed in the L5 and L6 flows shows their surface cooling. In turn, the location of a third lava dome stands out, which was located in the active crater towards the end of the period assessed in this report.

The explosive activity featured maximum column heights of 1060 m. When the weather conditions allowed it and during the beginning of the fortnight, it was possible to record columns of moderate height with a high pyroclast load. Towards the end of the analysis period, predominantly whitish columns were observed, highlighting the occurrence of isolated explosions with a strong load of brown pyroclastic material coming from the center of the crater. A pyroclastic flow was identified on September 3 in a northeast direction and with a range of 550 m. It was possible to record a low intensity incandescence during the night.

According to data obtained by the network of GNSS stations installed on the volcano, the low-magnitude inflationary process is maintained with maximum vertical deformation rates of 0.9 cm / month. The tracking baselines and horizontal components also recorded this process with slight changes in their behavior. The inclinometric stations remained stable except for changes due to climatic conditions.

Seven (7) thermal alerts were recorded in the area with a maximum value of 2 MW on September 15, considered low for this volcano. In turn, radiance anomalies were detected on September 10 and 15 from Sentinel 2-L2A image analysis.
Thermal imaging has observed maximum temperatures of 290 ° C in the emission zone during explosions and 60 ° C for the L5 and L6 lava flows.

Source : Segemar.

Photos : Cesar Lara Cancino , Segemar .


28 Septembre 2021. FR. Espagne / La Palma : Cumbre Vieja , Pérou : Sabancaya , Alaska : Pavlof , Nouvelle Zélande : Ruapehu , Chili / Argentine : Nevados de Chillan .

28 Septembre 2021.


Espagne / La Palma , Cumbre Vieja :

27 Septembre 2021 , 11h00 UTC.

L’activité éruptive se poursuit sur La Palma.
Depuis le dernier communiqué et jusqu’à 24 heures hier 26 septembre, il y a eu peu de sismicité dans la zone éruptive, avec un seul séisme localisé ,à 21h03 UTC de magnitude 2,5 (mbLg). Tout au long de cette matinée, entre 4h00 et 7h00 UTC, un essaim sismique a eu lieu dans la zone avec 16 séismes situés entre 7 et 14 km de profondeur.

Le plus grand séisme s’est produit à 06h05 UTC avec une magnitude de 3,2 (mbLg). La valeur de l’amplitude moyenne du tremor volcanique est restée autour des valeurs moyennes durant la journée d’hier et a commencé à augmenter fortement à partir de 21h00. Il a atteint une valeur maximale à 00h00 aujourd’hui et à partir de ce moment jusqu’à 9h00 du matin, il a fortement chuté, coïncidant avec les observations d’une diminution du débit de surface.

Le réseau de stations GNSS permanentes de l’île montre une légère déflation dans la verticale de LP03 et dans une moindre mesure dans celle de LP04. Ces résultats sont compatibles avec ceux obtenus à l’aide d’InSAR, dans lesquels aucune variation significative n’est observée entre les images Sentinel1 des 20 et 26 septembre.

Ce matin, en raison de la diminution de l’émission de cendres dans l’atmosphère, l’IGN a émis un VONA (Volcano Observatory Notice for Aviation) communiquant cette diminution et la diminution de la hauteur maximale atteinte par la colonne éruptive dans les différentes impulsions. Ce VONA a été envoyé, conformément aux protocoles de l’Aviation Civile Internationale, au VAAC (Volcanic Ash Advisory Center) de Toulouse, à l’ACC Canarias (Area Control Center) et à l’AEMET (State Meteorological Agency).

L’IGN continue de surveiller l’activité, ayant renforcé sa présence sur l’île, où le CAVE (Centre d’Attention et de Surveillance des Eruptions) a été implanté et travaille quotidiennement à la collecte d’échantillons de matériel volcanique pour analyse in situ et postérieure.


L’Institut géographique national a confirmé que le volcan présente actuellement « des impulsions de colonnes de fumée et de gaz.

L’agence a également détecté 16 tremblements de terre dans la zone Nord de Fuencaliente, au Sud du volcan. Le plus intense a été localisé à 06h05 et à une profondeur de 10 kilomètres, et en général, tous sont au-dessus de la magnitude deux et à des profondeurs comprises entre 9 et 13 kilomètres.

Cette augmentation de la sismicité peut être due au réajustement de la roche encaissante dans laquelle se trouve la poche de magma qui s’écoule du nouveau volcan ou elle peut également être liée à l’injection de nouveau magma .  

Le volcan a expulsé quelque 46,3 millions de mètres cubes de matériaux

« L’éruption fissurale continue de montrer le même mécanisme strombolien depuis sa création que celui qui se concentre sur le cône principal. Le processus continuera à montrer des impulsions avec une activité volcanique accrue et bien qu’il y ait eu une période où les explosions stromboliennes ont cessé dans le cône, cela peut se reproduire brusquement », a expliqué Maria José Blanco, directrice du Centre géophysique des Canaries, appartenant à l’Institut géographique national (IGN).

L’estimation du volume total de matières émises en coulées et dans le cône est d’environ 46,3 millions de mètres cubes. « Les changements observés au cours des dernières heures dans le comportement visible de l’éruption peuvent être liés à un changement dans le conduit qui alimente cette émission. » Blanco a expliqué que le nuage de cendres se déplacera vers le Sud-Est du centre émetteur et pourrait affecter la zone entre La Palma, La Gomera et Tenerife dans les prochains jours.

« Il reste deux coulées. Celle du Sud a des vitesses très basses et celle du Nord a été divisée en deux bras par la montagne de Todoque. Celui qui va dans le Nord a trouvé une pente moins importante et a ralenti,  et se reconnecte avec le bras qui va vers le Sud qui avance à une vitesse plus élevée parce qu’il est dans un creux », a détaillé Blanco.

28/09 : La coulée de lave qui avance sur Todoque en direction de la côte se trouve déjà à environ 1200 mètres de la mer, selon des sources gouvernementales des Canaries. Lundi en fin d’après-midi, un nouveau flux de matière volcanique est sorti du cône principal et descend au-dessus des coulées précédentes avec plus de vitesse, étant plus fluide. Le volcan de Cumbre Vieja a de nouveau augmenté ses explosions et ses émissions de lave dans l’après-midi après plusieurs heures d’inactivité relative, a confirmé l’Institut géographique national (IGN). Dans la matinée, il y avait eu un bref arrêt de l’activité, au cours duquel l’émission de lave, de fumée et de cendres a cessé. La direction du Plan de prévention des risques volcaniques des Canaries (Pevolca) a ordonné dimanche soir le confinement d’environ 300 personnes de quatre quartiers de la municipalité de Tazacorte si jamais la lave atteignait la mer.

Source : IGN , El Pais.

Photos : Alexis Martin / Involcan , Volker Hildebrand , Nacho González Oramas Fotógrafo .

Carte : Copernicus .


Pérou , Sabancaya :

Période d’analyse: du 20 Septembre 2021 au 26 Septembre 2021 , Arequipa, 27 Septembre 2021.
Niveau d’alerte: ORANGE

L’Institut géophysique du Pérou (IGP) rapporte que l’activité éruptive du volcan Sabancaya reste à des niveaux modérés, c’est-à-dire avec l’enregistrement d’une moyenne de 29 explosions quotidiennes , avec des colonnes de cendres et de gaz jusqu’à 2 km d’altitude au dessus du sommet du volcan et leur dispersion consécutives . Par conséquent, pour les jours suivants, aucun changement significatif n’est attendu concernant l’ activité éruptive.


L’IGP a enregistré et analysé l’occurrence de 1067 tremblements de terre d’origine volcanique, associés à la circulation de fluides magmatiques à l’intérieur du volcan Sabancaya. Une moyenne de 29 explosions a été enregistrée quotidiennement . Au cours de cette période, les tremblements de terre de type Volcano-Tectoniques (VT) associés à des fracturations rocheuses ont été localisés principalement dans le Nord-Est et l’Est du Sabancaya et ont présenté des magnitudes comprises entre M2,0 et M4,5. 

Le suivi de la déformation de la structure volcanique à l’aide de techniques GNSS (traitées avec des orbites rapides) ne présente pas d’anomalies significatives. Cependant, de manière générale, un processus d’inflation a été observé dans le secteur  Nord ( environs du volcan Hualca Hualca ). La surveillance visuelle a permis d’identifier des colonnes de gaz et de cendres jusqu’à 2  km d’altitude au dessus du sommet du volcan , qui étaient dispersées vers les secteurs Sud , Sud-Est ,  Est , Nord- Ouest , Sud – Ouest et Nord- Est du Sabancaya.  Les enregistrements par satellites ont identifiés la présence de 1 anomalies thermiques ( valeur maximale de 3 MW ) associées à la présence d’un corps de lave à la superficie du cratère du volcan  . 

RECOMMANDATIONS
• Garder le niveau d’alerte volcanique en orange.
• Ne pas s’ approcher dans un rayon de moins de 12 km du cratère.

Source : IGP.

Photo : Martin Rietze.


Alaska , Pavlof :

55°25’2″ N 161°53’37 » O,
Altitude du sommet : 8261 pi (2518 m)
Niveau d’alerte volcan actuel : ATTENTION
Code couleur aviation actuel : ORANGE

La sismicité est restée élevée au cours de la dernière journée avec de petites explosions détectées dans les données infrasons la nuit dernière à 20h16 ADKT (04h16 UTC) et ce matin à 07h16 AKDT (15h16 UTC). Une petite émission de cendres a été observée dans les images de la caméra Web à 16h01 AKDT hier (27 septembre à 00h01 UTC). Aucune activité n’a été observée sur les images satellites partiellement nuageuses.

De petites explosions accompagnées d’émissions de cendres de faible niveau peuvent se produire à tout moment et constituent généralement un danger à proximité immédiate du sommet. Le niveau d’agitation du Pavlof peut changer rapidement et la progression vers une activité éruptive plus importante peut se produire avec peu ou pas d’avertissement.

Le volcan Pavlof est surveillé par des capteurs sismiques et infrasons locaux, des données satellitaires, des caméras Web et des réseaux distants de capteurs d’infrasons et de foudre.

Source : AVO.

Photo : Ben David Jacob.


Nouvelle Zélande , Ruapehu :

Mise à jour du statut d’activité du mont Ruapehu : le lac du cratère (Te Wai ā-moe) se refroidit maintenant
Publié: mar. 28 sept. 2021 09:30

Le niveau d’alerte volcanique reste à 1
Le code couleur de l’aviation reste au vert
Une autre phase de chauffage est passée sur le mont Ruapehu. Au cours des deux derniers mois, la température du lac du cratère (Te Wai ā-moe) est passée de 20 °C à 39,5 °C, culminant le 4 septembre 2021, et s’est maintenant refroidie à 28 °C. Le niveau d’alerte volcanique au mont Ruapehu reste au niveau 1.
En règle générale, sur des périodes de plusieurs mois, le lac du cratère du Ruapehu (Te Wai ā-moe) subit des cycles de chauffage et de refroidissement.

Fin décembre 2020, le lac s’est réchauffé à 43 °C, marquant le point culminant de ce cycle. Plus tard en avril 2021, un 2e cycle a atteint un maximum de 41 °C. Le dernier cycle est le troisième cette année et la phase de chauffe a duré de début juillet à début septembre 2021, durant laquelle la température est passée de 20 °C à 39 °C.
La température du lac du cratère Ruapehu (Te Wai ā-moe) se refroidit maintenant.

Pendant le cycle de chauffage, la couleur du lac est passée à un gris plus foncé, passant par une couleur bleu-vert. Ceci est typique car les sédiments au fond du lac sont perturbés lors de l’afflux de fluides chauds et sont en suspension dans l’eau du lac.
Le flux de chaleur modélisé dans le lac est maintenant passé de 350 à 400 MW au pic du chauffage à environ 200 MW (mégawatt).
Le lac ne déborde actuellement pas dans la rivière Whangaehu.

La surveillance de routine du mont Ruapehu comprend des vols de mesure de gaz et un échantillonnage de l’eau du lac Crater (Te Wai ā-moe).

Les résultats de ces visites et de notre surveillance continue de l’activité sismique volcanique, des niveaux de tremors, de la température du lac et du niveau d’eau indiquent que les principaux paramètres de surveillance restent dans les limites normales.

Le niveau d’alerte volcanique reste au niveau 1, ce qui reflète le niveau actuel de troubles volcaniques. Le niveau d’alerte volcanique ne doit pas être utilisé pour prévoir une activité future.

Le code de couleur de l’aviation reste à la couleur verte.

Le mont Ruapehu est un volcan actif et a le potentiel d’entrer en éruption avec peu ou pas d’avertissement lorsqu’il est dans un état d’agitation volcanique.

Le niveau d’alerte volcanique 1 indique que les principaux dangers sont ceux attendus pendant les troubles volcaniques : décharges de vapeur, gaz volcaniques, tremblements de terre, glissements de terrain et activité hydrothermale. Bien que le niveau d’alerte volcanique 1 soit principalement associé à des dangers environnementaux, des éruptions peuvent toujours se produire avec peu ou pas d’avertissement.

Le GNS Science et le Centre national de surveillance des géorisques continuent de surveiller de près le mont Ruapehu pour d’autres changements.

Source : Geonet / Craig Miller / Volcanologue de service.

Photos : Bradd Scott , Geonet , Photovolcanica .


Chili / Argentine , Nevados de Chillan :

Les paramètres de sismicité associés aux processus de fracturation des matériaux rigides (type VT) sont restés à des valeurs similaires par rapport à la période précédente, tandis que les événements liés à la dynamique des fluides (type LP, TR et EX) ont enregistré une diminution de la quantité et de l’énergie libérée, bien que, présentant une intensification vers la fin de la quinzaine. Il est à noter que durant cette quinzaine il y a eu des signaux de tremor harmoniques.
L’événement de type VT de plus haute énergie, avec une magnitude locale (ML) de 2,4, était situé à 4,3 km à l’Est-Sud-Est (ESE) du cratère actif et à une profondeur de 4,9 km.
A partir de l’analyse des images fournies par les caméras de surveillance appartenant à OVDAS ainsi que des images satellitaires, on constate que l’avance des flux L5 et L6 était pratiquement nulle, avec de faibles variations observées en début de quinzaine. L’absence d’enregistrement de radiance thermique anormale observée dans les écoulements L5 et L6 montre leur refroidissement superficiel. À son tour, l’emplacement d’un troisième dôme de lave se démarque, qui a été localisé dans le cratère actif vers la fin de la période évaluée dans ce rapport.

L’activité explosive a présenté des hauteurs de colonnes maximales de 1060 m. Lorsque les conditions météorologiques le permettaient et durant le début de la quinzaine, il a été possible d’enregistrer des colonnes de hauteur modérée avec une forte charge en pyroclastes. Vers la fin de la période d’analyse, des colonnes majoritairement blanchâtres ont été observées, mettant en évidence l’occurrence d’explosions isolées avec une forte charge de matériau pyroclastique brun provenant du centre du cratère. Une coulée pyroclastique a été identifiée le 3 septembre dans une direction Nord-Est et d’une portée de 550 m. Il a été possible d’enregistrer une incandescence de faible intensité pendant la nuit.

Selon les données obtenues par le réseau de stations GNSS installées sur le volcan, le processus inflationniste de faible magnitude se maintient avec des taux de déformation verticale maximale de 0,9 cm/mois. Les lignes de base de suivi et les composantes horizontales ont également enregistré ce processus avec de légers changements dans leur comportement. Les stations inclinométriques sont restées stables à l’exception des changements dus aux conditions climatiques.

Sept (7) alertes thermiques ont été enregistrées dans la zone avec une valeur maximale de 2 MW le 15 septembre, considérée comme faible pour ce volcan. À leur tour, des anomalies de radiance ont été détectées les 10 et 15 septembre à partir de l’analyse d’images Sentinel 2-L2A.
L’imagerie thermique a permis d’observer des températures maximales de 290°C dans la zone d’émission lors des explosions et de 60°C pour les coulées de lave L5 et L6.

Source : Segemar.

Photos : Cesar Lara Cancino , Segemar .


June 27, 2021. EN. Italy / Sicily : Etna , Alaska : Gareloi , Chile / Argentina : Nevados de Chillan , Iceland : Geldingadalur / Fagradalsfjall .

June 27 , 2021.


Italy / Sicily , Etna :

Do you want more ???
Etna is the most active volcano in Europe and it does its job as a volcano quite well. No vacation for him yet.

Press release on ETNA’s activity, June 26, 2021, 4:49 pm (14:49 UTC).

The National Institute of Geophysics and Volcanology, Osservatorio Etneo announces that shortly after 14:30 UTC a resumption of Strombolian activity was observed from two eruptive vents on the Southeast Crater, which gradually intensifies, accompanied by production of modest amounts of volcanic ash. Based on the forecast model, the eruptive cloud produced by the current activity disperses in an East-North-East direction. In the previous hours, the lava flow emitted by a vent at an altitude of about 3050 m on the southeast flank of the Southeast Crater, which had remained active after the eruptive episode last night, has gradually depleted and is currently cooling.
At 14.20 UTC the amplitude of the volcanic tremor was on average values ​​with an increasing trend. The last location of the tremor, at 13.45 UTC, is near the Southeast Crater at a depth of approximately 3.0 km. During the last 10 minutes, no infrasound event has been recorded.
At present, there are no significant variations in the signals from inclinometer and GNSS networks.

At 5:48 p.m. (3:48 p.m. UTC), the Strombolian activity of the Southeast Crater gradually turned into a lava fountain. The emission of pyroclastic material intensifies, feeding a high eruptive cloud which reaches a height of about 5 km above sea level. At the same time, a lava overflow towards the southwest began, overlapping that of the eruptive episode of last night.
At 15:30 UTC the amplitude of the volcanic tremor is on high values ​​with an increasing trend.
The last location of the tremor, at 14:45 UTC, is near the Southeast Crater at a depth of about 3000 m above sea level. .
The number of infrasonic events in the last 10 minutes at 15.24 UTC is average. The last infrasound event is located near the Southeast Crater.

Press release on ETNA’s activity, June 26, 2021, 19:05 (17:05 UTC).

The National Institute of Geophysics and Volcanology, Osservatorio Etneo, announces that the activity of the lava fountain has ceased. A weak emission of ash from the Southeast Crater still persists and a flow of lava continues to extend towards the Southwest and South-Southwest. We also observe a resumption of effusive activity at the mouth located at an altitude of 3050 m on the south-eastern flank of the South-eastern Crater, which feeds a small lava flow of around one hundred meters in length.
Lapilli fall with diameters of 1 to 2 cm in the region of Macchia di Giarre and Zafferana Etnea, and several millimeters in Torre Archirafi (east side of Etna).
At 16:30 UTC, the maximum amplitude of the volcanic tremor was recorded. From this moment began a rapid descent which is still in progress. The last tremor location, at 4:15 p.m. UTC, is near the Southeast Crater at a depth of approximately 3.0 km. The number of infrasound events in the last 10 minutes at 16.35 UTC is high.
The last infrasound event is located near the Southeast Crater.
During the lava fountain episode, very small variations were only recorded at the upper stations of the inclinometric network. No significant change is observed in the signals acquired by the GNSS network.

Press release on ETNA’s activity, June 26, 2021, 22:41 (20:41 UTC).

The National Institute of Geophysics and Volcanology, Osservatorio Etneo reports that the explosive activity at the Southeast Crater has ceased. Instead, effusive activity continues from the vent located on the southeast flank of the Southeast Crater, feeding a lava flow that splits into two branches at an elevation of 2,900 m. The longest and most northerly of these branches at 20:00 UTC had reached an altitude of about 2600 m and had started to cool; the other branch had an active front at about 2700 m. The flow on the southwest side of the Southeast Crater is no longer supplied and cools.
At 20:00 UTC, the amplitude of the volcanic tremor is on medium-low values. The locations of the tremor remain in correspondence with the Southeast Crater at an altitude of about 3000 m. The number of infrasound events is low.

Further updates will be communicated shortly.

Source : INGV.

Photos : Guide Alpine Vulcanologiche Etna , Andrea Mirabella .


Alaska , Gareloi :

51°47’21 » N 178°47’46 » W,
Summit Elevation 5161 ft (1573 m)
Current Volcano Alert Level: ADVISORY
Current Aviation Color Code: YELLOW

Slightly elevated seismicity is continuing at Gareloi volcano but the level of activity has been gradually declining and is approaching background conditions. Possible sulfur dioxide emissions observed in satellite data, otherwise nothing noteworthy was observed in mostly cloudy satellite and web camera views of the volcano over the past day

Gareloi volcano persistently emits magmatic gases from a fumarole field on the south crater and commonly exhibits low-level seismic activity. These observations suggest the presence of shallow magma and potential interaction with a hydrothermal system. The current increase in seismicity likely reflects a change to the magmatic-hydrothermal system, but it is not clear that the likelihood of a volcanic eruption has increased. AVO will continue to monitor activity to determine if the recent changes are related to influx of new magma or other changes to the magma system.

Gareloi is monitored by a local seismic and infrasound network, satellite data, and regional infrasound and lightning-detection networks.

Source : AVO.

Photo : Read, Cyrus / AVO/USGS.


Chile / Argentina , Nevados de Chillan :

Seismicity parameters associated with rigid material fracturing (VT) processes showed a slight decrease in the number of events and energy released compared to the previous period, while activity related to fluid dynamics ( LP, VLP, TR and EX types) remained at similar levels. .
The highest energy VT-type event, with a local magnitude (ML) of 2.3, was located 4.3 km east-southeast (ESE) of the active crater and at a depth of 4 , 3 km.
From the analysis of the images provided by the surveillance cameras belonging to the OVDAS as well as the satellite images, it is observed that the growth of the supply crack of the L5 stream is maintained. The emission of the L5 and L6 streams predominates and the simultaneous activity of two emission centers in the nested dome is recognized, which although it does not show growth, and retains a significant part of its structure. The L5 stream has a range of 1 km with almost zero forward speed. The material supply covered the existing morphology, increasing a higher concentration in the distal-intermediate area. The L6 flow has a range of 894 m, being the most accelerated of the flows emitted in this eruptive cycle, although, in recent days, its greatest growth has been towards the sides. Earlier this month, a secondary lava flow was identified with a similar advance and temperature range at L6 and later a new pulse on L6 causing distal accumulations where a radiance anomaly was recognized.

The explosive activity exhibited maximum column heights of less than 1140 m, with a recurring particulate matter content. At the same time, the high level of intensity, distribution and frequency of incandescent events associated with explosions concentrated on the East zone (E) of the crater, affecting to a lesser extent the East, South-East and North slopes. Is, is maintained. The explosions occasionally generated proximal pyroclastic flows with a maximum extension of 0.6 km east of the volcanic edifice.
According to data obtained from the network of GNSS stations installed in the volcano, a change was observed in the vertical components of the stations located on the volcanic building, indicating a deflation with a maximum of -0.57 cm / month. On the monitoring baselines between stations, horizontal components and inclinometer stations remain stable.

Thirty-one (31) thermal alerts were recorded in the area with a maximum value of 86 MW on June 15, considered moderate for this volcano. In turn, radiance anomalies were detected on June 7, 9, 12 and 14 from Sentinel 2-L2A image analysis.
The thermal imagery made it possible to observe temperatures exceeding 360 ° C in the emission zone during the explosions.

Source : Segemar .

Photo : Josefauna.


Iceland , Geldingadalur / Fagradalsfjall :

Researchers from the Icelandic Meteorological Office (Veðurstofa Íslands) and the University of Iceland (Háskóli Íslands) believe that lava flow models are useful. In the new article published on the Agency’s website, we can read that such a model was first used in Iceland six years ago, during the eruption of Holuhraun.

The model shows two possible lava flow scenarios south of Nátthaga. The scenarios show lava flows of 3.1 million m3 on the one hand and 29 million m3 on the other. There is considerable uncertainty as to how long it will take for the Nátthaga region to be filled before lava begins to flow into the valley. (Model: Bureau of Meteorology / University of Iceland / Gro Birkefeldt Möller Pedersen)

The Icelandic Meteorological Office and the University of Iceland have collaborated on the use and development of lava flow models as part of a project funded by the RANNÍS Research Fund. According to Dr. Gro Birkefeldt Möller Pedersen, research specialist at the University of Iceland, even though the volcano has been measured regularly from the start, an irregular flow must be considered, which brings uncertainty to the picture. « To account for the different amounts of lava flow in the Nátthaga Valley, we calculated for two scenarios, ‘smaller’ and ‘larger’, » says Dr. Gro. The smallest is based on a flow of 3.1 km3 and the largest is 29 km3.

“When it comes to lava flows, it might not be as important to answer the question of when the lava reaches a certain spread as what the potential lava path will be,” says Sara. « In this context, we believe that the lava flow models can continue to be useful for the preparation of the emergency plan. »

Source : RUV.

Carte : Gro Birkefeldt Möller Pedersen – Veðurstofan/Háskóli Íslands.

Photo : MBL Is


June 01, 2021. EN. Democratic Republic of Congo : Nyiragongo , Peru : Sabancaya , Indonesia : Kerinci , Chile / Argentina : Nevados of Chillan , Hawaii : Kilauea .

June 01 , 2021.


Democratic Republic of Congo , Nyiragongo :

May 31, 2021:
Current earthquake (seismicity) and soil deformation data continue to indicate the presence of magma under the urban area of Goma with an extension below Lake Kivu. Although there are still earthquakes recorded, their energy is generally lower. Their location and the direction of the GPS movements always represent a stop or a pause in the propagation of the magmatic intrusion towards the south. A decrease in movement speeds measured by the GPS network still seems to confirm these observations. The physical impossibility of installing seismic or GPS stations in the lake does not allow precise detection of a rise in magma under the lake.

The Goma Volcanological Observatory (OVG) wanted to explain the situation of the Nyamulagira volcano, which is not erupting as some rumors have led it to believe this Saturday.

“Like the Nyiragongo, the Nyamulagira also emits plumes of gas. The plumes went towards the cone of Murara and directly the population believed that Nyamulagira was erupting, ”said Kasereka Mahinda, scientific director of OVG.

Government spokesman Patrick Muyaya also had to deny confirmation of the Nyamulagira eruption he had already announced.

“I have just been in contact with the people in charge of the Virunga park, they flew over Nyamulagira and they did not confirm the eruption. We have a lot of stations all around Nyamulagira, nothing confirms the eruption, ”Mahinda added.


“It is true that Nyamulagira is also in a phase of intense activity but today does not represent any danger. At the Nyiragongo eruption of January 10, 1977, the Nyamulagira had preceded, this is the eruption called Murara. It was a few days later, the Nyiragongo erupted, but at this point we have not yet recorded the Nyamulagira eruption, « he explained, calling on the population to be calm.

Sources : georiska.africamuseum.be , actualite.cd .

Photos : Nyiragongo volcano Virunga , Goma Fleva .


Peru , Sabancaya :

Analysis period: May 24, 2021 to May 30, 2021, Arequipa, May 31, 2021.
Alert level: ORANGE

The Geophysical Institute of Peru (IGP) reports that the eruptive activity of the Sabancaya volcano remains at moderate levels, that is to say with the recording of an average of 37 daily explosions, with columns of ash and gas up to 2.5 km altitude above the summit of the volcano and their consequent dispersion. Therefore, for the following days, no significant change is expected in eruptive activity.

The IGP recorded and analyzed the occurrence of 707 earthquakes of volcanic origin, associated with the circulation of magmatic fluids within the Sabancaya volcano. An average of 90 explosions was recorded daily. During this period, Volcano-Tectonic (VT) earthquakes associated with rock fractures were located mainly in the Northeast, East, and Northwest of Sabancaya and presented magnitudes included between M1.0 and M3.7.


The monitoring of the deformation of the volcanic structure using GNSS techniques (processed with fast orbits) does not show any significant anomalies. However, in general, an inflation process was observed in the northern sector (around the Hualca Hualca volcano). Visual surveillance made it possible to identify columns of gas and ash up to 2.5 km altitude above the summit of the volcano, which were scattered towards the South-East, South, East and North-East sectors of the volcano. Sabancaya. Satellite recordings have identified the presence of 3 thermal anomalies (maximum value of 14 MW) associated with the presence of a lava body on the surface of the volcano’s crater. The civil defense of the province of Caylloma reports light ash falls in the district of Chivay and in Achacota.

RECOMMENDATIONS
• Keep the volcanic alert level in orange.
• Do not approach within a radius of 12 km from the crater.

Source : IGP.

Photo : Martin Rietze .


Indonesia , Kerinci :

Level of activity at level II (WASPADA). The Kerinci volcano (3805 m above sea level) is continuously erupting.

The volcano is clearly visible until it is covered in fog. The crater emits faint to thick white smoke about 400-700 meters above the summit. The weather is sunny to rainy, weak to moderate winds in the northeast. The air temperature is around 19-24 ° C.

According to the seismographs of May 31, 2021, it was recorded:

124 emissions earthquakes.

VOLCANO OBSERVATORY NOTICE FOR AVIATION – VONA

Issued : May 30 , 2021
Volcano : Kerinci (261170)
Current Aviation Colour Code : YELLOW
Previous Aviation Colour Code : yellow
Source : Kerinci Volcano Observatory
Notice Number : 2021KER02
Volcano Location : S 01 deg 41 min 49 sec E 101 deg 15 min 50 sec
Area : Jambi, West Sumatra, Indonesia
Summit Elevation : 12176 FT (3805 M)

Volcanic Activity Summary : Gas emission at 11h14 UTC (06h14 lokal).

Volcanic Cloud Height : Best estimate of ash-cloud top is around 14416 FT (4505 M) above sea level, may be higher than what can be observed clearly. Source of height data: ground observer.

Other Volcanic Cloud Information : Volcanic Plume moving to nort west

Remarks : Seismic dominated by gas emission

Sources : PVMBG, Magma Indonésie.

Photo : Wild Sumatra


Chile / Argentina , Nevados of Chillan :

Seismicity parameters associated with rigid material fracturing (VT) processes showed a slight decrease in quantity and energy, while activity related to fluid dynamics (LP and EX types) showed an increase in the number of events and their energy. Likewise, very long period events (VLP) and tremor pulses (TR) with lower energy and number than the previous period were recorded.
The highest energy VT-type event, with a local magnitude (ML) of 2.6, was located 1.3 km northeast (NNE) of the active crater and at a depth of 3.3 km.
From the analysis of the images provided by the surveillance cameras belonging to the OVDAS as well as the satellite images, a forward speed of 0.2 m / ha could be deduced for the lava flow called L5 with a range estimated 966 m. Due to the growth of the fissure that feeds it, it was possible to distinguish the development of secondary flows with an extension of 220 m. No growth of the dome nestled in the crater is observed, but we note the destruction of its eastern part, from which is emitted a new lava flow called L6 which advances at a speed of 3.6 m / h with a range of 640 m.

Explosive activity exhibited maximum column heights of 1300 m, with recurring particulate content. In turn, a considerable increase in the intensity, distribution and frequency of events has been observed with incandescence associated with explosions, ballistic projections, splashes and landslides from the lava flows concentrated on the l ‘East (E) of the crater and the East, South-East and North-East slopes to a lesser extent. The explosions occasionally generated proximal pyroclastic flows with a maximum extension of 1.1 km to the northeast and ash deposits with distances between 3.5 and 5 km.

According to data obtained from a network of GNSS stations installed on the volcano, a change in the vertical components of the stations closest to the crater has been observed since May 2, showing deflation with a maximum of -0.45 cm / month. Likewise, inter-station monitoring baselines suggest deflation which could be the result of material being ejected to the surface.

Forty-one (41) thermal alerts were recorded in the area with a maximum value of 44 MW on May 11, considered moderate for this volcano. Radiation anomalies were detected on May 5, 10, 13, 15 and 18 from the analysis of images from the Sentinel 2-L2A satellite.
An anomaly in sulfur dioxide (SO2) emissions into the atmosphere was reported in the area near the volcanic complex on May 11, according to data released by TROPOMI and OMI.

An upward trend in surface temperatures has been observed since May 2, which could be associated with the emission of the new L6 lava flow detected on May 4.

Source : Segemar.

Photos : Josefauna.


Hawaii , Kilauea :

VOLCANO OBSERVATORY NOTICE FOR AVIATION (VONA)

Issued: May 27 , 2021
Volcano: Kilauea (VNUM #332010)
Current Color Code: YELLOW
Previous Color Code: ORANGE
Source: Hawaiian Volcano Observatory
Notice Number: 2021/H194
Volcano Location: N 19 deg 25 min W 155 deg 17 min
Area: Hawaii
Summit Elevation: 4091 ft (1247 m)

Volcanic Activity Summary:
Kilauea Volcano is no longer erupting. Lava supply to the Halemaʻumaʻu lava lake has ceased and sulfur dioxide emissions have decreased to near pre-eruption background levels.
Accordingly, the USGS Hawaiian Volcano Observatory (HVO) is lowering the Volcano Alert Level for ground based hazards from WATCH to ADVISORY and the Aviation Color Code from ORANGE to YELLOW.

HVO continues to closely monitor Kīlauea Volcano for signs of renewed activity. Should volcanic activity change significantly a new Volcanic Activity Notice will be issued.

A wide view of the now inactive lava lake and west vent from the western rim of Halema‘uma‘u, at Kīlauea summit. The lava lake is entirely crusted over with no red, glowing lava at the surface. Diffuse volcanic gas plumes are still being emitted from the west vent and northern lake margin. This photo was taken in an area of Hawai‘i Volcanoes National Park that remains closed to the public due to safety reasons. USGS photograph taken by D. Downs on May 26, 2021.

Hazards are still present on Kīlauea Volcano and are described below. Residents and visitors should stay informed and follow County of Hawai‘i and Hawaiʻi Volcanoes National Park guidelines.

Volcanic cloud height:
Minor fume emanating from previously active areas within Halemaʻumaʻu crater is producing a weak plume at the summit of Kīlauea. Visibility of the plume varies with humidity and temperature and may be stronger in the early morning.

Other volcanic cloud information: None at this time.

Remarks:
Lava supply to the lava lake appears to have ceased between May 11th and 13th based upon elevation measurements of the lake surface that showed the surface was no longer rising. Dwindling lava supply over the previous month had caused the active lava lake to shrink to two small ponds by May 11th and was completely crusted over by May 20th. The last surface activity on the lake was observed on May 23nd. Changes in the lava lake have been accompanied by a drop in gas emissions to levels close to pre-eruption background level. Seismic tremor persistent during the eruption has weakened significantly but continues to indicate some shallow magmatic activity. Since May 11th, there has been weak inflation and an increase in shallow volcano tectonic earthquakes at the summit, suggesting magma entering the system is being stored at depth. These observations indicate that the eruption in Halema‘uma‘u at the summit of Kīlauea Volcano has paused. It is possible that the Halema‘uma‘u vent could resume eruption or that Kīlauea is entering a period of quiescence prior the next eruption.

Source : HVO.

01 Juin 2021. FR . République Démocratique du Congo : Nyiragongo , Pérou : Sabancaya , Indonésie : Kerinci , Chili / Argentine : Nevados de Chillan , Hawaii : Kilauea .

01 Juin 2021.


République Démocratique du Congo , Nyiragongo :

31 Mai 2021 :
Les données actuelles de tremblements de terre (sismicité) et de déformation du sol continuent d’indiquer la présence de magma sous la zone urbaine de Goma avec une extension sous le lac Kivu. Bien qu’il y ait toujours des tremblements de terre enregistrés, leur énergie est globalement plus faible. Leur localisation et la direction des déplacements GPS représentent toujours un arrêt ou une pause de la propagation de l’intrusion magmatique vers le Sud. Une diminution des vitesses de déplacement mesurées par le réseau GPS semble toujours confirmer ces observations. L’impossibilité physique d’installer des stations sismiques ou GPS dans le lac ne permet pas de détecter précisément une remontée du magma sous le lac.

L’Observatoire volcanologique de Goma (OVG) a tenu à expliquer la situation du volcan Nyamulagira qui n’est pas en éruption comme certaines rumeurs l’ont fait croire ce samedi.

«Comme le Nyiragongo, le Nyamulagira émet aussi des panaches de gaz. Les panaches se sont dirigés vers le cône de Murara et directement la population a cru que Nyamulagira est en éruption », a dit Kasereka Mahinda, directeur scientifique de l’OVG.

Le porte-parole du gouvernement Patrick Muyaya a dû démentir aussi la confirmation de l’éruption de Nyamulagira qu’il avait déjà annoncé.

«Je viens d’être en contact avec les responsables du parc des Virunga, ils ont survolé Nyamulagira et ils n’ont pas confirmé l’éruption. Nous avons beaucoup de stations tout autour de Nyamulagira, rien ne confirme l’éruption », a ajouté M. Mahinda.


«Il est vrai que Nyamulagira est aussi à une phase d’activités intenses mais aujourd’hui ne représente aucun danger. A l’éruption du Nyiragongo du 10 janvier 1977, le Nyamulagira avait précédé, c’est l’éruption qu’on appelle Murara. C’était quelques jours après, le Nyiragongo est entré en éruption, mais à ce stade nous n’avons pas encore enregistré l’éruption de Nyamulagira », a-t-il expliqué, appelant la population au calme.

Sources : georiska.africamuseum.be , actualite.cd .

Photos : Nyiragongo volcano Virunga , Goma Fleva .


Pérou , Sabancaya :

Période d’analyse: du 24 Mai 2021 au 30 Mai 2021 , Arequipa, 31 Mai 2021.
Niveau d’alerte: ORANGE

L’Institut géophysique du Pérou (IGP) rapporte que l’activité éruptive du volcan Sabancaya reste à des niveaux modérés, c’est-à-dire avec l’enregistrement d’une moyenne de 37 explosions quotidiennes , avec des colonnes de cendres et de gaz jusqu’à 2,5 km d’altitude au dessus du sommet du volcan et leur dispersion consécutives . Par conséquent, pour les jours suivants, aucun changement significatif n’est attendu concernant l’ activité éruptive.

L’IGP a enregistré et analysé l’occurrence de 707 tremblements de terre d’origine volcanique, associés à la circulation de fluides magmatiques à l’intérieur du volcan Sabancaya. Une moyenne de 90 explosions a été enregistrée quotidiennement . Au cours de cette période, les tremblements de terre de type Volcano-Tectoniques (VT) associés à des fracturations rocheuses ont été localisés principalement dans le Nord-Est , l’Est , et le Nord-Ouest du Sabancaya et ont présenté des magnitudes comprises entre M1,0 et M3,7. 


Le suivi de la déformation de la structure volcanique à l’aide de techniques GNSS (traitées avec des orbites rapides) ne présente pas d’anomalies significatives. Cependant, de manière générale, un processus d’inflation a été observé dans le secteur  Nord ( environs du volcan Hualca Hualca ). La surveillance visuelle a permis d’identifier des colonnes de gaz et de cendres jusqu’à 2,5  km d’altitude au dessus du sommet du volcan , qui étaient dispersées vers les secteurs Sud-Est , Sud , Est et Nord- Est du Sabancaya.  Les enregistrements par satellites ont identifiés la présence de 3 anomalies thermiques ( valeur maximale de 14 MW ) associées à la présence d’un corps de lave à la superficie du cratère du volcan . La défense civile de la province de Caylloma rapporte de légères chutes de cendres dans le district de Chivay et dans Achacota .

RECOMMANDATIONS
• Garder le niveau d’alerte volcanique en orange.
• Ne pas s’ approcher dans un rayon de moins de 12 km du cratère.

Source : IGP.

Photo : Martin Rietze .


Indonésie , Kerinci :

Niveau d’activité de niveau II (WASPADA). Le volcan Kerinci (3805 m d’altitude) est en éruption continuellement.

Le volcan est clairement visible jusqu’à ce qu’il soit couvert de brouillard. Le cratère émet une fumée blanche , faible à épaisse , à environ 400-700 mètres au dessus du sommet. Le temps est ensoleillé à pluvieux, les vents faibles à modérés au Nord-Est. La température de l’air est d’environ 19-24 ° C.

Selon les sismographes du 31 mai 2021, il a été enregistré:

124  tremblements de terre d’émissions.

AVIS D’OBSERVATION DU VOLCAN POUR L’AVIATION – VONA

Diffusion: 30 mai 2021
Volcan: Kerinci (261170)
Code couleur de l’aviation actuel: JAUNE
Code couleur de l’aviation précédent: jaune
Source: Observatoire du volcan Kerinci
Numéro de l’avis: 2021KER02
Emplacement du volcan: S 01 deg 41 min 49 sec E 101 deg 15 min 50 sec
Zone: Jambi, West Sumatra, Indonésie
Altitude du sommet: 12176 FT (3805 M)

Résumé de l’activité volcanique: émission de gaz à 11h14 UTC (06h14 lokal).

Hauteur des nuages volcaniques: La meilleure estimation du sommet des nuages de cendres est d’environ 14416 FT (4505 M) au-dessus du niveau de la mer, ce qui peut être plus élevé que ce qui peut être observé clairement. Source des données d’altitude: observateur au sol.

Autres informations sur les nuages volcaniques: le panache volcanique se déplace vers le Nord-Ouest

Remarques: sismicité dominée par l’émission de gaz

Sources : PVMBG, Magma Indonésie.

Photo : Wild Sumatra


Chili / Argentine , Nevados de Chillan :

Les paramètres de sismicité associés aux processus de fracturation des matériaux rigides (VT) ont montré une légère diminution en quantité et en énergie, tandis que l’activité liée à la dynamique des fluides (types LP et EX) a montré une augmentation du nombre d’événements et de leur énergie . De même, des événements de très longue période (VLP) et des impulsions de tremor (TR) avec une énergie et un nombre inférieurs à ceux de la période précédente ont été enregistrés.
L’événement de type VT d’énergie la plus élevée, avec une magnitude locale (ML) de 2,6, a été localisé à 1,3 km au Nord-Nord-Est (NNE) du cratère actif et à une profondeur de 3,3 km.
A partir de l’analyse des images fournies par les caméras de surveillance appartenant à l’OVDAS ainsi que des images satellites, une vitesse d’avance de 0,2 m / h a pu être déduite pour la coulée de lave appelée L5 avec une portée estimée de 966 m. En raison de la croissance de la fissure qui l’alimente, il a été possible de distinguer le développement d’écoulements secondaires avec une extension de 220 m. Aucune croissance du dôme niché dans le cratère n’est observée, mais on note la destruction de sa partie orientale, d’où est émise une nouvelle coulée de lave appelée L6 qui avance à une vitesse de 3,6 m / h avec une portée de 640 m.

L’activité explosive a présenté des hauteurs de colonne maximales de 1 300 m, avec un contenu récurrent de matière particulaire. À leur tour, une augmentation considérable de l’intensité, de la distribution et de la fréquence des événements a été observée avec une incandescence associée aux explosions, des projections balistiques, des éclaboussures et des glissements de terrain depuis les coulées de lave concentrées sur l’Est (E) du cratère et les pentes Est, Sud-Est et Nord-Est dans une moindre mesure. Les explosions ont occasionnellement généré des écoulements pyroclastiques proximaux avec une extension maximale de 1,1 km vers le Nord-Est et des dépôts de cendres avec des distances comprises entre 3,5 et 5 km.

Selon les données obtenues depuis réseau de stations GNSS installées sur le volcan, un changement des composantes verticales des stations les plus proches du cratère a été observé depuis le 2 mai, montrant une déflation avec un maximum de -0,45 cm / mois. De même, les lignes de base de surveillance inter-stations suggèrent une déflation qui pourrait être le résultat d’une éjection de matière vers la surface.

Quarante et une (41) alertes thermiques ont été enregistrées dans la zone d’une valeur maximale de 44 MW le 11 mai, considérée comme modérée pour ce volcan. Des anomalies de rayonnement ont été détectées les 5, 10, 13, 15 et 18 mai à partir de l’analyse d’images du satellite Sentinel 2-L2A.
Une anomalie des émissions de dioxyde de soufre (SO2) dans l’atmosphère a été signalée dans le secteur proche du complexe volcanique le 11 mai, selon les données publiées par TROPOMI et OMI.
Une tendance à la hausse des températures de surface est observée depuis le 2 mai, qui pourrait être associée à l’émission de la nouvelle coulée de lave L6 détectée le 4 mai.

Source : Segemar.

Photos : Josefauna.


Hawaii , Kilauea :

AVIS D’OBSERVATION DU VOLCAN POUR L’AVIATION (VONA)

Date d’émission: 27 mai 2021
Volcan: Kilauea (VNUM # 332010)
Code couleur actuel: JAUNE
Code couleur précédent: ORANGE
Source: Observatoire du volcan hawaïen
Numéro de l’avis: 2021 / H194
Emplacement du volcan: N 19 ° 25 min O 155 ° 17 min
Région: Hawaii
Altitude du sommet: 4091 pi (1247 m)

Résumé de l’activité volcanique:
Le volcan Kilauea n’est plus en éruption. L’approvisionnement en lave du lac de lave du cratère Halema’uma’u a cessé et les émissions de dioxyde de soufre ont diminué pour atteindre des niveaux de fond proches de l’éruption.
En conséquence, l’USGS Hawaiian Volcano Observatory (HVO) abaisse le niveau d’alerte du volcan pour les dangers au sol de ATTENTION à AVIS et le code de couleur de l’aviation de ORANGE à JAUNE.

Le HVO continue de surveiller de près le volcan Kīlauea à la recherche de signes d’activité renouvelée. Si l’activité volcanique change de manière significative, un nouvel avis d’activité volcanique sera émis.

Une vue large du lac de lave maintenant inactif et de l’évent Ouest depuis le bord Ouest du cratère Halema’uma’u, au sommet du Kīlauea. Le lac de lave est entièrement recouvert d’une croûte sans lave rougeoyante à la surface. Des panaches de gaz volcaniques diffus sont toujours émis par l’évent Ouest et la marge Nord du lac. Cette photo a été prise dans une zone du parc national des volcans d’Hawaï qui reste fermée au public pour des raisons de sécurité. Photographie USGS prise par D. Downs le 26 mai 2021.

Les dangers sont toujours présents sur le volcan Kīlauea . Les résidents et les visiteurs doivent rester informés et suivre les directives du comté d’Hawaï et du parc national des volcans d’Hawaï.

Hauteur des nuages ​​volcaniques:
Une émission de fumées mineure émanant de zones précédemment actives dans le cratère Halemaʻumaʻu produit un panache faible au sommet du Kīlauea. La visibilité du panache varie avec l’humidité et la température et peut être plus forte tôt le matin.

Autres informations sur les nuages ​​volcaniques: Aucune pour le moment.

Remarques:
L’approvisionnement en lave du lac de lave semble avoir cessé entre le 11 et le 13 mai sur la base des mesures d’altitude de la surface du lac qui ont montré que la surface ne montait plus. La diminution de l’approvisionnement en lave au cours du mois précédent avait fait rétrécir le lac de lave actif à deux petits étangs le 11 mai et celui ci était complètement recouvert de croûtes le 20 mai. La dernière activité de surface sur le lac a été observée le 23 mai. Les changements dans le lac de lave se sont accompagnés d’une baisse des émissions de gaz à des niveaux proches du niveau de fond avant l’éruption. Le tremor sismique persistant pendant l’éruption s’est considérablement affaibli mais continue d’indiquer une activité magmatique peu profonde. Depuis le 11 mai, il y a eu une faible inflation et une augmentation des tremblements de terre tectoniques volcaniques peu profonds au sommet, suggérant que le magma entrant dans le système est stocké en profondeur. Ces observations indiquent que l’éruption de l’Halema’uma’u au sommet du volcan Kīlauea s’est interrompue. Il est possible que l’évent dans le cratère Halema’uma’u reprenne l’éruption ou que Kīlauea entre dans une période de repos avant la prochaine éruption.

Source : HVO.

April 26, 2021. EN . Japan : Sakurajima , La Réunion Island : Piton de la Fournaise , Philippines : Taal , Chile / Argentina : Nevados of Chillan , Saint Vincent : Soufrière Saint Vincent .

April 26 , 2021 .


Japan , Sakurajima :

The volcano Sakurajima in southwestern Japan erupted early Sunday, sending a column of smoke over 2.3 kilometers into the air, the weather agency said.

Following the eruption at 1:09 a.m., the Meteorological Agency issued an alert, urging people in the cities of Kagoshima and Tarumizu in Kagoshima Prefecture to protect themselves from any potential impact. There were no reports of injuries or property damage following the eruption, local authorities said.

Although pyroclastic flows were confirmed within 1.8 km of the Minamidake crater, the agency said the likelihood of death or injury is low since people have been prohibited from approaching areas within 2 km of the crater since February 2016.

The agency is maintaining its alert for the volcano at level 3 on a 5-point scale, warning the public not to go near the crater and urging caution against falling rocks and stones and pyroclastic flows beyond the 2-km radius.

The agency later expanded the no-entry zone to a 2.4-km radius from the Minamidake crater. The nearest residential area is about 2.5 km away.

Sakurajima, an area that has one of the most active volcanoes in Japan, is connected to the Osumi Peninsula on Kyushu, the country’s southwestern main island.

A large eruption in 1914 emitted enough lava to close the strait between the Sakurajima volcanic island in Kagoshima Bay and the Osumi Peninsula.

Source : japantimes.co

Photo : Kyodo.

Read the article https://www.japantimes.co.jp/news/2021/04/25/national/sakurajima-volcano-eruption/?fbclid=IwAR2ZTMoHoR4MA3blMseTonQMWppF0OtS_yJVTws1MKRzcgSmQyULRUqOdUQ


La Réunion Island , Piton de la Fournaise :

Press release of April 25, 2021 – 12:30 p.m.

The eruption that started on 04/09/2021 at 7 p.m. (appearance of the tremor) continues. The intensity of the volcanic tremor (indicator of a surface lava emission) has been stable for ten days.

– No direct observation of the eruptive site could be made today given the very bad weather conditions on the volcano this morning. For additional information, the OVPF rain gauge located north of the summit of Piton de la Fournaise recorded 40 mm of rain this morning between 4 a.m. and 12 p.m. (local time).

– Over the last 24 hours, 8 superficial volcano-tectonic earthquakes (between sea level and the surface) have been recorded under the summit craters.
– The CO2 fluxes in the soil are still increasing both in the far field (Plaine des Cafres and Plaine des Palmistes) and in the near field (Gîte du volcano).
– Averaged over the past few days, no significant trend can be seen in the deformations of the building (neither in deflation nor in inflation). It could suggest a flow of magma
deep entering the superficial magmatic reservoir equivalent to the outlet flow of the reservoir which feeds the eruptive site.

Source : OVPF.

Read the article: https://www.ipgp.fr/sites/default/files/ovpf_20210425_12h30_communique_eruption.pdf

Photo : OVPF


Philippines , Taal :

TAAL VOLCANO BULLETIN 26 April 2021 08:00 A.M.

In the past 24-hour period, the Taal Volcano Network recorded fifty-six (56) volcanic earthquakes, including thirty-five (35) volcanic tremors having durations of one (1) minute to eighteen (18) minutes, twenty-one (21) low frequency volcanic earthquakes, and low-level background tremor that started at 9:05 AM on 08 April 2021. Activity at the Main Crater consisted of weak emission of steam-laden plumes from fumaroles or gas vents that rose to ten (10) meters.

Sulfur dioxide (SO2) emission averaged 701 tonnes/day on 25 April 2021. Temperature highs of 71.8°C and pH of 1.59 were last measured from the Main Crater Lake respectively on 04 March and 12 February 2021. Ground deformation parameters from electronic tilt, continuous GPS and InSAR monitoring continue to record a very slow and steady inflation and expansion of the Taal region that began after the January 2020 eruption. These parameters indicate persistent magmatic activity at shallow depths beneath the edifice.

Source : Phivolcs.

Photo : William Enriquez


Chile / Argentina, Nevados of Chillan :

Seismicity parameters associated with rigid material fracturing (VT) processes showed a slight increase in quantity and energy, as did the energy of events related to fluid dynamics (LP and EX types), while the quantity and energy showed a slight decrease in the case of tremor-type events (TR).

The highest energy VT-type event, with a local magnitude (ML) of 4.1, was located 1.9 km northeast (NNE) of the active crater and at a depth of 3.8 km.
The analysis of the images provided by the surveillance cameras belonging to the OVDAS, as well as the analysis of the satellite images, deduced that the advance of the lava flow, at a speed of 0.1 m / h, had an estimated range of 938 m. The explosive activity exhibited maximum column heights of 760 m, with low particulate content. It is seen that in recent weeks, the growth of the dome nestled in the crater has concentrated its growth towards the edges, showing a depressed morphology in its center.

An estimated volume for the dome is estimated at 411,978 m³ and a total extruded volume (June 2020-present) of 2,329,876 m³, calculated based on digital elevation models.
When the weather conditions allowed it, it was possible to record the nocturnal incandescence associated with the explosions in a recurrent and focused manner in the East zone (E) of the crater.

According to data obtained from the network of GNSS stations and inclinometers installed on the volcano, a slight inflationary trend was observed.
Six (6) thermal alerts were recorded in the area with a maximum value of 8 MW, considered moderate for this volcano. In turn, radiation anomalies were detected on April 3, 5, 8, 10, 13 and 15 from Sentinel 2-L2A image analysis.

There was no increase in the mean temperature observed for the lava flow during this period.

Source : Segemar .

Photo : Josefauna.


Saint Vincent , Soufrière Saint Vincent :

La Soufrière, St Vincent SCIENTIFIC UPDATE – 25/04/21 6:00PM

– Seismic activity at La Soufrière, has remained low since the tremor associated with the explosion and ash venting around noon on 22 April.
– In the last 24 hours, only a few long-period, hybrid and volcano-tectonic earthquakes have been recorded and there was no further tremor.

– Satellite radar imagery acquired on 24th April indicates probable continued growth or formation of a lava dome following the explosions on 18 and 22 April.
– The volcano continues to erupt and is still dangerous.
– Its pattern of seismic activity over the last few days is typical of the growth of a lava dome.
– Explosions with accompanying ashfall, of similar or larger size can restart with little or no warning.

– The volcano is at alert level Red.


Evolution of the La Soufriere eruption shown here by the ALOS-2 radar images from January 13th to April 21, 2021. We can see the lava dome that emerged in Dec 2020, elongate to a form a coulee and the last image of it is from April 7th, two days before the 1st explosion was observed.
The April 21st image shows that both the old and new dome have been destroyed and a new crater has formed as shown in previous images.
The eruption continues and we will continue to share the rich satellite imagery we have been able to access to observe the volcano.

Source : UWI

March 28, 2021. EN. Alaska : Semisopochnoi , Indonesia : Sinabung , Chile / Argentina : Cerro Hudson , La Réunion : Piton de la Fournaise .

March 28 ,  2021 .


Alaska , Semisopochnoi :

51°55’44 » N 179°35’52 » E,
Summit Elevation 2625 ft (800 m)
Current Volcano Alert Level: WATCH
Current Aviation Color Code: ORANGE

Unrest continues. Two explosions were detected on regional infrasound sensors over the past day at 06:30 and 09:30 UTC (21:30 on March 26 and 00:30 on March 27 HADT). High meteorological clouds (> 30,000 ft asl) were in the region during the time of these explosions and no ash cloud was observed rising above them in satellite data. Satellite observations of the volcano were obscured by clouds over the past day. No evidence of sulfur dioxide emissions was observed in satellite data yesterday afternoon. These small explosions are typical for the recent eruptive behavior at Semisopochnoi.

Semisopochnoi, view of Ragged Top from the west.

Semisopochnoi is monitored by satellite data, regional infrasound, and lightning detection instruments. An infrasound array on Adak Island may detect explosive emissions from Semisopochnoi with a slight delay (approximately 13 minutes) if atmospheric conditions permit.

Source : AVO.

Photo : Jones, Ian.


Indonesia , Sinabung :

The activity level has been at level III (SIAGA) since May 20, 2019 at 10:00 a.m. WIB. Mount Api Sinabung (2460 m above sea level) has been erupting since 2013. The last eruption occurred on March 23, 2021 with a column height of 700 meters above the summit.
The volcano was clearly visible until it was covered in fog. We observe that the crater emits white smoke with a strong thickness, about 50-500 meters above the summit. The weather is sunny to cloudy, with light to moderate winds north, east, west and northwest.

According to the seismographs of March 27, 2021, it was recorded:
1 eruption / explosion earthquake
50 avalanche earthquakes
3 emissions earthquakes
28 hybrid / multi-phase earthquakes
1 local tectonic earthquake
5 distant tectonic earthquakes

Recommendation:

Communities and visitors / tourists should not conduct activities in villages that have been displaced, as well as within a radial radius of 3 km around the summit of Mount Sinabung, as well as a sector radius of 5 km for the sector. South-East, and 4 km for the North-East sector.

Source : PVMBG.

Photo : Sadrah PS.


Chile / Argentina , Cerro Hudson :

For the period evaluated, the seismic activity associated with rock fracturing (VT) showed a slight increase in the number of events, while maintaining similar magnitudes compared to the previous fortnight.
The highest energy event had a local magnitude (ML) of 2.7 and was located 5.5 km south (S) of the caldera center with a depth of 4.6 km.
The seismic activity associated with the fluid dynamics inside the volcano (LP and HB types) showed similar levels to the previous period with regard to the number of events, but showed a decrease in its energy.

The data provided by the GNSS stations did not record any variations suggesting changes in the internal dynamics of the volcano.
No abnormal surface activity was recorded for the period evaluated.

The YELLOW technical alert level implies the appearance of changes in the behavior of the volcano’s activity.

Source : Segemar .

Photo : Norm Banks,  (U.S. Geological Survey).


La Réunion , Piton de la Fournaise :

Preliminary activity bulletin of March 27, 2021.
Alert level: Vigilance.

Seismology

– Number of landslides on 03-27-2021: 1
Areas affected by landslides:
Summit cone
Enclos 
Outside Enclos 

– Number of volcano-tectonic earthquakes (VT) of 03-27-2021: 55
Zone affected by VT:
Summit cone

– Larger magnitude volcano-tectonic earthquake of 03-27-2021:
Length: 25.04 s
Magnitude of duration: 1.93.

Location map (epicenters) and North-South and East-West sections (showing the location in depth, hypocenters) of the earthquakes recorded and located by the OVPF-IPGP over 2 months in Reunion Island. Only localizable earthquakes have been shown on the map.
The observatory records seismic events that are not shown on this map because they cannot be located, due to their too low magnitude.
To find out about the number of earthquakes detected by the observatory networks, you can refer to the latest Activity Bulletin.

Deformations
– The GPS of the summit area record inflation, witnessing the pressurization of a surface source.
– Far-field GPS record an inflation, witnessing the pressurization of a deep source.

Illustration of the deformation over 2 months. The baselines (variation of distance between two GPS receivers) crossing the Piton de la Fournaise building, at the top (top), the base of the terminal cone (in the middle) and in the far field (bottom) are shown here. ) (see location on the associated maps). A rise is synonymous with elongation and therefore swelling of the volcano; conversely, a decrease is synonymous with contraction and therefore deflation of the volcano. Any periods colored in light pink correspond to eruptions.

Geochemistry
SO2 emissions at the top of the volcano: close to the detection threshold.
CO2 emissions from the ground: increasing throughout the network.

Source : OVPF.

Photo : Imaz Press

28 Mars 2021 . FR. Alaska : Semisopochnoi , Indonésie : Sinabung , Chili / Argentine : Cerro Hudson , La Réunion : Piton de la Fournaise .

28 Mars 2021 .


Alaska , Semisopochnoi :

51 ° 55’44 « N 179 ° 35’52 » E,
Altitude du sommet : 2625 pi (800 m)
Niveau d’alerte volcanique actuel: ATTENTION
Code couleur de l’aviation actuel: ORANGE

Les troubles continuent. Deux explosions ont été détectées sur des capteurs d’infrasons régionaux au cours de la dernière journée à 06h30 et 09h30 UTC (21h30 le 26 mars et 00h30 le 27 mars HADT). Des nuages météorologiques élevés (> 30 000 pieds d’altitude) se trouvaient dans la région au moment de ces explosions et aucun nuage de cendres n’a été observé s’élevant au-dessus d’eux dans les données satellitaires. Les observations satellitaires du volcan ont été obscurcies par les nuages au cours de la dernière journée. Aucune preuve d’émissions de dioxyde de soufre n’a été observée dans les données satellitaires hier après-midi. Ces petites explosions sont typiques du comportement éruptif récent du Semisopochnoi.

Semisopochnoi, vue de Ragged Top , vue orientée vers l’Ouest.

Le semisopochnoi est surveillé par des données satellitaires, des capteurs d’infrasons régionaux et des instruments de détection de la foudre. Un réseau de capteurs d »infrasons sur l’île d’Adak peut détecter les émissions explosives du Semisopochnoi avec un léger retard (environ 13 minutes) si les conditions atmosphériques le permettent.

Source : AVO.

Photo : Jones, Ian.


Indonésie , Sinabung :

Le niveau d’activité est au niveau III (SIAGA) depuis le 20 mai 2019 à 10h00 WIB. Le mont Api Sinabung (2460 m d’altitude) est en éruption depuis 2013. La dernière éruption s’est produite le 23 mars 2021 avec une hauteur de colonne de 700 mètres au-dessus du sommet.
Le volcan était clairement visible jusqu’à ce qu’il soit couvert de brouillard. On observe que le cratère émet de la fumée blanche avec une forte épaisseur , à environ 50-500 mètres au dessus du sommet. Le temps est ensoleillé à nuageux, les vents faibles à modérés orientés au Nord, à l’Est, à l’Ouest et au Nord-Ouest.

Selon les sismographes du 27 mars 2021, il a été enregistré:
1 tremblement de terre d’éruption / explosion
50 tremblements de terre d’avalanches
3 tremblements de terre d’émissions
28 tremblements de terre hybrides / multi-phases
1 tremblement de terre tectonique local
5  tremblements de terre tectoniques lointains

Recommandation:

Les communautés et les visiteurs / touristes ne doivent pas mener d’activités dans les villages qui ont été déplacés, ainsi que dans un rayon radial de 3 km autour du sommet du mont Sinabung, ainsi qu’un rayon sectoriel de 5 km pour le secteur Sud-Est, et 4 km pour le secteur Nord-Est .

Source : PVMBG.

Photo : Sadrah PS.


Chili / Argentine , Cerro Hudson :

Pour la période évaluée, l’activité sismique associée à la fracturation rocheuse (VT) a montré une légère augmentation du nombre d’événements, tout en conservant des magnitudes similaires par rapport à la quinzaine précédente.
L’événement d’énergie la plus élevée avait une magnitude locale (ML) de 2,7 et était situé à 5,5 km au Sud (S) du centre de la caldeira avec une profondeur de 4,6 km.
L’activité sismique associée à la dynamique des fluides à l’intérieur du volcan (types LP et HB) a montré des niveaux similaires à la période précédente en ce qui concerne le nombre d’événements, mais a présenté une diminution de son énergie.

Les données fournies par les stations GNSS n’ont pas enregistré de variations suggérant des changements dans la dynamique interne du volcan.
Aucune activité de surface anormale n’a été enregistrée pour la période évaluée.

Le niveau d’alerte technique JAUNE implique l’apparition de changements dans le comportement de l’activité du volcan.

Source : Segemar .

Photo : Norm Banks,  (U.S. Geological Survey).


La Réunion , Piton de la Fournaise :

Bulletin préliminaire d’activité du 27 Mars 2021.
Niveau d’alerte : Vigilance.

Sismologie

– Nombre d’éboulements du 27-03-2021 : 1
Zones concernées par les éboulements :
Cône sommital
Enclos
Hors Enclos

– Nombre de séismes volcano-tectoniques (VT) du 27-03-2021 : 55
Zone concernée par les VT :
Cone sommital

– Séisme volcano-tectonique de plus grande magnitude du 27-03-2021 :
Durée : 25.04 s
Magnitude de durée : 1.93.

Carte de localisation (épicentres) et coupes Nord-Sud et Est-Ouest (montrant la localisation en profondeur, hypocentres) des séismes enregistrés et localisés par l’OVPF-IPGP sur 2 mois sous La Réunion. Seuls les séismes localisables ont été représentés sur la carte.
L’observatoire enregistre des évènements sismiques non représentés sur cette carte car non localisables, en raison de leur trop faible magnitude.
Pour prendre connaissance du nombre de séismes détectés par les réseaux de l’observatoire, vous pouvez vous reporter au dernier Bulletin d’Activité.

Déformations
– Les GPS de la zone sommitale enregistrent une inflation, témoin de la mise en pression d’une source superficielle.
– Les GPS en champ lointain enregistrent une inflation, témoin de la mise en pression d’une source profonde.

Illustration de la déformation sur 2 mois. Sont ici représentées des lignes de base (variation de distance entre deux récepteurs GPS) traversant l’édifice du Piton de la Fournaise, au sommet (en haut), à la base du cône terminal (au milieu) et en champ lointain (en bas) (cf. localisation sur les cartes associées). Une hausse est synonyme d’élongation et donc de gonflement du volcan; inversement une diminution est synonyme de contraction et donc de dégonflement du volcan. Les éventuelles périodes coloriées en rose clair correspondent aux éruptions.

Géochimie
Émissions de SO2 au niveau du sommet du volcan: proches du seuil de détection.
Émissions de CO2 par le sol : en augmentation sur l’ensemble du réseau.

Source : OVPF.

Photo : Imaz Press