
February 24 , 2018.
Mayon , Philippines :
MAYON VOLCANO BULLETIN 24 February 2018 8:00 A.M.
Mayon’s activity in the past 24 hours was characterized by generally quiet lava effusion and degassing from the summit crater. During daytime yesterday, between 10:32 AM and 1:44 PM, six (6) episodes of lava-collapse pyroclastic density currents (PDC) were visually observed on the Miisi, Basud and Bonga-Buyuan Gullies within 4-5 kilometers of the summit crater. At night, lava effusion from the vent continued to feed lava flows that have maintained fronts at 3.3 kilometers, 4.5 kilometers and 900 meters on the Miisi, Bonga and Basud Gullies, respectively, from the summit crater.
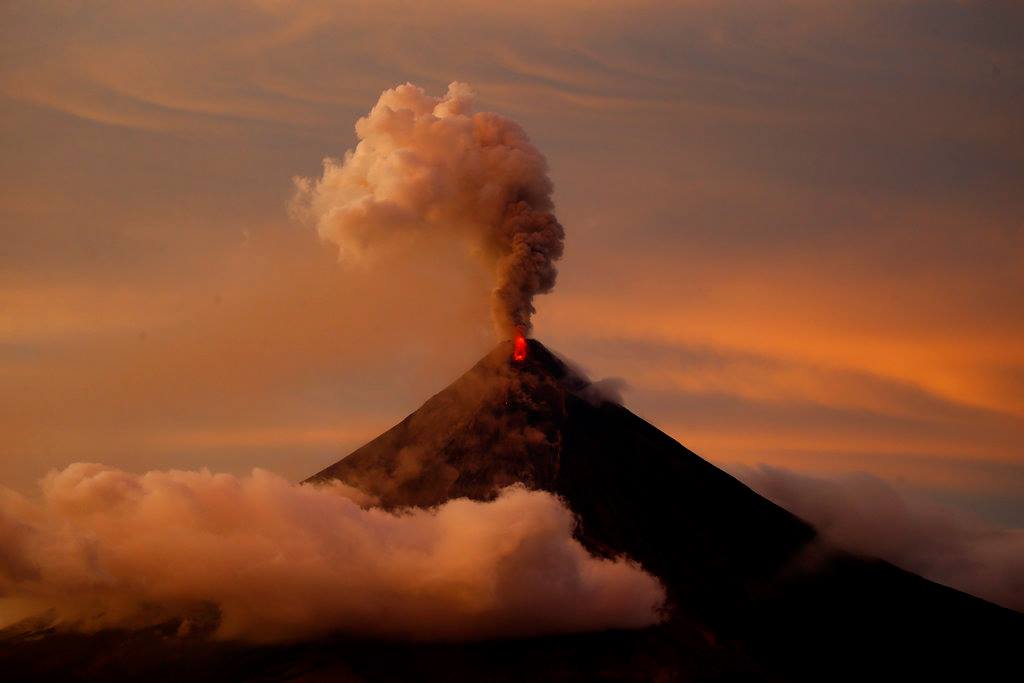
A total of three (3) volcanic earthquakes and eight (8) rockfall events were recorded by Mayon’s seismic monitoring network. Sulfur dioxide (SO2) emission was measured at an average of 2070 tonnes/day on 23 February 2018. Deflation of the lower slopes that began on 20 February was recorded by electronic tilt, consistent with the transition to quiet lava efffusion at the summit crater. Nonetheless, overall electronic tilt and continuous GPS data indicate that the edifice is still swollen or inflated relative to November and October 2017, consistent with campaign Precise Leveling data acquired this week.
Alert Level 4 still remains in effect over Mayon Volcano. The public is strongly advised to be vigilant and desist from entering the eight (8) kilometer-radius danger zone, and to be additionally vigilant against pyroclastic density currents, lahars and sediment-laden stream flows along channels draining the edifice. Civil aviation authorities must also advise pilots to avoid flying close to the volcano’s summit as ash from any sudden eruption can be hazardous to aircraft.
DOST-PHIVOLCS maintains close monitoring of Mayon Volcano and any new development will be communicated to all concerned stakeholders.
Source : Phivolcs
Yellowstone , United States :
Yellowstone’s current seismic swarm—what does it mean? February 19, 2018.
Yellowstone Caldera Chronicles is a weekly column written by scientists and collaborators of the Yellowstone Volcano Observatory. This week’s contribution is from Mike Poland, USGS research geophysicist and YVO Scientist-in-Charge, and Jamie Farrell, assistant research professor with the University of Utah Seismograph Stations and YVO Chief Seismologist.

Webicorder for station YMC (the closest station to the current swarm) for a 24-hour period spanning February 17-18, 2018. Each horizontal line is 30 minutes, and each spike is an earthquake. The vast majority of earthquakes are magnitudes of zero and below that may only have been recorded at this station and, therefore, are not locatable (an earthquake must be well recorded at 4 stations to be located).
Over the past several days, an earthquake swarm has been ongoing at Yellowstone. Before you read any more, keep in mind that swarms like this account for more than 50% of the seismic activity at Yellowstone, and no volcanic activity has occurred from any past such events. As of the night of February 18, over 200 earthquakes have been located in an area ~13 km (8 mi) NE of West Yellowstone, Montana. Many more earthquakes have occurred, but are too small to be located.
Does the location for this swarm sound familiar? It should… This is approximately the same place as last summer’s Maple Creek swarm, which included about 2400 earthquakes during June-September 2017. In fact, the current swarm may be just a continuation of the Maple Creek swarm, given the ongoing but sporadic seismicity in the area over the past several months.
The present swarm started on February 8, with a few events occurring per day. On February 15, seismicity rates and magnitudes increased markedly. As of the night of February 18, the largest earthquake in the swarm is M2.9, and none of the events have been felt. All are occurring about 8 km (5 mi) beneath the surface.

Close-up view of seismicity associated with the current swarm (red circles) compared to locations of the 2017 Maple Creek swarm (gray circles). YMC is the closest seismic station to the seismicity.
What is causing this swarm seismicity? And why do swarms always seem to be happening in this part of Yellowstone National Park? A view of historical earthquakes in the region shows that the area is a hotbed of seismicity.
The University of Utah Seismograph Stations, which is responsible for seismic monitoring in the Yellowstone region, uses a standard definition of an earthquake swarm—an increase in earthquake rates within a given area over a relatively concentrated period of time without a single large « mainshock. »
Swarms reflect changes in stress along small faults beneath the surface, and generally are caused by two processes: large-scale tectonic forces, and pressure changes beneath the surface due to accumulation and/or withdrawal of fluids (magma, water, and/or gas).
The area of the current swarm is subject to both processes. The largest historic earthquake in the region, the 1959 M7.3 Hebgen Lake event, was due to faulting that has its ultimate cause in the fact that the western United States is being pulled and stretched apart—this is what results in the « basin and range » topography of much of the region. But we also know that there is a tremendous amount of fluid in the subsurface, including hydrothermal water and gases that come to the surface at nearby Norris Geyser Basin—the hottest thermal area in Yellowstone National Park!

Map of Yellowstone earthquakes as located by the University of Utah Seismograph Stations from 1973 – 2017. Red circles are all quakes, and blue circles are earthquakes that were part of swarms.
The current and past earthquake swarms reflect the geology of the region, which contains numerous faults, as well as fluids that are constantly in motion beneath the surface. This combination of existing faults and fluid migration, plus the fact that the region is probably still « feeling » the stress effects of the 1959 earthquake, contribute to making this area a hotbed of seismicity and swarm activity.
While it may seem worrisome, the current seismicity is relatively weak and actually represents an opportunity to learn more about Yellowstone. It is during periods of change when scientists can develop, test, and refine their models of how the Yellowstone volcanic system works. Past seismic swarms like those of 2004, 2009, and 2010, have led to new insights into the behavior of the caldera system. We hope to expand this knowledge through future analyses of the 2017 and 2018 seismicity.

The earthquakes, too, serve as a reminder of an underappreciated hazard at Yellowstone—that of strong earthquakes, which are the most likely event to cause damage in the region on the timescales of human lives. As recently as 1975 there was a M6.5 event in the area of Norris Geyser Basin.
In future columns, we will be sure to share the results of research into Yellowstone’s seismic swarms. We will also keep you informed about current earthquake activity, both in this column and through our monthly updates. Stay tuned!
Source : YVO
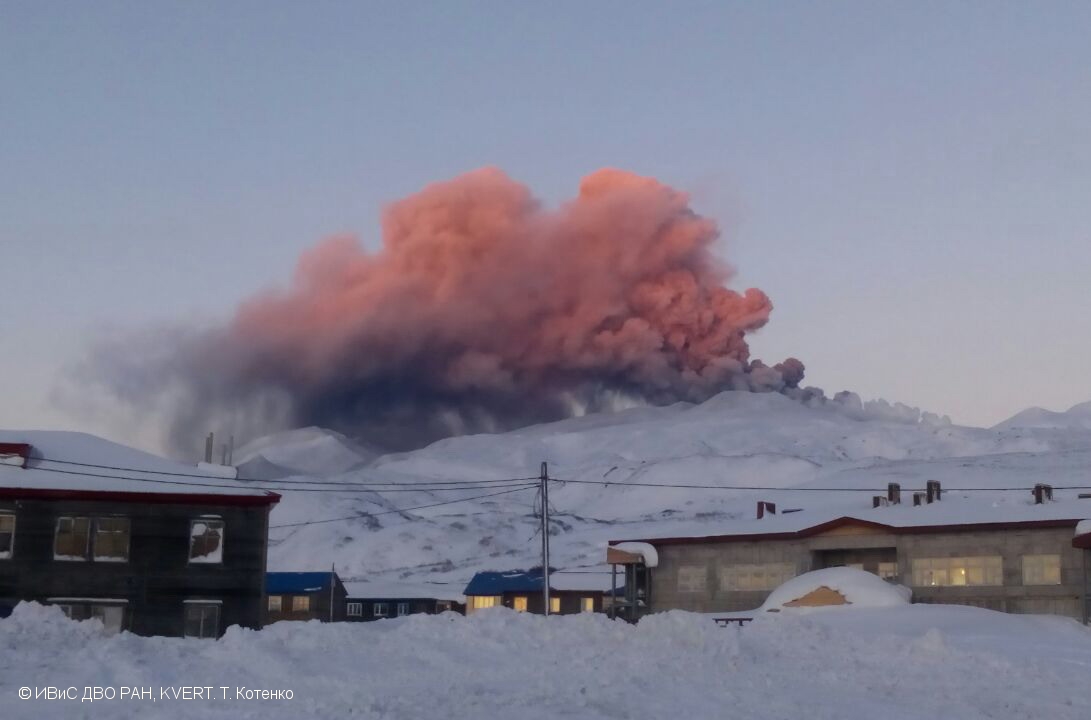
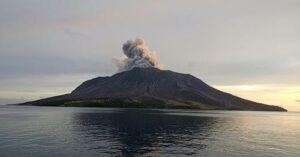
Ebeko , Kamchatka :
VOLCANO OBSERVATORY NOTICE FOR AVIATION (VONA).
Issued: February 23 , 2018.
Volcano:Ebeko (CAVW #290380)
Current aviation colour code:ORANGE
Previous aviation colour code:orange
Source:KVERT
Notice Number:2018-26
Volcano Location:N 50 deg 41 min E 156 deg 0 min
Area:Northern Kuriles, Russia
Summit Elevation:3791.68 ft (1156 m)
Volcanic Activity Summary:
According to visual data by volcanologists from Severo-Kurilsk, explosions sent ash up to 2 km a.s.l.; ash plume is drifting to the east from the volcano.
A moderate gas-steam with some amount of ash activity of the volcano continues. Ash explosions up to 16,400 ft (5 km) a.s.l. could occur at any time. Ongoing activity could affect low-flying aircraft and airport of Severo-Kurilsk.
Volcanic cloud height:
6560-6560 ft (2000-2000 m) AMSL Time and method of ash plume/cloud height determination: 20180223/2142Z – Visual data
Other volcanic cloud information:
Distance of ash plume/cloud of the volcano: 3 mi (5 km)
Direction of drift of ash plume/cloud of the volcano: E / azimuth 90 deg
Source : Kvert
Photo : T. Kotenko, IVS FEB RAS, KVERT , 19/1/2017
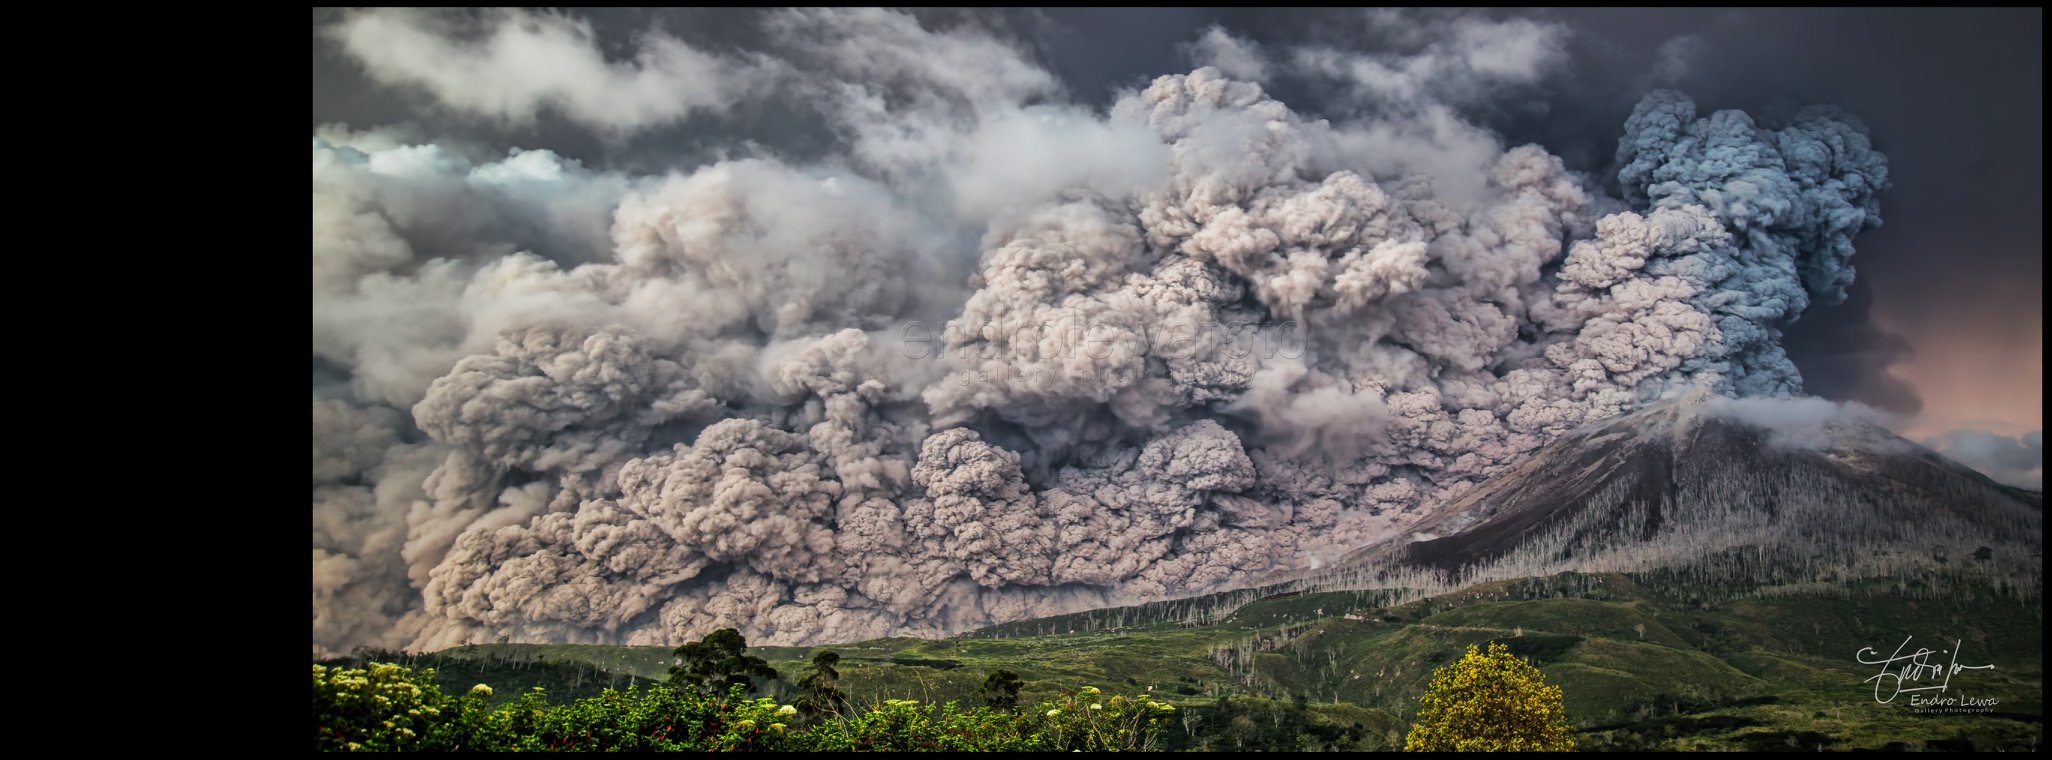
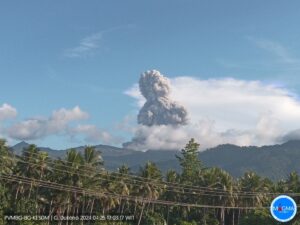
Sinabung , Indonesia :
Activity Level at Level IV (AWAS). The Sinabung (2460 m altitude) has been erupting constantly since 2013.
Since yesterday until this morning the volcano has been observed until it is covered with fog. The smoke coming out of the crater could be observed, white in color, moderate, up to 100/500 m above the summit. The wind blows slightly to moderately to the east, west, southwest and north.
According to the seismographs , on February 23, 2018, it was noted:
1 eruption earthquakes
6 low frequency earthquakes
2 phase / hybrid earthquakes
Recommendations:
Communities / visitors should not do activities within 3 km of the summit, and by sector, 7 km to the South-South-East, 6 km East-South-East and 4 km to the South-East. km northeast.
The deposits formed a dam upstream on the Laborus River. People living in downstream river basins and around the Laborus River need to be vigilant because these dams can collapse at any time and no longer retain water volume, resulting in downstream lahars / floods .
VONA: The last VONA code was sent with a RED color code, published on February 19, 2018 at 9:13 pm, related to the eruption at 8:53 pm where the height of the ash column was observed up to 7460 m above from the sea level, bowing to the southeast.
Source : VSI
Photo : Endro Lewa. 19/02/2018.

No comment yet, add your voice below!