April 03 , 2024.
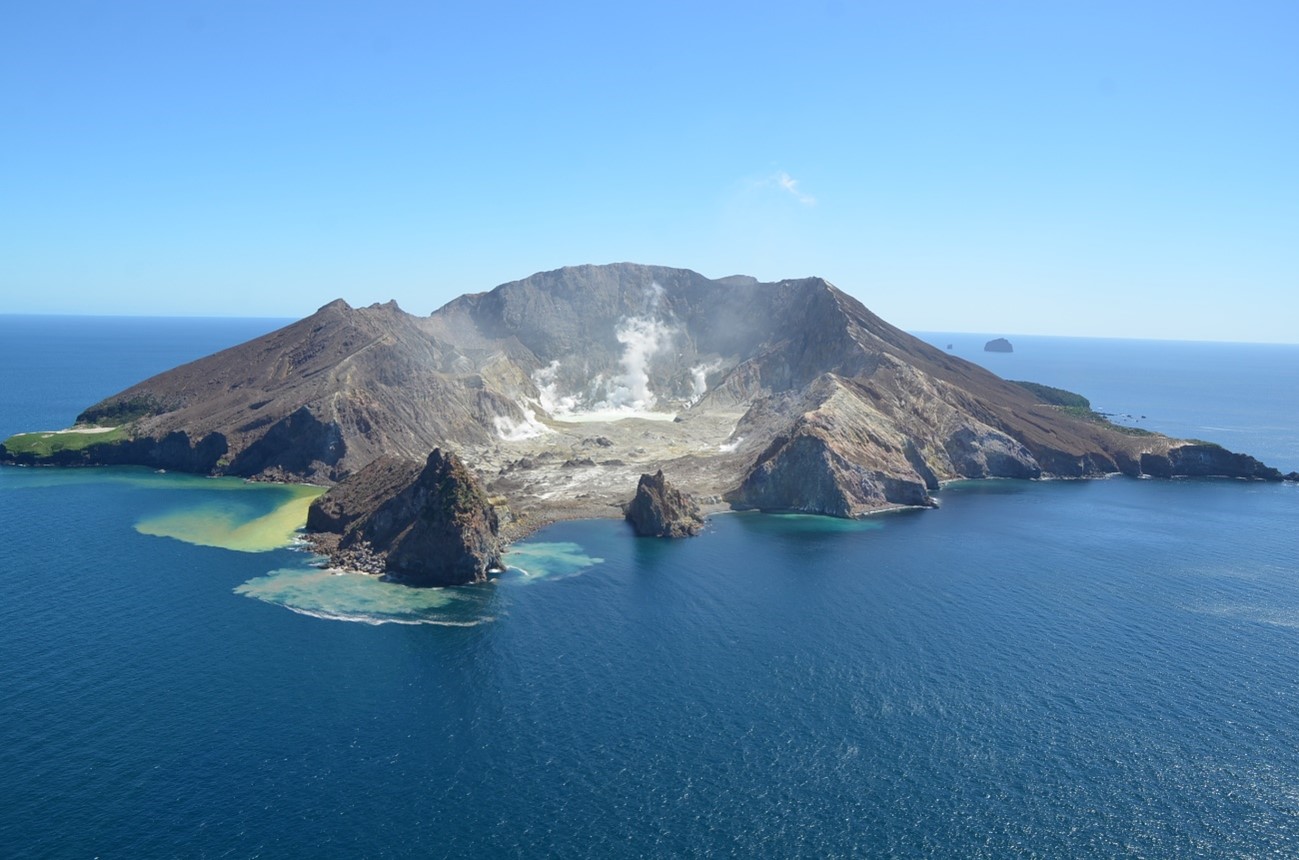
New Zealand , White island :
Whakaari/White Island continues to emit low levels of volcanic gas and steam accompanied by hydrothermal activity. The Volcanic Alert Level remains at Level 2. Published: Wed Apr 3 2024 1:00 PM
Recent flights over Whakaari/White Island to measure gas emissions and observe surface activity showed continued hydrothermal activity, including minor geysering. Low to moderate gas and steam emissions continue. There is no evidence of any volcanic eruptions, and the overall activity remains low. The Volcanic Alert Level remains at level 2.
Our latest airborne gas measurements from 26 March 2024 showed Sulphur Dioxide (SO2) levels increased marginally compared to the previous measurements a month prior (29 February 2024). Over the past twelve months there has been a slight upward trend of SO2 emissions but, overall, emissions of the three key gas species we monitor, Carbon Dioxide (CO2), Hydrogen Sulphide (H2S), and SO2, remain within the low to moderate range.
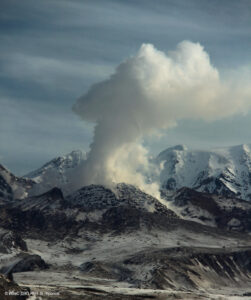
Images taken during an observation flight on 20 March 2024 showed minor geysering in parts of the crater area, caused by the continuous emission of steam and gas (grey areas in Figure 1) through muddy pools. The emitted gases also form sulphur and other salt deposits (yellow and white areas in Figure 1). The grey and green colours of the pools and the lake are mainly a result of dissolved sulphur combined with suspended sediments. These hydrothermal phenomena are typical for Whakaari/White Island. Steam and gas plumes are sometimes visible above the island from the coast, especially when the air is cool and relatively calm.
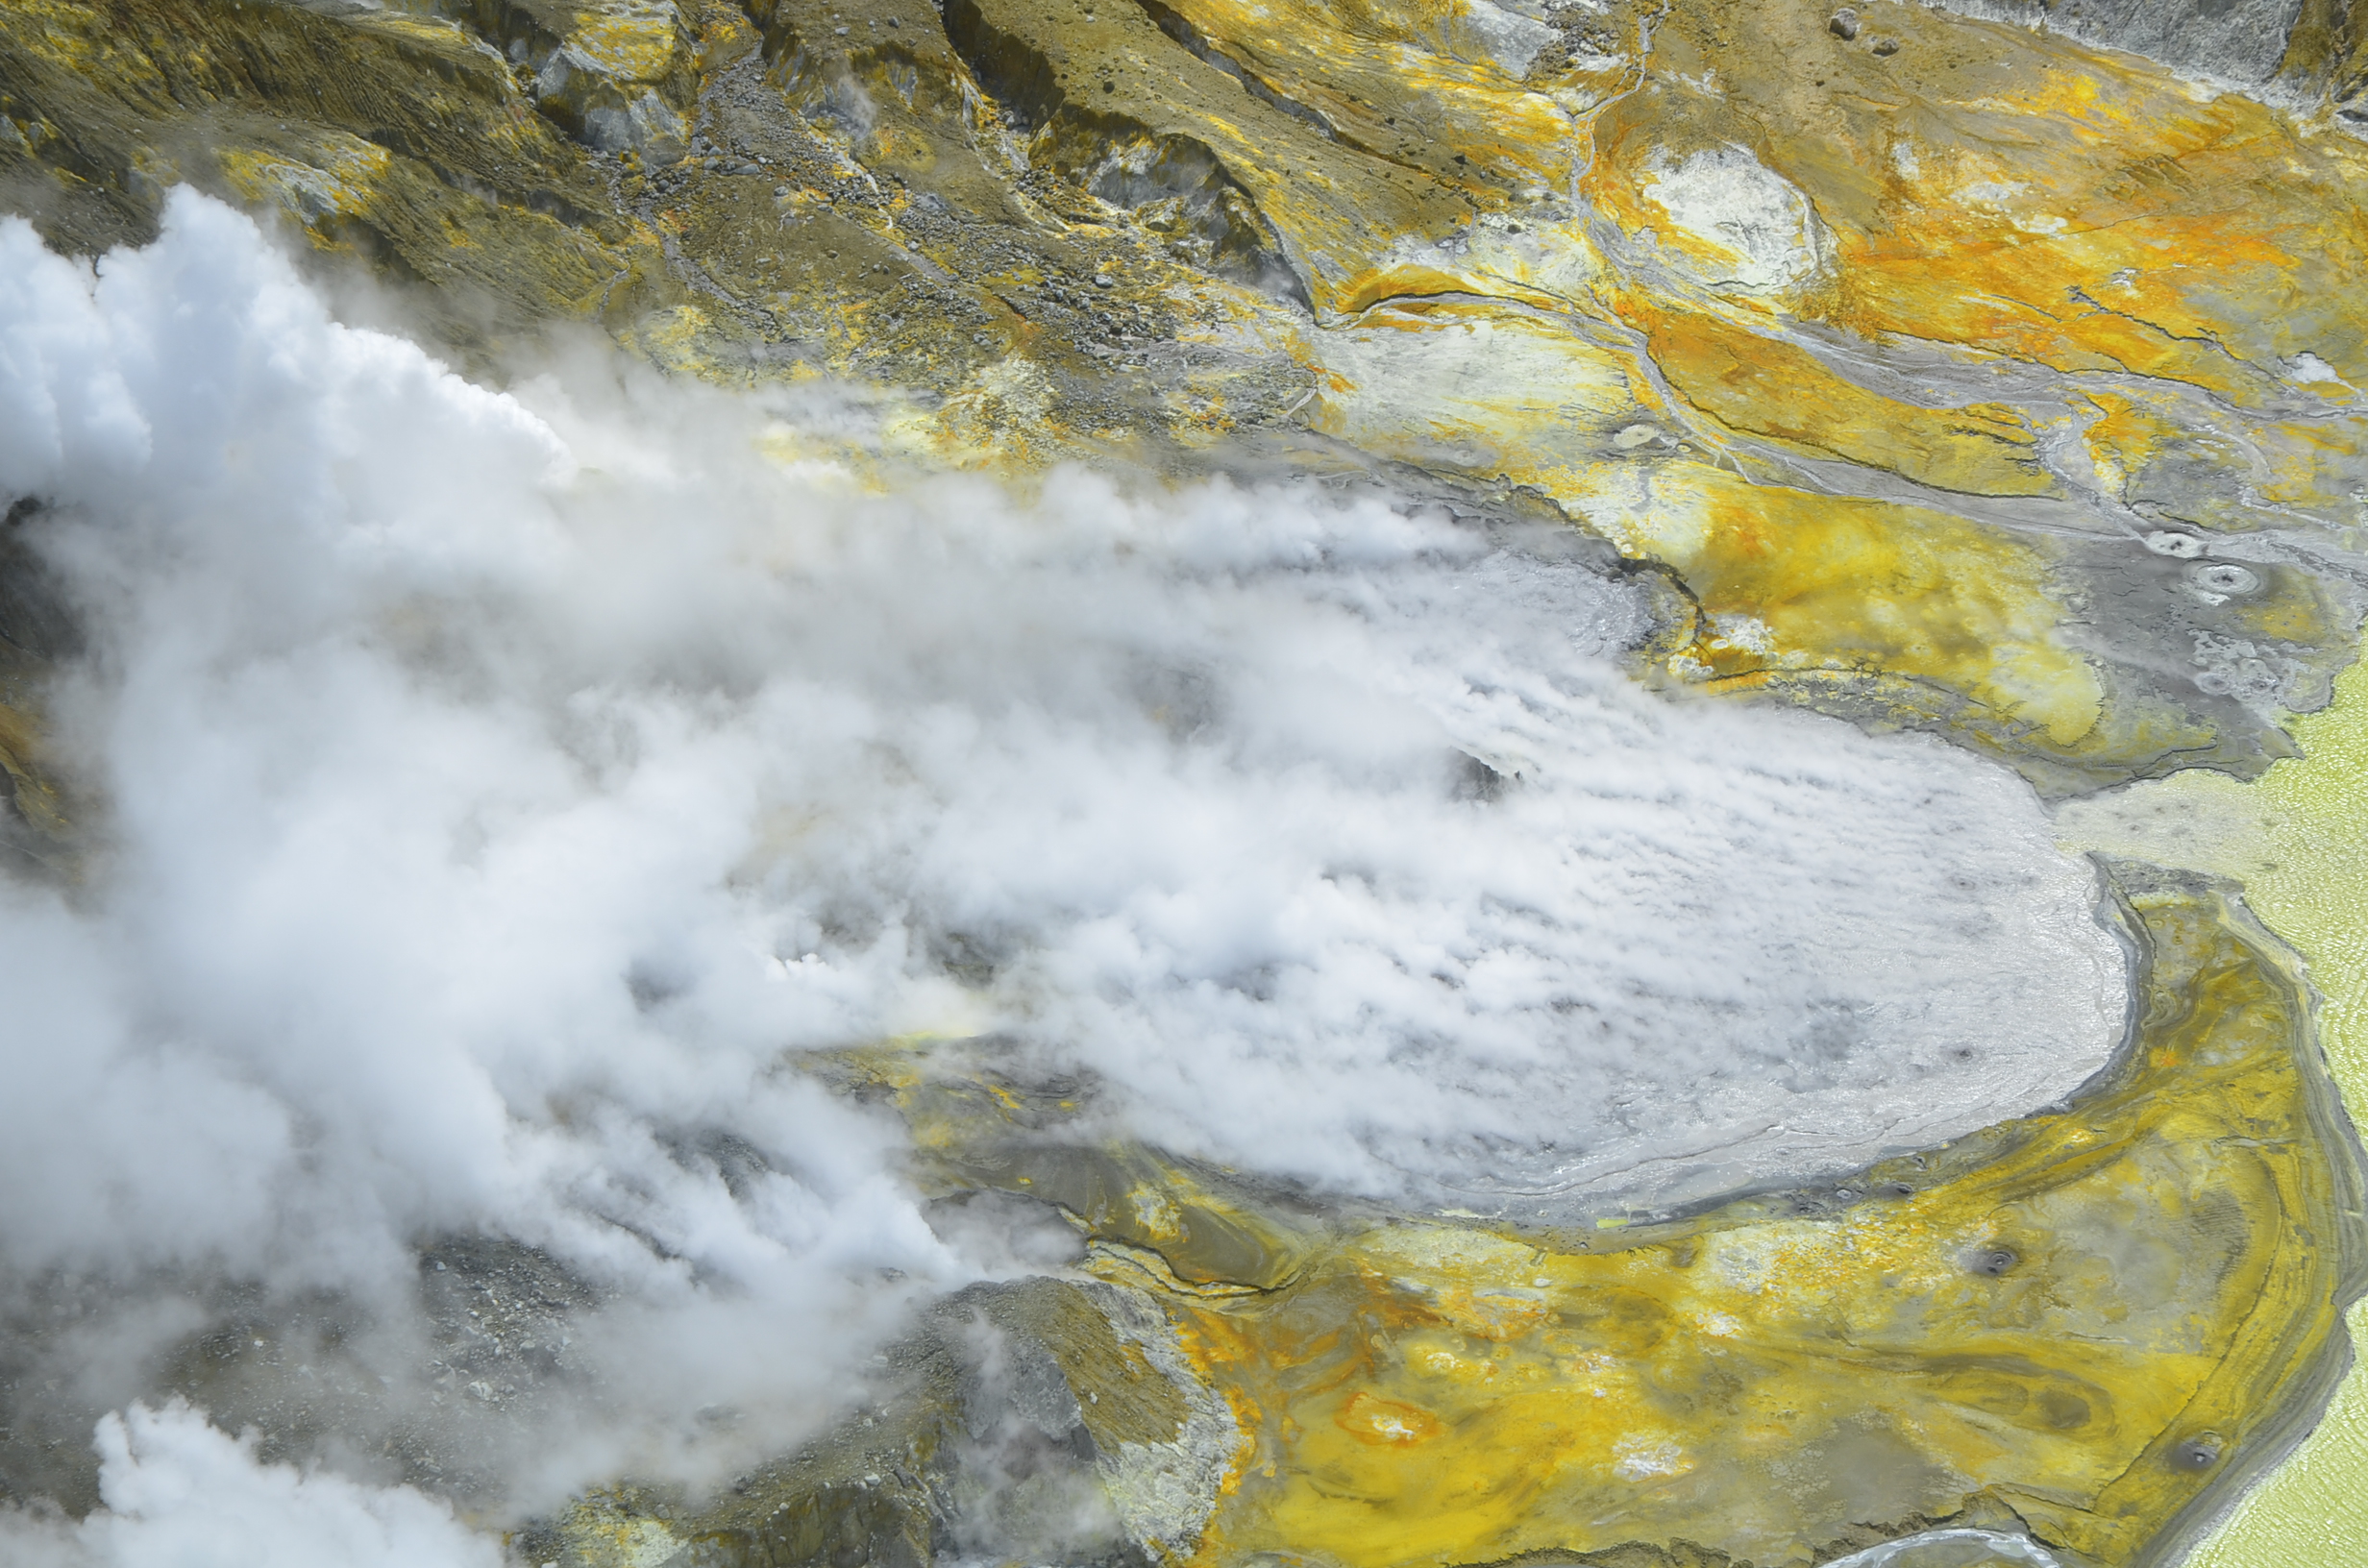
Figure 1: Aerial view of Whakaari/White Island, 20 March 2024 showing grey coloured pool in 2019 Crater (centre) with geysering. Photograph credit: Brad Scott, GNS Science.
Whilst we are currently unable to monitor the island in real-time with instrumentation on the ground, we continue to make observation and gas measurement flights every few weeks to monitor overall level of activity of the volcano. These are complemented by satellite-based ground deformation data approximately every 10 days, allowing us to monitor ground deformation trends. Daily satellite-based SO2 emission measurements complement our more sensitive but less frequent gas measurement flights. Neither of these satellite techniques have detected significant changes in the overall activity at the volcano over the past few months.
The Volcanic Alert Level remains at Level 2 (moderate to heightened unrest) and the Aviation Colour Code remains at Yellow, acknowledging the current level of activity, but also continuing to consider the greater level of uncertainty in our interpretation due to the current lack of consistent, usable real-time data.
Source : Geonet / Volcanologue de service : Yannik Behr.
Photos : Brad Scott, GNS Science.
United States , Yellowstone :
Monday, April 1, 2024, 12:16 PM MDT (Monday, April 1, 2024, 18:16 UTC)
44°25’48 » N 110°40’12 » W,
Summit Elevation 9203 ft (2805 m)
Current Volcano Alert Level: NORMAL
Current Aviation Color Code: GREEN
Recent Work and News
There were no major eruptions of Steamboat Geyser during the month of March, although minor eruptions have been ongoing since the middle of the month, suggesting that a major eruption could occur within the next few days to weeks. The geyser has erupted once so far in 2024 (on February 26).
Seismicity
During March 2024, the University of Utah Seismograph Stations, responsible for the operation and analysis of the Yellowstone Seismic Network, located 96 earthquakes in the Yellowstone National Park region. The largest event of the month was a minor earthquake of magnitude 2.7 located about 5 miles north of West Yellowstone, Montana, on March 9 at 8:50 PM MST.
March seismicity in Yellowstone was marked by two swarms:
1. A swarm of 24 earthquakes, located approximately 14 miles east-northeast of West Yellowstone, MT, occurred March 4–6. The largest earthquake in the sequence was a magnitude 1.3 on March 6 at 8:52 AM MST.
2. A swarm of 12 earthquakes, approximately 11 miles west of Old Faithful in Yellowstone National Park, occurred March 14–15. The largest earthquake in the sequence was a magnitude 1.5 on March 14 at 9:35 PM MDT.
Earthquake sequences like these are common and account for roughly 50% of the total seismicity in the Yellowstone region.
Yellowstone earthquake activity is currently at background levels.
Ground Deformation
During the month of March, continuous GPS stations in Yellowstone caldera showed subsidence, which has been ongoing since 2015, interrupted in summer months by a pause or slight uplift caused by seasonal changes related to snowmelt and groundwater conditions. The caldera has subsided by 2–3 cm (about 1 in) since the end of September. No significant deformation has occurred at Norris Geyser Basin since the end of summer.
Source : YVO
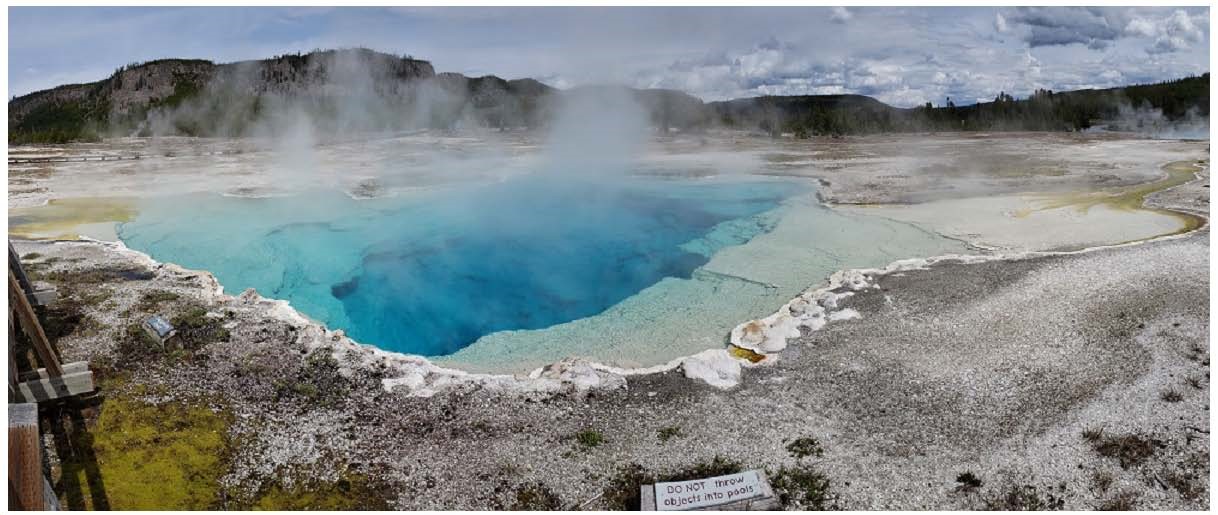
Photo : Sapphire Pool , YVO
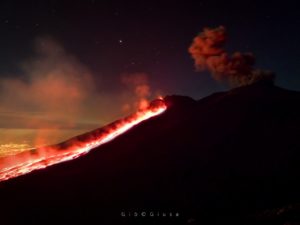
Italy , Stromboli :
WEEKLY BULLETIN, from March 25, 2024 to March 31, 2024. (issue date April 2, 2024)
SUMMARY STATEMENT OF ACTIVITY
In light of the monitoring data, it appears:
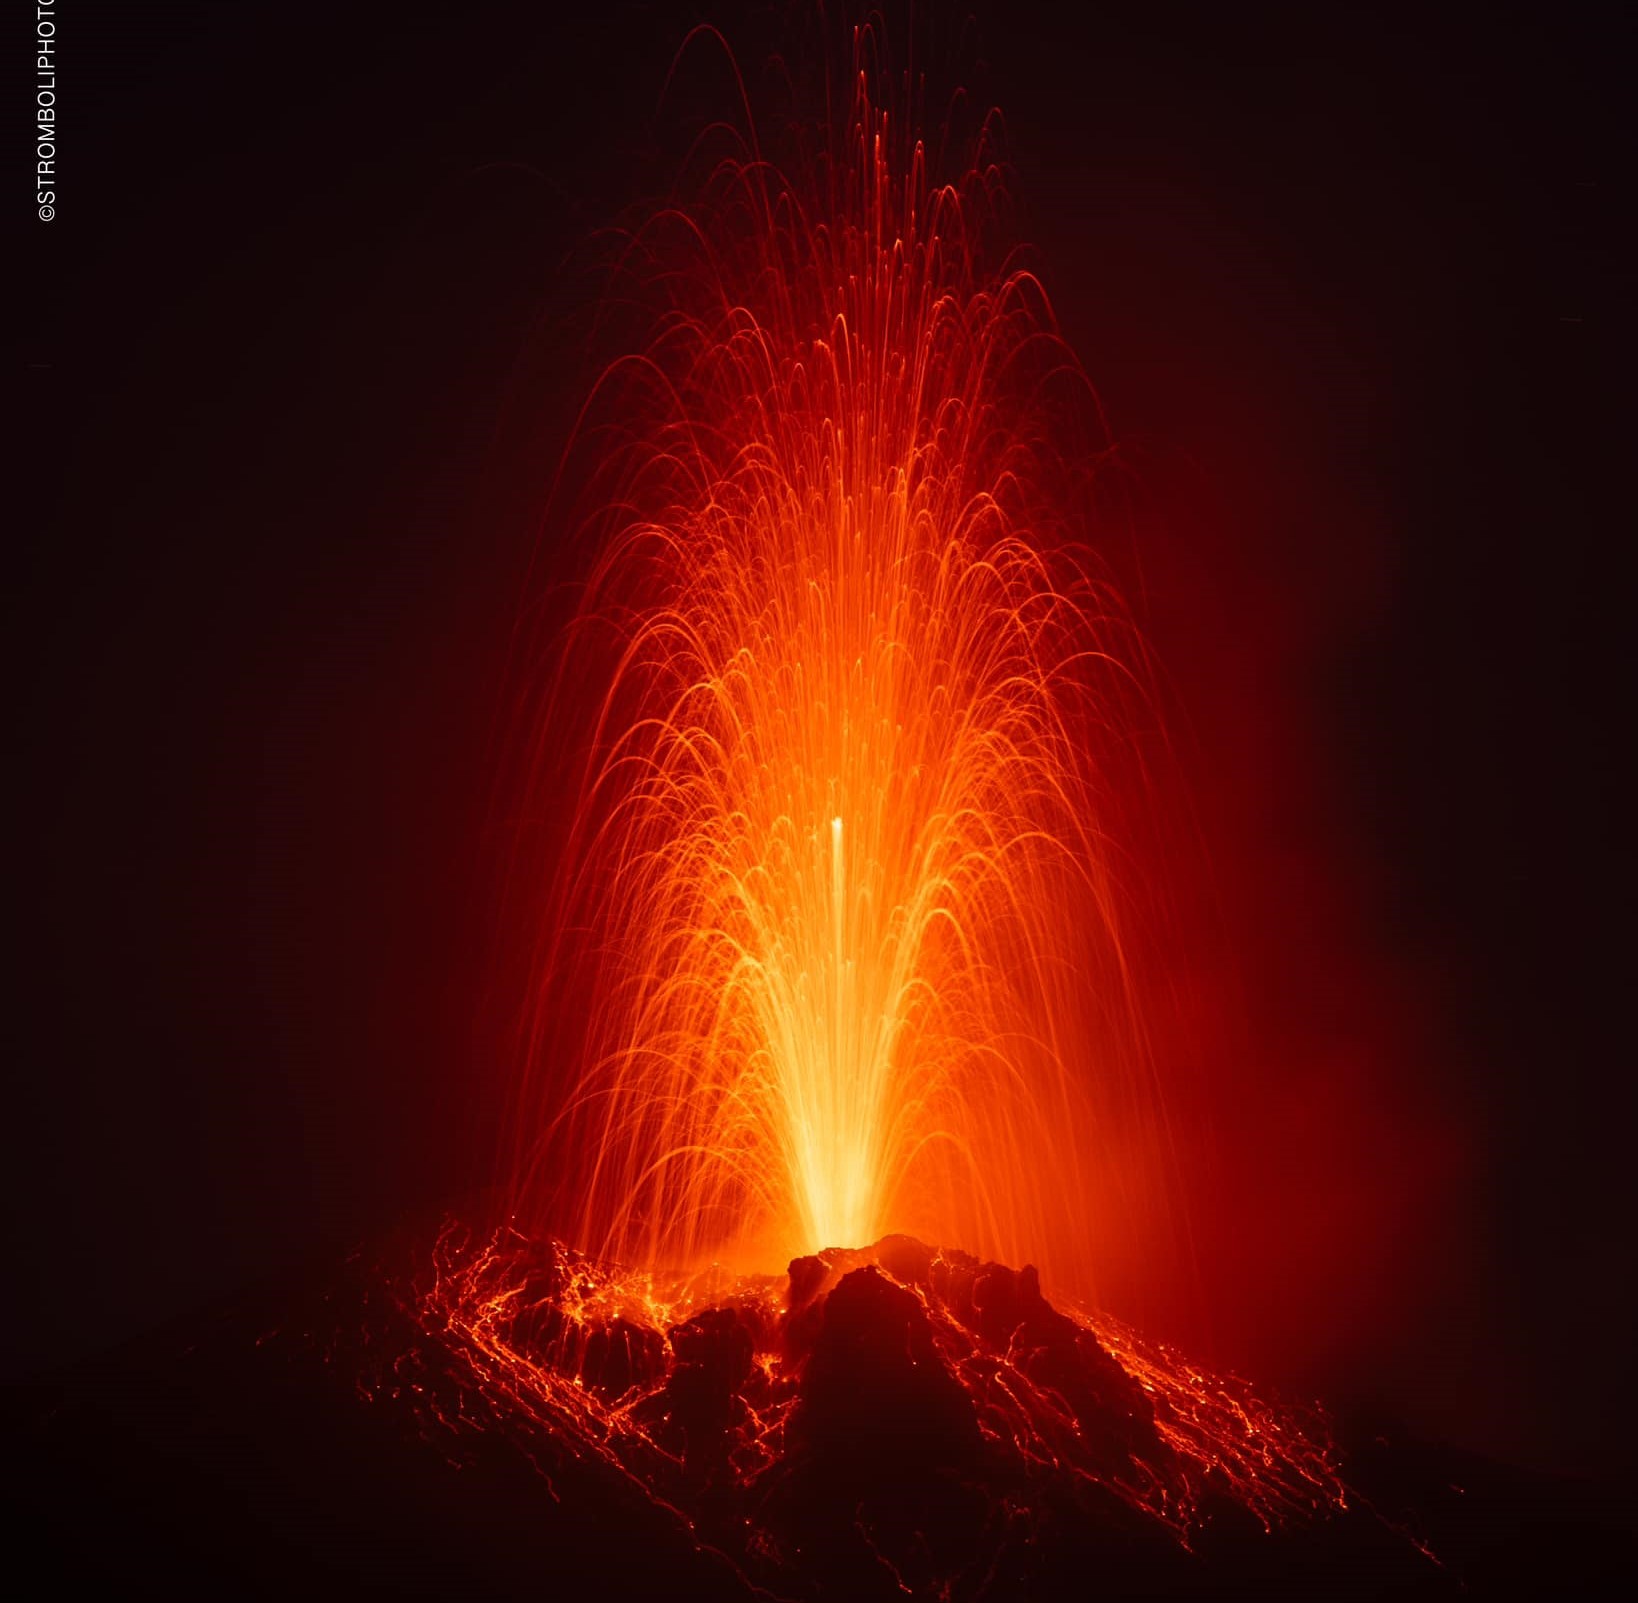
1) VOLCANOLOGICAL OBSERVATIONS: Normal Strombolian activity was observed during this period. The total hourly frequency was between the average values (5-13 events/h). The intensity of the explosions was low in the areas of the North and South-Central craters.
2) SISMOLOGY: The monitored seismological parameters do not show significant variations.
3) GROUND DEFORMATIONS: Ground deformation monitoring networks do not show significant variations.
4) GEOCHEMISTRY: SO2 flux at medium level
The CO2 flux in the summit zone is at average values.
C/S ratio in the plume: there are no updates.
Helium isotope ratio in the thermal aquifer slightly decreasing compared to average values.
CO2 flux in Scari: stable values at average levels.
5) SATELLITE OBSERVATIONS: Thermal activity observed by satellite was generally low level with some rare and isolated thermal anomalies of moderate level.
VOLCANOLOGICAL OBSERVATIONS
In the observed period, the eruptive activity of Stromboli was characterized through the analysis of images recorded by the INGV-OE surveillance cameras located at Pizzo (SPT), at altitude 190m (SCT-SCV) and at Punta dei Corvi (SPCT). and thanks to drone surveys carried out on March 18 and 19. The explosive activity was mainly produced by 2 (two) eruptive vents located in the northern area of the crater and by 2 (two) vents located in the south central area.
Observations of explosive activity captured by surveillance cameras
In the area of the North crater (N), with a mouth located in sector N1 and a mouth located in sector N2, explosive activity was observed which was constant in sector N1 and sporadic in sector N2. The intensity, in both sectors, was low (less than 80 m in height). The products emitted in the eruption were mainly coarse materials (bombs and lapilli). The average frequency of explosions oscillated between 3 and 6 events/h.
In the South-Central (CS) zone, sectors C and S1 did not show significant activity. In sector S2, comprising two emission points, the explosions were mainly of low intensity (less than 80 m in height) and sometimes medium (less than 150 m in height) emitting fine materials sometimes mixed with coarse materials. The average frequency of explosions varied between 3 and 8 events/h.
Observations of March 18 and 19
On March 18 and 19, as part of the activities of the DPC-INGV Implementation Convention and in collaboration with the UN and Dynamo projects, observations were carried out using drones and observations from the ground at 400 meters of altitude, for the morpho-structural objectives of the crater area and the Sciara del Fuoco of Stromboli. Thanks to the processing of the acquired data, the digital terrain model was updated to 30 cm and the orthomosaic to 10 cm resolution of the Sciara del Fuoco and the North-West part of the crater area. The thermal survey highlighted the existence of two modest anomalies, the first delimited by a green rectangle located between 750 and 700 m altitude and 80 m long, the second delimited by a white circle has a width of approximately 50 m and is located between 700 and 650 m.

Shaded terrain, orthomosaic and thermal orthomosaic model of the Sciara del Fuoco and crater area updated on March 19 (respectively, A, B and C. In (D) RGB and (E) thermal detail of the anomaly thermal number 1 indicated in the green rectangle.
Anomaly number 1 has a relative temperature of 67° while number 2 has a relative temperature of 48° C (± 2°). These anomalies, not visible during the May 2023 survey but emerging during the survey last October, are located in the area of the upper part of the Sciara del Fuoco where the canyon was formed during the effusive activity of the fall 2022. The nature of these thermal anomalies is likely associated with the detachment and gravitational sliding of materials located on the crest and base of the canyon shoulder, exposing the underlying portions. Furthermore, it appears from the results that the edge of the N1 crater is elongated towards the North-West while in the S2 sector of the South-Central zone of the crater, the cone of scoria put in place over the last few months is visible. .
Source : INGV
Photos : Stromboli stati d’animo / Sebastiano Cannavo. , INGV.
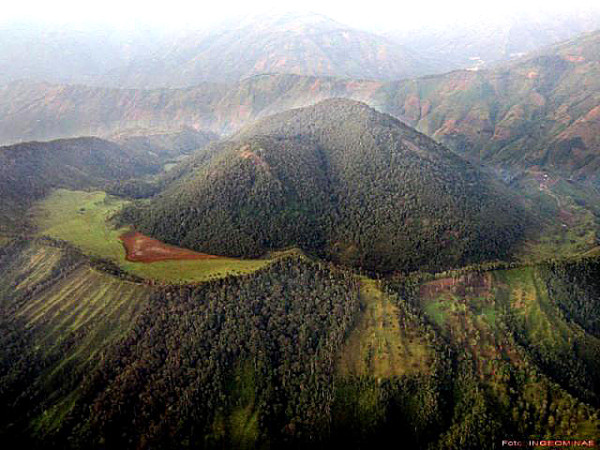
Colombia , Cerro Machin :
Weekly Activity Bulletin: Cerro Machín Volcano
Regarding the monitoring of the activity of the CERRO MACHÍN VOLCANO, the MINISTRY OF MINES AND ENERGY, through the COLOMBIAN GEOLOGICAL SERVICE (SGC), reports that:
For the week of March 26 to April 1, 2024, the recording of seismicity associated with the fracturing of rocks inside the volcanic edifice continued. Compared to the previous week, this seismic activity presented a notable decrease in the number of earthquakes recorded and the seismic energy released. The earthquakes were located on the western flank and in the central zone of the volcanic edifice, at distances less than 2 km from the main dome.
Depths varied between 1 and 5 km. The largest earthquake was 1.4, corresponding to the earthquake recorded on March 26 at 12:03 a.m. m., at a depth of 3 km. This earthquake was reported as felt by residents near the volcano.
The other parameters measured and used for the diagnosis of volcanic activity did not present significant changes during the period evaluated.
The alert status for volcanic activity remains at: YELLOW ALERT: ACTIVE VOLCANO WITH CHANGES IN THE BEHAVIOR OF THE BASE LEVEL OF MONITORED PARAMETERS AND OTHER MANIFESTATIONS.
Source et photo : SGC
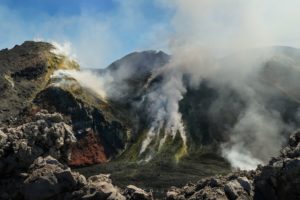
Italy / Sicily , Etna :
MONTHLY BULLETIN, March 2024 (issue date April 2, 2024)
SUMMARY STATEMENT OF ACTIVITY
In light of the monitoring data, it appears:
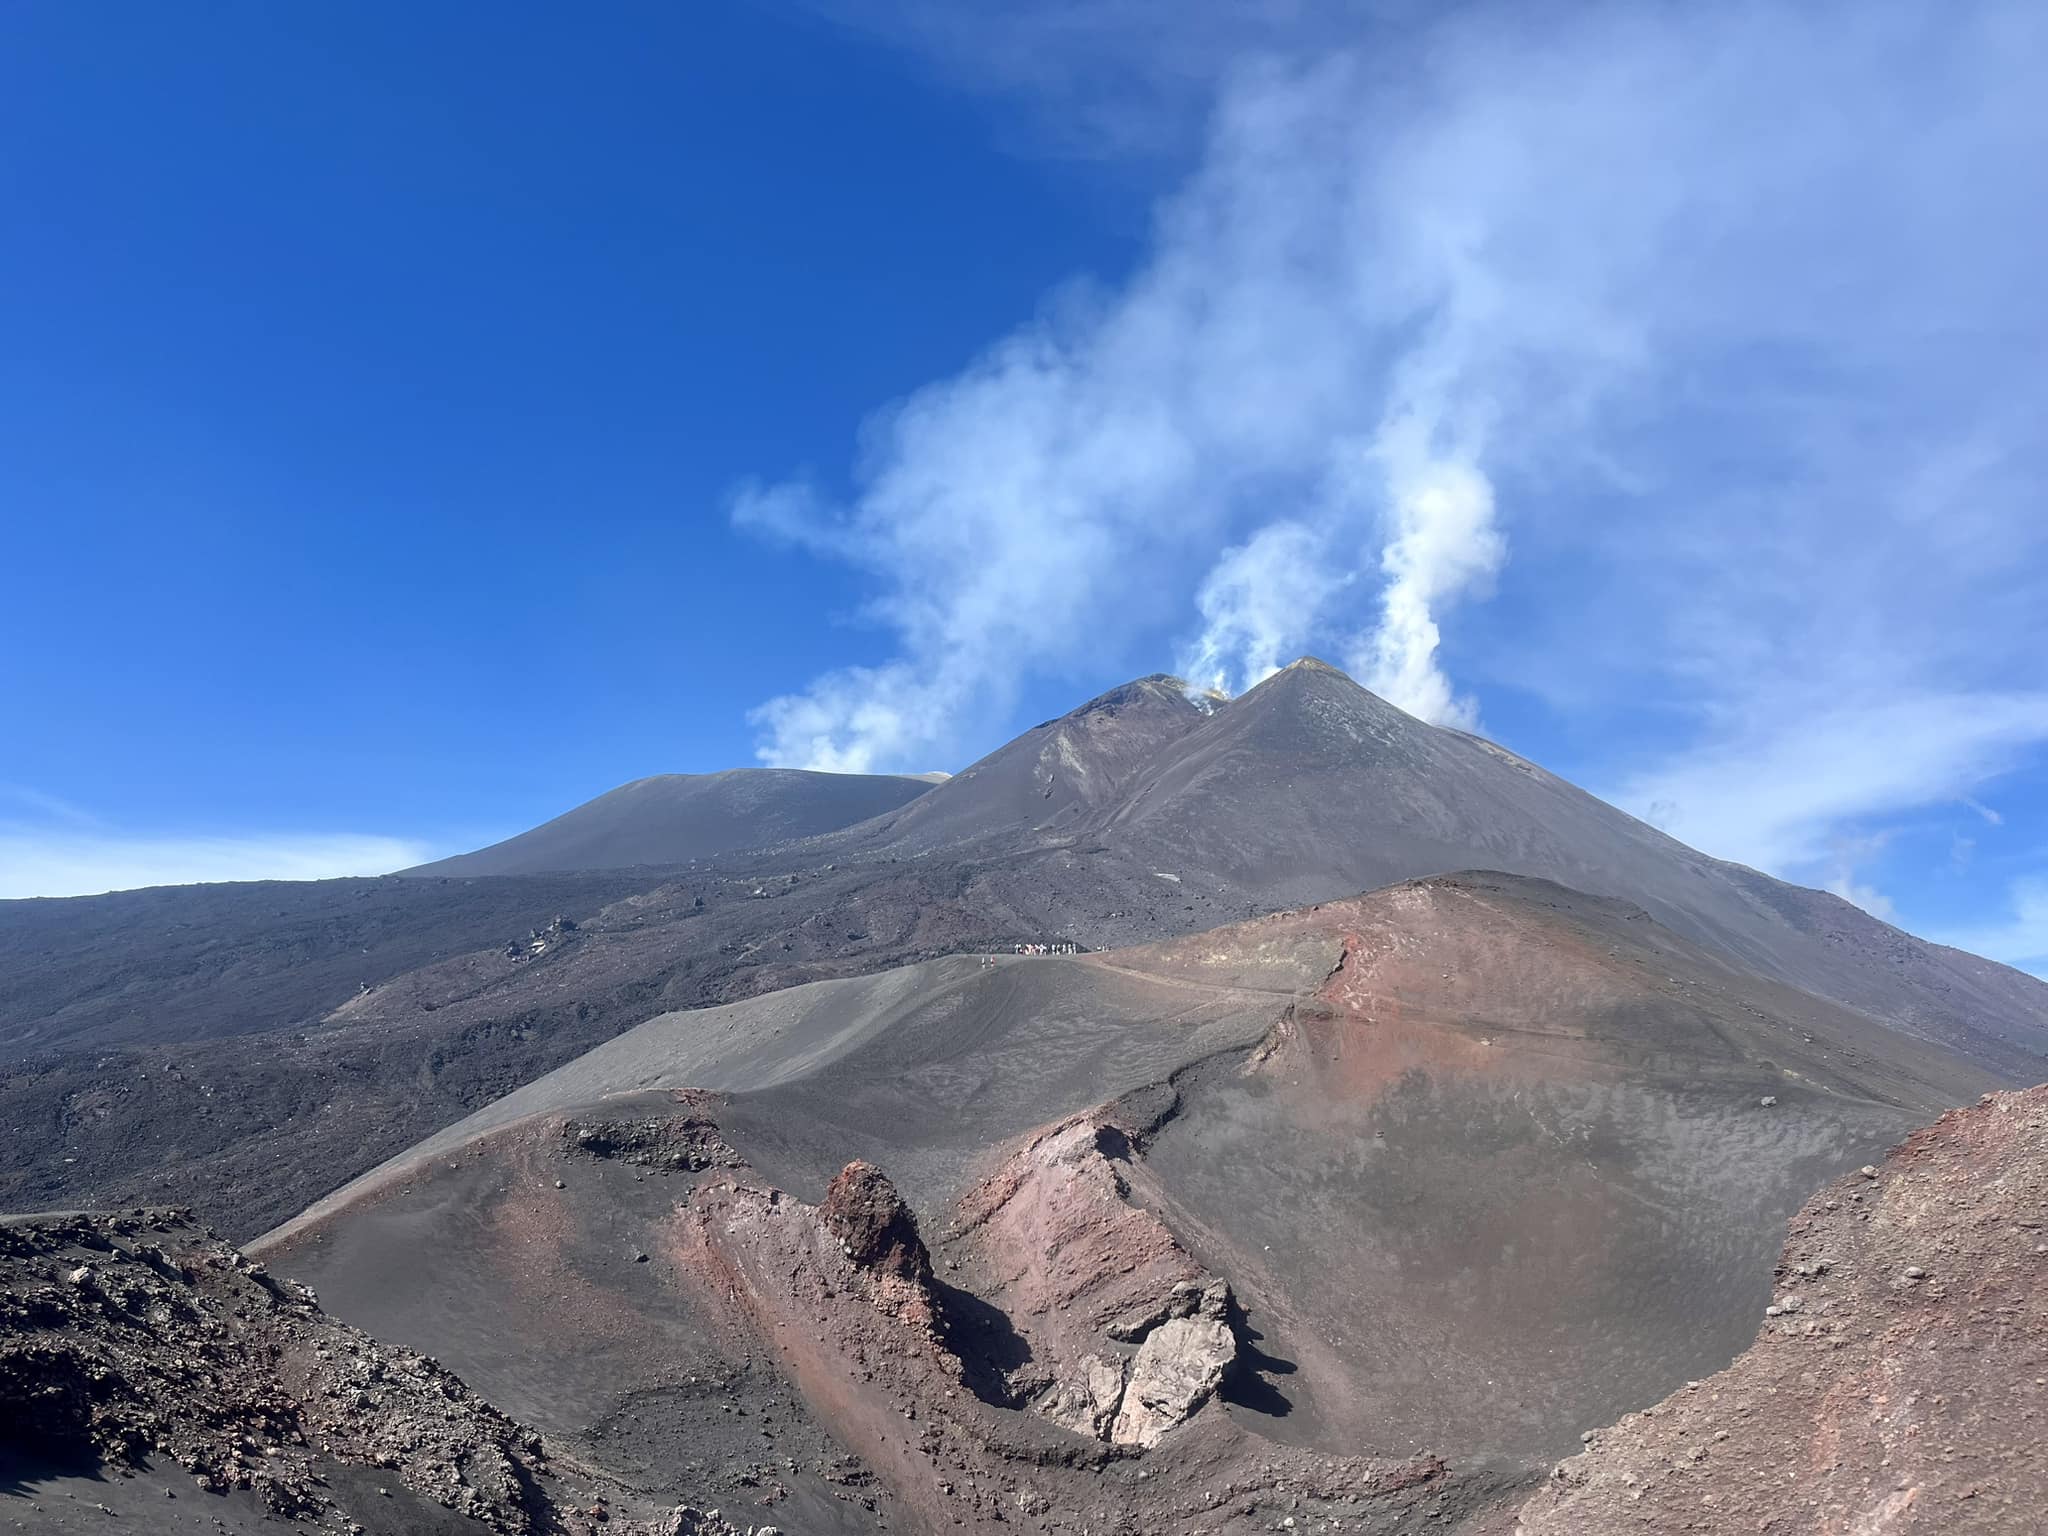
1) VOLCANOLOGICAL OBSERVATIONS: Degassing activity mainly affecting the Bocca Nuova Crater and secondarily the South-East Crater.
2) SEISMOLOGY: Low seismic activity due to fracturing. Average amplitude of volcanic tremors fluctuating mainly in the average level.
3) INFRASOUND: Moderate infrasound activity with sources located near the Bocca Nuova crater.
4) GROUND DEFORMATIONS: During the last month of observation, the ground deformation monitoring networks did not record any significant variations.
5) GEOCHEMISTRY: SO2 flux at an average and increasing level
The CO2 flow is stable, at average values
The partial pressure of CO2 dissolved in groundwater presents values included in seasonal variability.
The helium isotopic ratio is high.
6) SATELLITE OBSERVATIONS: Thermal activity observed by satellite was generally weak.
VOLCANOLOGICAL OBSERVATIONS
Between the end of February and March, the monitoring of the volcanic activity of Etna was carried out through the analysis of images from the surveillance camera network of the National Institute of Geophysics and Volcanology, Osservatorio Etneo (INGV-OE) and thanks to a helicopter flight carried out by INGV staff.
During the period, the activity of the summit craters did not show variations compared to the previous period (Rep. N. 09/2024 ETNA) and in general compared to what has been observed since the beginning of 2024. The state of activity of Etna was characterized by ordinary degassing activity mainly affecting the two craters BN1 and BN2 located inside the Bocca Nuova crater. As already reported in previous months, it is a degassing with impulsive regime and emission of gas at high temperature which feeds visible glows at night and with the formation of vapor rings at the level of BN2.
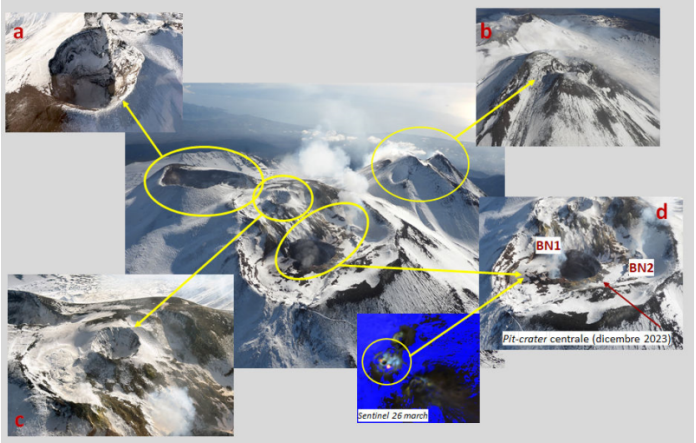
Images of the summit area of Etna taken during the flyover carried out on approximately March 3. by INGV staff. The degassing of Etna is essentially dominated by Bocca Nuova and secondarily by the South-East Crater (d, b). Finally, Voragine continues to be obstructed and devoid of activity while the North-East Crater presents very weak intra-crater fumarolic activity (c, a)
The second crater which contributes to the degassing of the Etna plume is represented by the South-East crater, by a field of fumaroles located on the northern edge of the crater and by a vent located in the eastern area of the crater (Fig.3.2, 3.3). Finally, the Northeast crater continues to show weak degassing from a limited area of intra-crater fumaroles, while Voragine shows no activity.
Source : INGV
Photos : etnaguide ( archive) : INGV