June 05 , 2020.
Italy , Stromboli :
Weekly bulletin from May 25, 2020 to May 31, 2020 (issue date June 02, 2020)
SUMMARY OF THE STATUS OF THE ACTIVITY
In light of the monitoring data, it is underlined:
1) VOLCANOLOGICAL OBSERVATIONS: During this period, a normal explosive activity of strombolian type was observed accompanied by degassing activities. The hourly frequency of explosions fluctuated between low values (4 events / h on May 28) and medium-low values (10 events / h on May 31). The prolongation of the low explosive activity already described in previous periods should be emphasized. The intensity of the explosions was mainly low in the area of the North crater and medium in the area of the Center-South crater.
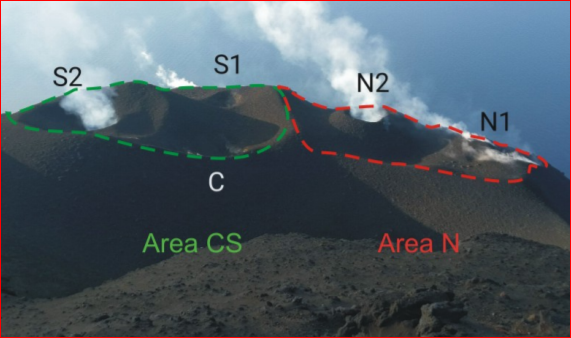
The terrace of the Stromboli crater seen from the Pizzo taken during the inspection carried out by INGV-OE staff in Catania on February 22, 2020, with the delimitation of the areas of the Center-South and North crater (photo by F. Ciancitto) .
2) SEISMOLOGY: The seismological parameters do not present significant variations.
4) DEFORMATIONS: Data from the Stromboli soil deformation monitoring networks did not show any significant changes last week.
5) GEOCHEMISTRY: The flow of SO2 is at an average level. The last measurement of the CO2 / SO2 ratio is at an average value (last update on 02/09/2020). The isotopic ratio of helium remains on average values (last update of 09/03/2020). There is no update on the CO2 released by the soil.
6) SATELLITE OBSERVATIONS: The thermal activity in the summit area is at a medium-low level.

In the North zone, the explosions were mainly of low intensity (less than 80 m in height) emitting coarse materials (lapilli and bombs). The average frequency of explosions in the North zone varied between 1 and 7 events / h, while the explosive activity of the Center-South zone produced explosions of mainly coarse material (lapilli and bombs) mixed with fine materials ( ash) with medium intensity (less than 150 m in height). The frequency of explosions in the Center-South zone varied between 1 and 5 events / h.
The amplitude of the volcanic tremor generally had medium-low values.
Source : INGV.
Read the whole article : file:///C:/Users/Utilisateur/AppData/Local/Packages/Microsoft.MicrosoftEdge_8wekyb3d8bbwe/TempState/Downloads/BollettinoStromboli20200602%20(1).pdf
Photos : INGV , Webcam.
Costa Rica , Turrialba / Poas / Rincon de la Vieja :
Turrialba volcano:
Lat: 10.025 ° N; Long: 83,767 ° W;
Height: 3340 m above sea level
Current activity level: 2 (active volcano)
Potentially associated hazards: gas, ash emission, proximal ballistic projections.
No ash emission was detected. Seismicity remains stable. The trend of contraction and collapse of the Turrialba-Irazú massif has been accelerating since the end of March 2020. The H 2 S / SO 2 ratio shows a trend of more than H 2 S, the CO 2 / S ratio remains stable. The flow of SO 2 is also stable.
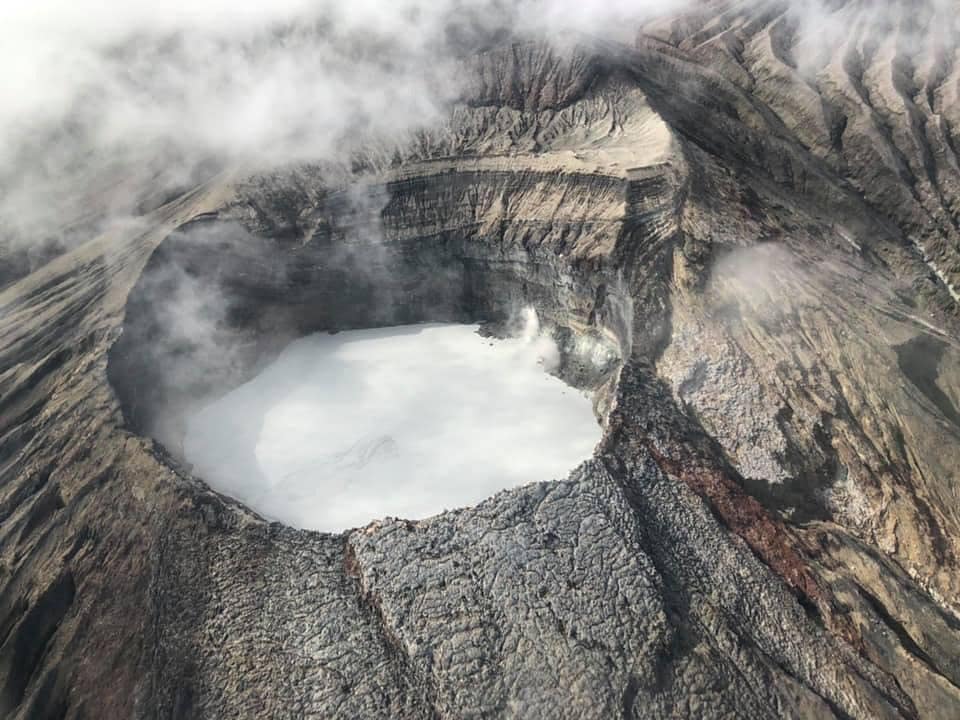
Poas Volcano:
Lat: 10.2 ° N; Long: 84.233 ° W;
Height: 2780 m above sea level
Current activity level: 2 (active volcano)
Potentially associated hazards: gas, groundwater eruptions, proximal ballistic projections.
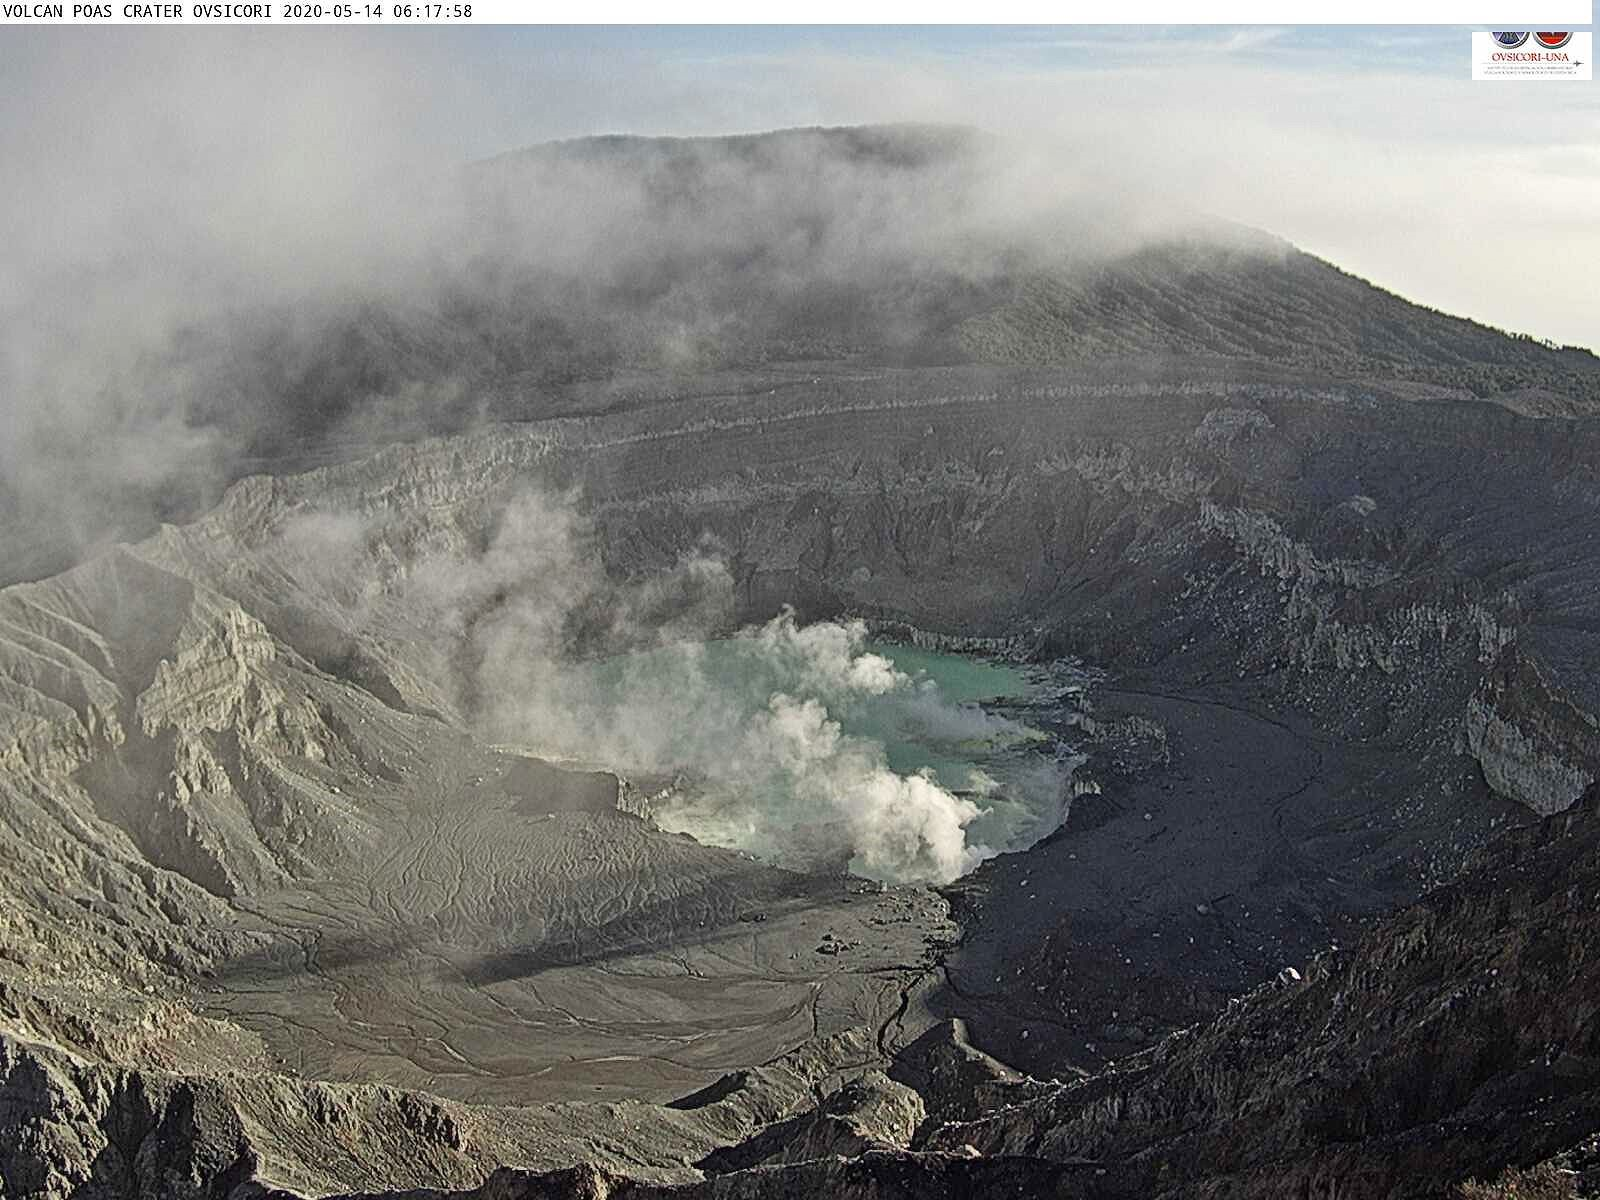
No eruption was detected. A decrease in seismic activity is observed, in particular in the number of daily LP type events. Deformation monitoring shows stability with a slight tendency to extend. The SO 2 / CO 2 ratio peaked during the week but generally has a downward trend. The H 2 S / SO 2 ratio is a little high. The flow of SO 2 is stable around 100 tonnes / day. No peak of high SO 2 concentration was measured at the level of the national park (max. 3 ppm). Due to heavy rains last week, the level of the lake increased by more than 1 m, which means that the volume of the lake increased by more than 60% in 2 weeks.
Rincon de la Vieja volcano:
Lat: 10.83 ° N; Long: 85.324 ° W;
Height: 1895 m above sea level
Current activity level: 3 (erupting volcano)
Potentially associated hazards: gas, phreatic eruptions, proximal ballistic projections, lahars.
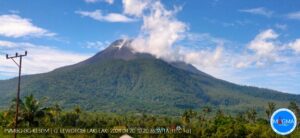
The activity of the volcano was significant, with a sequence of more than 70 eruptions and exhalations in a few hours on May 25 at the end of the day. On May 26 at 8:05 p.m., the volcano erupted at night (no visibility), generating an ash fall reported to the northwest of the volcano and up to 17 km to the west (Nueva Zelandia, Los Ángeles , Parque Eólico, Las Lilas, Consuelo and Quebrada Grande). On May 25, 26 and 27, direct observations showed projections rising to a few hundred meters and a gas plume rising to 1500-2000 m above the crater. No lahar associated with these eruptions was observed. From May 28 to 29, activity began to decrease in frequency, amplitude of the eruptions and the level of the seismic signal. Such behavior had been observed since mid-May, before developing again on May 25. The recording of the activity is still confirmed mainly with infrasound and VT type events shallow under the crater. Geodetic measurements show inflation in March and stagnation in April and May. Measurements were made with portable DOAS on May 28 and 29 and a flow of approximately 100 t / d of SO 2 was measured, which is a value similar to the measurements of previous years. No thermal anomaly was detected by the MODIS analysis, no change was observed in the geochemical analyzes in some of the waters and gases of the hot springs and the fumarole fields around the volcano, soon a sampling of others nearby hot springs will be carried out.
Source : Ovsicori .
Photos : Dr Paulo ruiz , Ovsicori , Chris Allen de Sunquest Helitours.
Japan , Sakurajima ( Aira) :
31.593°N, 130.657°E
Elevation 1117 m
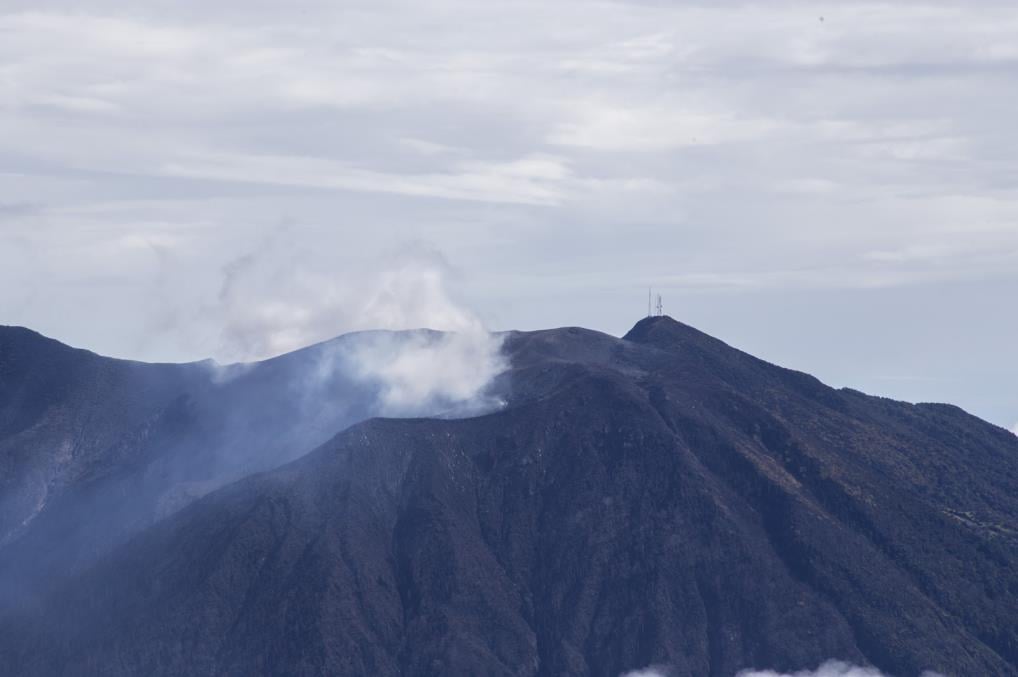
JMA reported that during 18-25 May incandescence from Minamidake Crater (at Aira Caldera’s Sakurajima volcano) was visible nightly. There were 17 explosive events and five eruptive events with plumes rising as high as 2.8 km above the crater rim. Material was ejected 800-1,300 m away from the crater. The daily sulfur dioxide emission rate was high; it was just over 1,200 tons per day on 22 May. The Alert Level remained at 3 (on a 5-level scale).
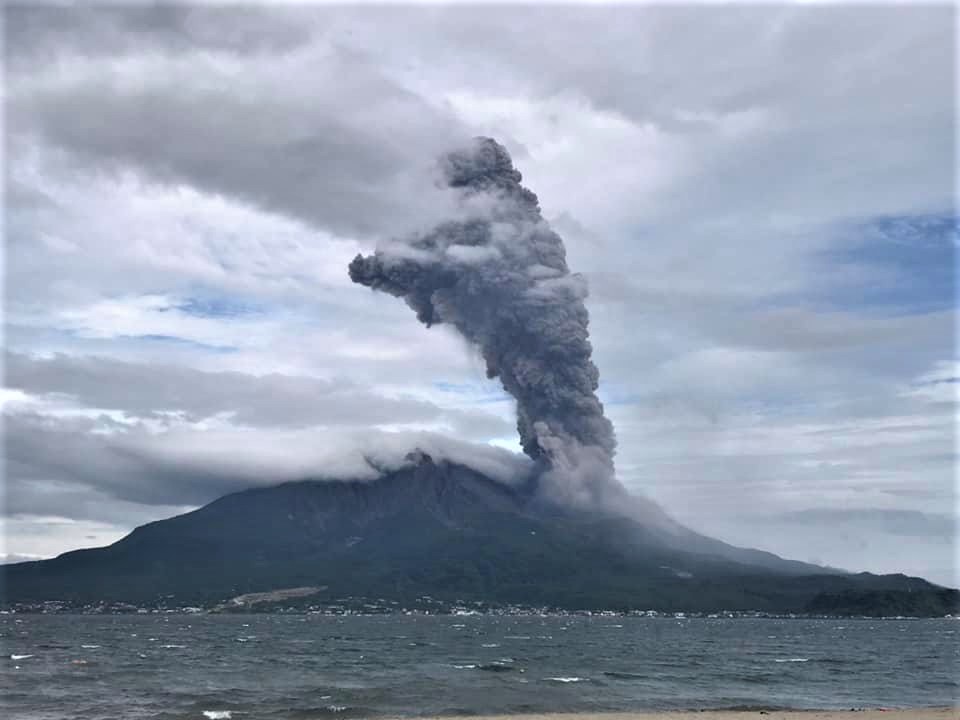
The Aira caldera in the northern half of Kagoshima Bay contains the post-caldera Sakurajima volcano, one of Japan’s most active. Eruption of the voluminous Ito pyroclastic flow accompanied formation of the 17 x 23 km caldera about 22,000 years ago. The smaller Wakamiko caldera was formed during the early Holocene in the NE corner of the Aira caldera, along with several post-caldera cones. The construction of Sakurajima began about 13,000 years ago on the southern rim of Aira caldera and built an island that was finally joined to the Osumi Peninsula during the major explosive and effusive eruption of 1914. Activity at the Kitadake summit cone ended about 4850 years ago, after which eruptions took place at Minamidake. Frequent historical eruptions, recorded since the 8th century, have deposited ash on Kagoshima, one of Kyushu’s largest cities, located across Kagoshima Bay only 8 km from the summit. The largest historical eruption took place during 1471-76.
Source : GVP. Japan Meteorological Agency (JMA).
Photo : Koki Arima.
Hawaii , Kilauea :
19°25’16 » N 155°17’13 » W,
Summit Elevation 4091 ft (1247 m)
Current Volcano Alert Level: NORMAL
Current Aviation Color Code: GREEN
Activity Summary:
Kīlauea Volcano is not erupting. Monitoring data for the month of May show variable but typical rates of seismicity and ground deformation, low rates of sulfur dioxide emissions, and only minor geologic changes since the end of eruptive activity in September 2018.

Portions of Crater Rim Drive are visible in three locations within this photo, which is looking north. Prior to 2018, Crater Rim Drive used to cross the southwest portion of Kīlauea Caldera. The collapse events of 2018 made the road impassable, as parts became severely damaged due to earthquakes, or completely collapsed. In the bottom half of this photo, fragments of the road are visible in the left center, the center of the image just below the lake, and the bottom right corner. USGS photo by K. Mulliken.
Observations:
Monitoring data have shown no significant changes in volcanic activity in May.
Rates of seismicity over the month were about 25 percent lower than during the past month. Sulfur dioxide emission rates are low at the summit and are below detection limits at Puʻu ʻŌʻō and the lower East Rift Zone. The crater lake at the bottom of Halema’uma’u continues to slowly expand and deepen. As of June 3rd, the lake depth was approximately 36 meters or 118 feet.
During the past month, summit tiltmeters showed a slight increase in inflationary tilt, consistent with an increase in the rate of magma entering the volcano’s shallow storage system. Additionally, tiltmeters recorded two deflation-inflation (D-I) events during the same time period, half as many as April 2020 and substantially lower than prior months.
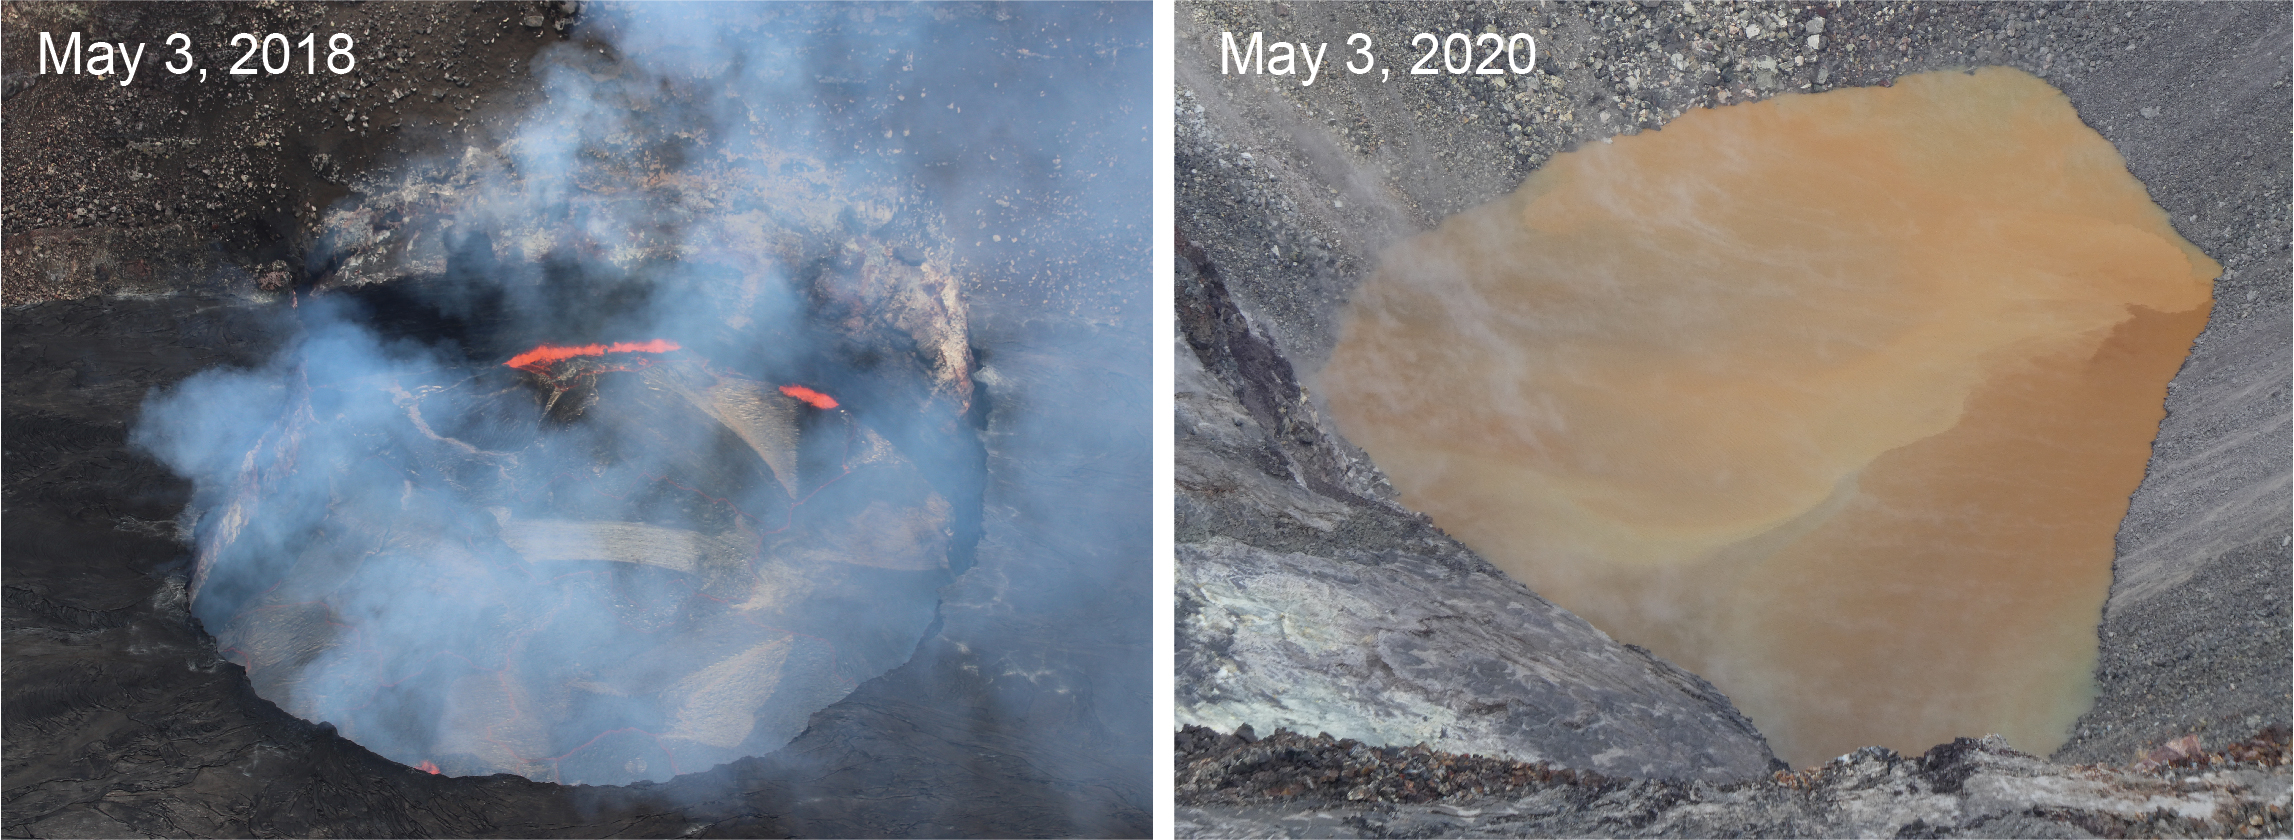
The lower East Rift Zone eruption started two years ago, on May 3, 2018. At that time, the lava lake in Halema‘uma‘u, at Kīlauea’s summit, had just started dropping in response to the changes in the East Rift Zone. Today, two years later, a new lake is present in Halema‘uma‘u, but formed from water. Many of the monitoring techniques remain the same, however. HVO scientists make routine visual observations, measure the lake level with a laser rangefinder, and track the activity 24/7 with webcams and thermal cameras. USGS photos by C. Parcheta and M. Patrick.
Gas measurements show continuing low levels of sulfur dioxide emission from the Halema’uma’u area, which likely means magma is not present within a few hundred meters (yards) of the surface. Some amount of sulfur dioxide is being dissolved into the summit lake and work continues to try and quantify this process. The lake was last sampled by UAS in January and additional sampling with UAS is planned.
Farther east, on Kīlauea’s East Rift Zone, GPS stations and tiltmeters continue to show motions consistent with refilling of the East Rift Zone magmatic reservoir in the broad region between Puʻu ʻŌʻō and Highway 130. An increase in deformation rates beginning in March 2020, consistent with an episode of rift inflation west of Highway 130, lessened during past the month and rates are nearly back to the same levels as before March. GPS stations on Kīlauea’s south flank continue to show elevated rates of motion that could indicate increased creep on the décollement fault underlying the south flank, likely in response to the May 4, 2018 M6.9 earthquake near Kalapana. HVO continues to carefully monitor all data streams along the Kīlauea East Rift Zone and south flank for important changes.
Source : HVO.