August 18 , 2022.
Iceland / Reykjanes Peninsula , Meradalur :
In the week from August 8-14 the SIL network detected about 900 earthquakes, a significant drop in activity from the week before when around 9500 earthquakes were detected. Of the 900 events this week around 700 have been manually reviewed. The decrease in activity is linked to the start of an eruption on the Reykjanes Peninsula which started on August 3 just west of Meradalahnúkar. The largest event last week was a M 3.1 which took place on August 13 out on the Reykjanes Ridge. One other event above magnitude 3 was detected. It took place on August 11 near lake Kleifarvatn and was measured a M 3.0.
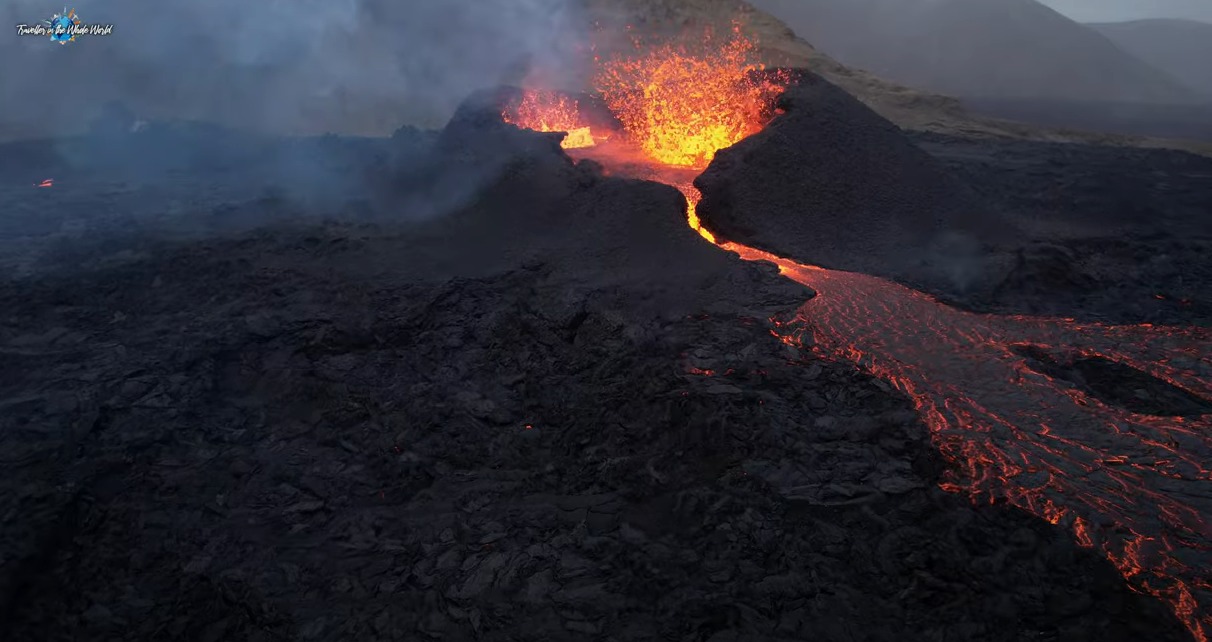
The fissure eruption in the Krýsuvík-Trölladyngja volcanic system that began on 3 August continued in the Meradalir valley during 10-16 August. Lava erupted mainly from a central cone and flowed ESE. According to the Institute of Earth Sciences the effusion rate had notably decreased, from an average of 11 cubic meters per second during 4-13 August to 3-4 cubic meters per second during 13-15 August. A news article stated that the effusion rate significantly decreased during 05h30-06h30 on 13 August based on information from IMO staff who were investigating the eruption site for new changes. The Institute of Earth Sciences estimated that 10.6 million cubic meters of lava had covered an area of 1.25 square kilometers by 15 August. Data collected during an overflight on 16 August indicated that the effusion rate had further reduced to 2 cubic meters per second during the previous day, though the uncertainty in that estimate was high. On 16 August residents reported seeing a purple-tinged sulfur dioxide gas cloud over the eruption area slowly drifting SW during sunrise.
Source : Vedur is , GVP .
Photo :
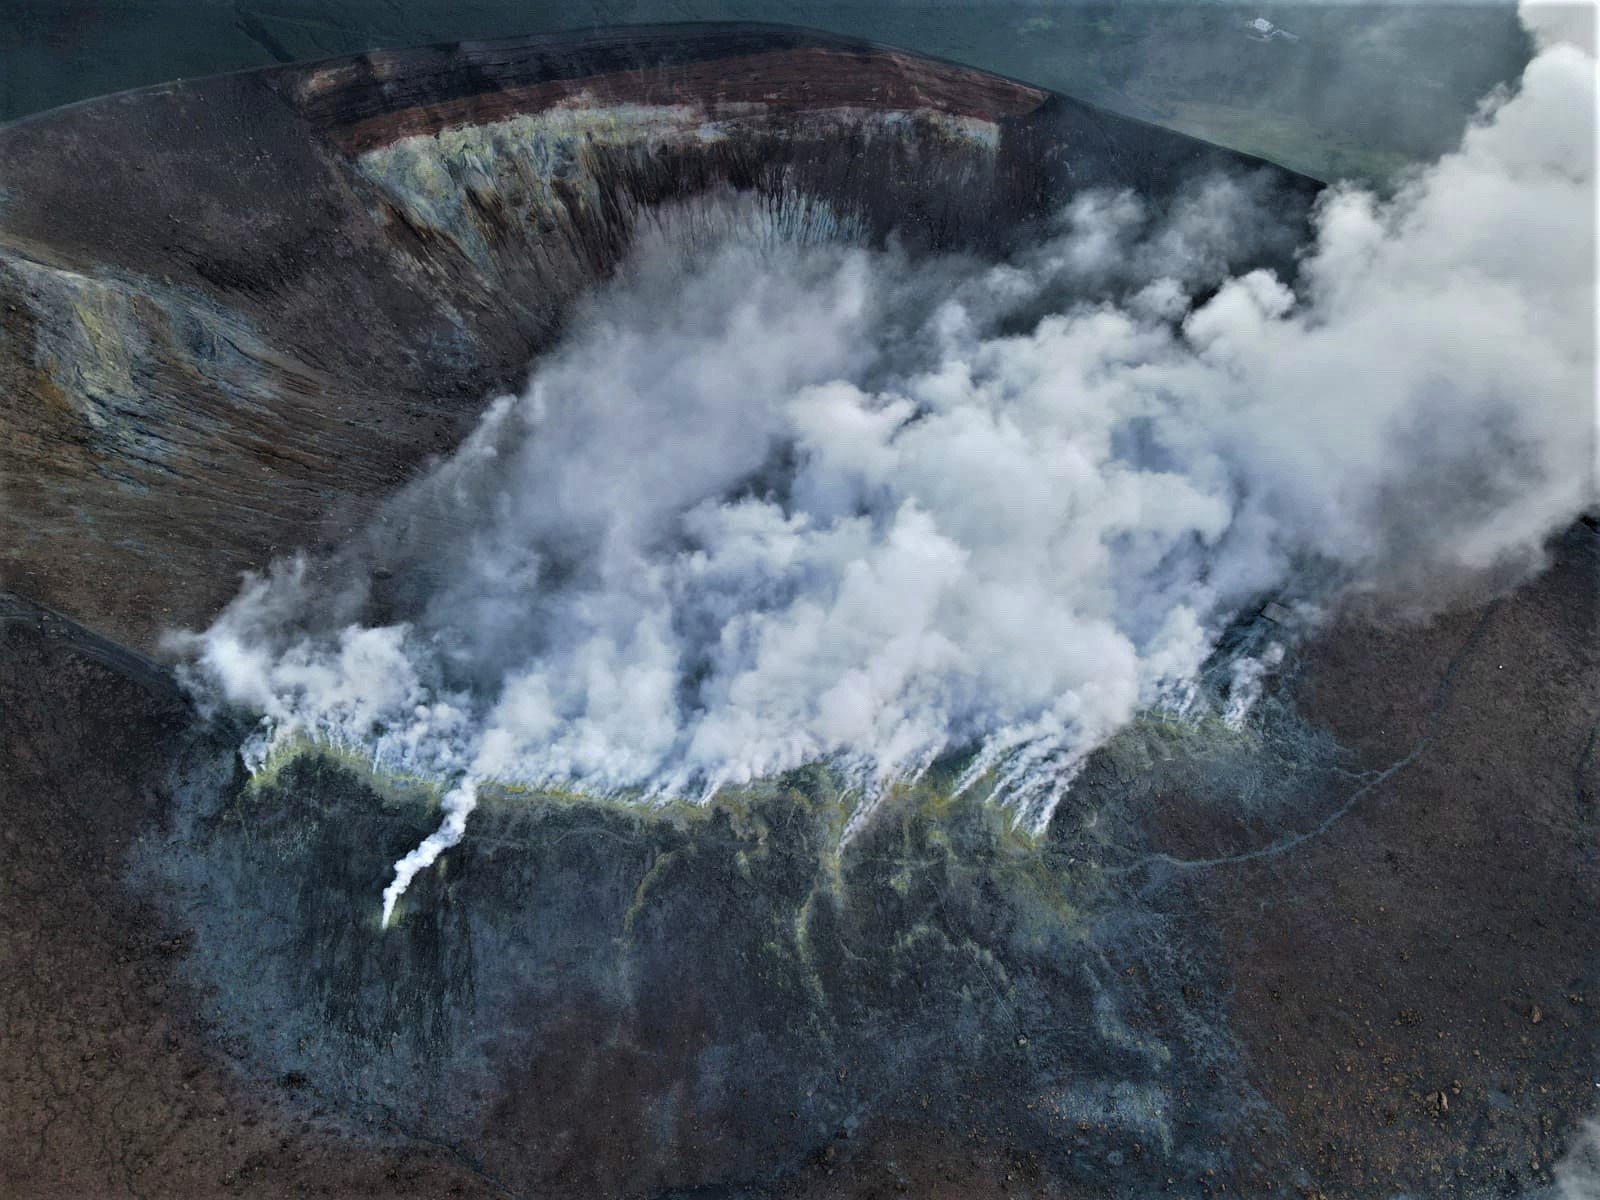
Italy , Vulcano :
WEEKLY BULLETIN, from August 08, 2022 to August 14, 2022. (issue date August 16, 2022).
ACTIVITY STATUS SUMMARY
In the light of the surveillance data, it is highlighted:
1) Temperature of the crater fumaroles: The temperatures recorded on the rim of the crater show stable values around 373°C.
2) CO2 flux in the crater area: The CO2 flux towards the crater remains at high values.
3) SO2 flux in the crater area: SO2 flux at a medium-high and stable level
4) Geochemistry of fumarolic gases: No update is available.
5) CO2 fluxes at the base of the La Fossa cone and in the Vulcano Porto area: High CO2 flux values, slightly increasing at the Camping Sicilia site and stable at the Rimessa site. On the Faraglione and P4max sites they record values close to the background level.
6) Geochemistry of thermal aquifers: The physico-chemical parameters recorded in the Camping Sicilia well show stable values at high levels compared to May. The level values measured in the Bambara well show a slightly upward trend.
7) Local seismicity: Low rate of occurrence of local micro-seismicity with a spectral peak greater than 1 Hz. High daily frequency of low frequency events (VLP).
8) Regional seismicity: Absence of regional earthquakes of magnitude equal to or greater than 1.0.
9) Deformations – GNSS: The network of GNSS stations has not recorded any significant changes.
10) Deformations – Inclinometry: There are no significant variations
11) Gravimetry: No significant medium-long term variation was recorded.
12) Other Notes: Mobile GNSS. The GNSS mobile network acquires and transmits movements in real time at a frequency of 1 Hz. The time series acquired so far do not show significant variations around the eastern port area.
CO2 FLOW AT THE BASE OF LA FOSSA CONE AND IN THE VULCANO PORTO AREA
CO2 fluxes at the base of the crater in the C. Sicilia site followed a slight upward trend last week, settling at values slightly higher than those of the previous month. The Remessa site recorded stable values compared to last week; however, the values remain at higher levels than the background. The P4max and Faraglione sites show stable values close to the background level.
LOCAL SEISMICITY
During the week considered, the number of local high-frequency micro-shocks, with a spectral peak greater than 1 Hz, was globally low and comparable to that observed the previous week. It should be noted that the heavy rains that occurred on August 12 may have influenced the occurrence rate of this type of event for that day.
With regard to local low-frequency micro-seismicity (VLP; spectral peak less than 1 Hz), the frequency of occurrence of events remains high; however, with the exception of a few isolated daily values, the slight downward trend in this parameter recorded since the end of the previous week is confirmed.
Source : INGV.
Photo : INGV-Roma1
Samoa Islands , Ta’u :
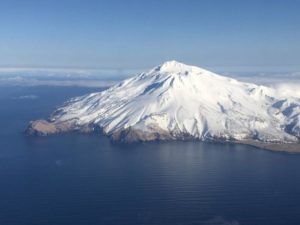
HVO reported that earthquakes were felt by residents of the Manu’a group of islands in American Samoa beginning on 26 July. Residents of Ofu and Olosega islands began reporting earthquakes on 10 August. Experts from HVO, Pago Pago National Weather Service Office (NWS), National Oceanic and Atmospheric Administration (NOAA) Pacific Tsunami Warning Center, NOAA-IOC (NOAA-Intergovernmental Oceanographic Commission), International Tsunami Information Center, and USGS National Earthquake Information Center have been working together to respond to the unrest. USGS scientists arrived on the islands and installed two microseismometers, one in Fiti’uta village on Ta’u island on 13 August and the other in Olosega village on 14 August. The instruments began recording about 20 earthquakes per hour. The largest earthquakes, including the felt events, were estimated to be between magnitudes 2 and 3; most of the events were too small to be felt. The exact location and depth of these earthquakes was unknown, due to limited earthquake monitoring equipment, though the data suggested that the events were beneath the Manu’a Islands, likely closer to Ta’u island rather than Ofu-Olosega, and were probably not related to the recently active Vailulu’u seamount. HVO noted that American Samoa’s volcanoes were monitored remotely by satellites and a distant seismic station in Apia, Samoa; the lack of ground-based monitoring stations does not allow for advanced warning of new activity. Both the Volcano Alert Level and Aviation Color Code were categorized as Unassigned due to the lack of a volcano-monitoring network.
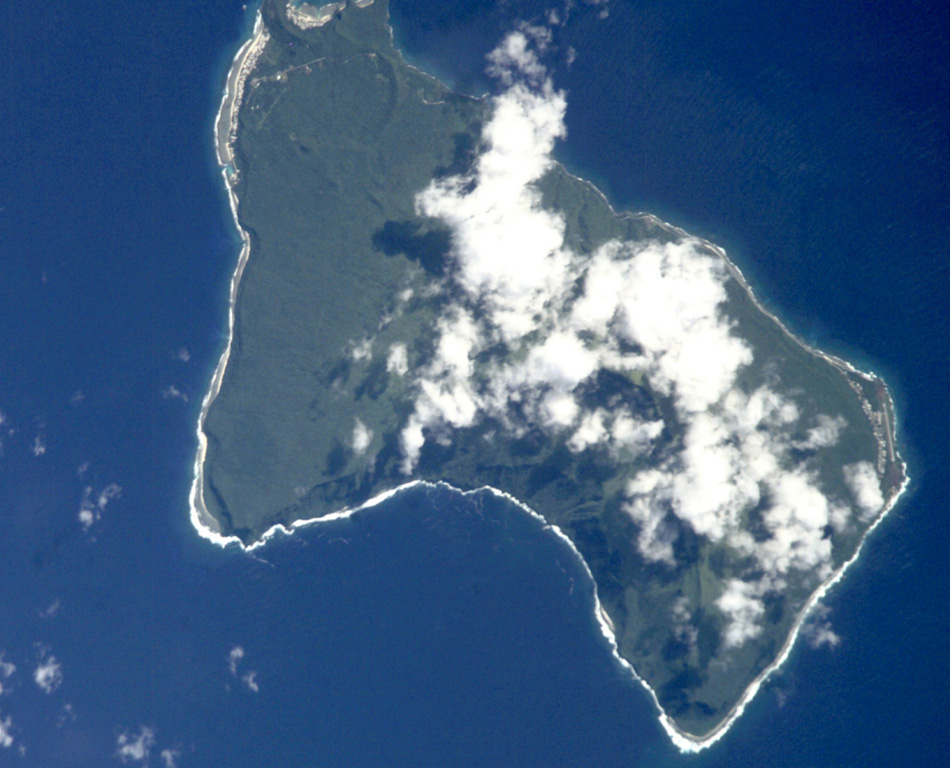
The island of Ta’u (Photo above), 10 km wide and located at the eastern end of the Samoa Islands, is surrounded by cliffs. It is the emergent part of the great shield volcano of Lata. A major flank collapse event 22 ka ago resulted in steep scarps on the south side of the island. Two smaller shields were built along the rift zones at the northwest and northeast ends of the island. The northwest corner of the island has a complex of tuff cones that ejected large xenoliths (enclave of a rock included in a different rock) of dunite (ultrabasic rock of the peridotite group containing 90% or more of olivine) and coral blocks. Numerous post-caldera cones dating from the Holocene are found at the top and on the flanks.
Source et photo : GVP.
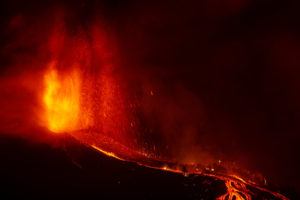
Japan , Sakurajima :
JMA reported that nighttime incandescence at Minamidake Crater (at Aira Caldera’s Sakurajima volcano) was visible during 8-15 August. The seismic network recorded 33 eruptive events and 12 explosions. Volcanic plumes rose as high as 2.5 km above the crater rim and material was ejected large ballistics as high as 1.7 km above the summit. The Alert Level remained at 3 (on a 5-level scale), and residents were warned to stay 2 km away from the crater.

The Aira caldera in the northern half of Kagoshima Bay contains the post-caldera Sakurajima volcano, one of Japan’s most active. Eruption of the voluminous Ito pyroclastic flow accompanied formation of the 17 x 23 km caldera about 22,000 years ago. The smaller Wakamiko caldera was formed during the early Holocene in the NE corner of the Aira caldera, along with several post-caldera cones. The construction of Sakurajima began about 13,000 years ago on the southern rim of Aira caldera and built an island that was finally joined to the Osumi Peninsula during the major explosive and effusive eruption of 1914. Activity at the Kitadake summit cone ended about 4850 years ago, after which eruptions took place at Minamidake. Frequent historical eruptions, recorded since the 8th century, have deposited ash on Kagoshima, one of Kyushu’s largest cities, located across Kagoshima Bay only 8 km from the summit. The largest historical eruption took place during 1471-76.
Source : GVP.
Photo : Archive webcam.
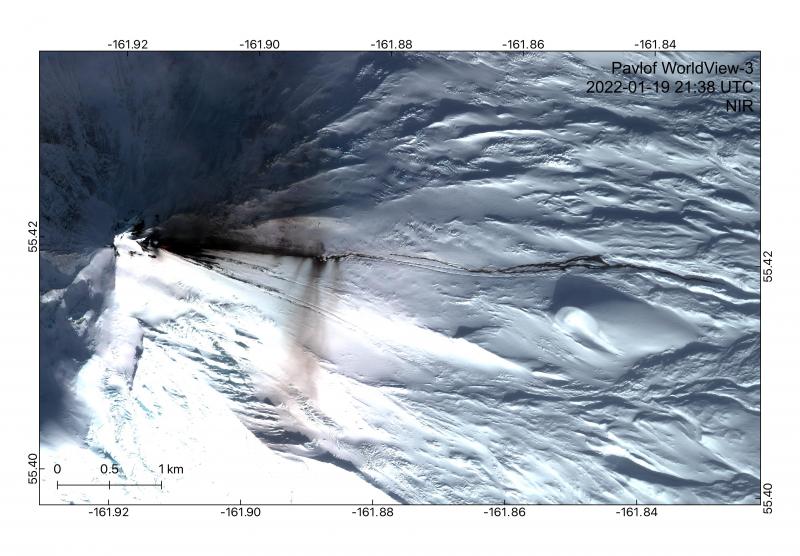
Alaska , Pavlof :
55 ‘ 25’2″ N 161’ 53’37 » W,
Summit Elevation 8261 ft (2518 m)
Current Volcano Alert Level: WATCH
Current Aviation Color Code: ORANGE
Pavlof Volcano continues to erupt from the vent on the volcano’s east flank just below the summit. Seismic tremor and small explosions were detected in local seismic and infrasound data. Elevated surface temperatures were observed in satellite images. A few webcam images and one pilot report indicated small ash emissions generally staying below the summit and quickly dissipating.
Small explosions associated with the current eruption could happen at any time and may be accompanied by small ash plumes within the immediate vicinity of the volcano. The level of unrest at Pavlof can change quickly and the progression to more significant eruptive activity can occur with little or no warning.
Pavlof is monitored by local seismic and infrasound sensors, satellite data, web cameras, and regional infrasound and lightning networks.
Source : AVO.
Photo : Dietterich, Hannah ,