March 20 , 2020.
Kamchatka , Klyuchevskoy :
VOLCANO OBSERVATORY NOTICE FOR AVIATION (VONA).
Issued: March 20 , 2020
Volcano: Klyuchevskoy (CAVW #300260)
Current aviation colour code: ORANGE
Previous aviation colour code: orange
Source: KVERT
Notice Number: 2020-34
Volcano Location: N 56 deg 3 min E 160 deg 38 min
Area: Kamchatka, Russia
Summit Elevation: 15580 ft (4750 m)
Volcanic Activity Summary:
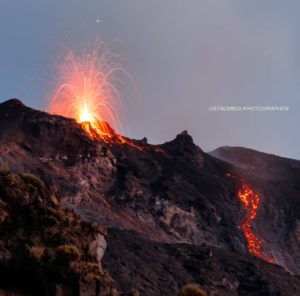
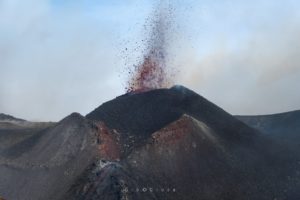
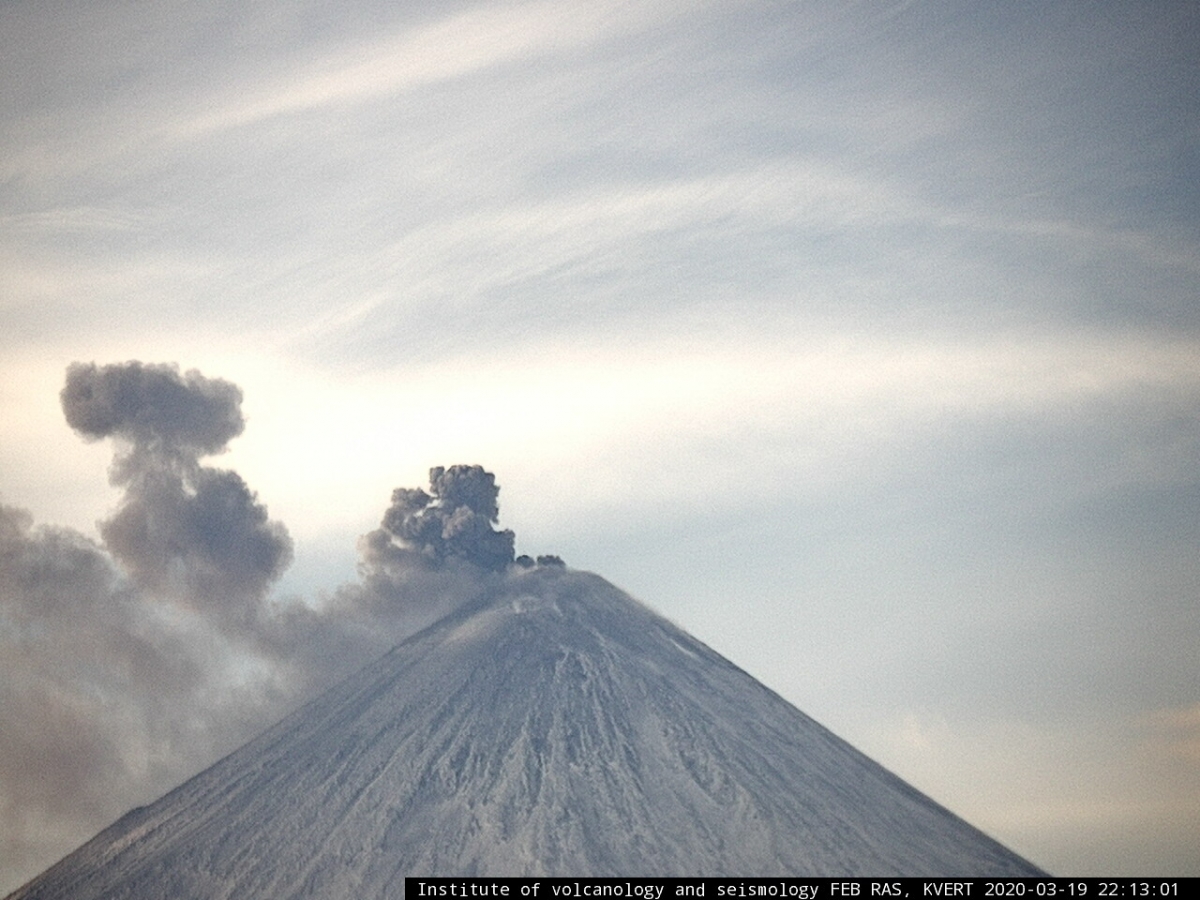
A moderate explosive eruption of the volcano continues, the Strombolian activity is noting. According to satellite data, a gas-steam plume containing ash is extending about 58 km to the east from the volcano.
This eruption continues. Ash explosions up to 16,400-23,000 ft (5-7 km) a.s.l. could occur at any time. Ongoing activity could affect low-flying aircraft.
The explosive eruption of Klyuchevskoy volcano has been going on since November 01, 2019. An eruption of the Vulcanian type was observed on March 19, 2020.
Volcanic cloud height:
16400-18040 ft (5000-5500 m) AMSL Time and method of ash plume/cloud height determination: 20200320/0213Z – Suomi NPP (14m15)
Other volcanic cloud information:
Distance of ash plume/cloud of the volcano: 36 mi (58 km)
Direction of drift of ash plume/cloud of the volcano: E / azimuth 93 deg
Time and method of ash plume/cloud determination: 20200320/0213Z – Video data
Source : Kvert.
Photo: IVS FEB RAS , KVERT.
Chile , Nevados of Chillan :
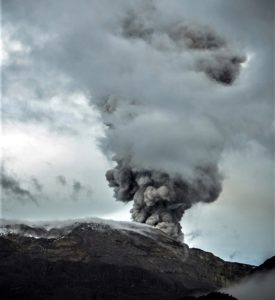
On the volcanic complex Nevados of Chillán, an explosion which had a height of 1500 meters above the active crater and a dispersion preferably in the south-east direction was recorded yesterday, Thursday March 19, at 18:00.
The Orange technical alert persists.
https://www.facebook.com/MeteoPangui/videos/268956517430446/
Special volcanic activity report (REAV), region of the Nevados de Chillán volcanic complex, on March 17, 2020 at 2:25 p.m. local time (mainland Chile).
The National Geological and Mining Service of Chile (Sernageomin) discloses the following PRELIMINARY information, obtained thanks to the surveillance equipment of the National Volcanic Surveillance Network (RNVV), processed and analyzed at the South Andes Volcanological Observatory (OVDAS ):
On Tuesday March 17, 2020 at 13 h 53 local time (16 h 53 UTC), the monitoring stations installed near the volcanic complex Nevados de Chillán recorded an earthquake of volcano-tectonic type, associated with the fracturing of rocks.
The characteristics of the earthquake are as follows:
TIME OF ORIGIN: 1:53 p.m. local time (4:53 p.m. UTC).
LATITUDE: 36 876 ° S
LONGITUDE: 71.372 ° W
DEPTH: 3.5 km
LOCAL MAGNITUDE: 3.0 (ML)
OBSERVATIONS:
Following the occurrence of the earthquake, no surface changes were recorded.
The volcanic technical alert is maintained at the ORANGE level.
Source : Sernageomin.
Italy , Campi Flegrei :
Weekly bulletin from 10/03/2020 to 17/03/2020, (Updated on March 17, 2020 at 12h00 local time)
SUMMARY OF THE ACTIVITY:
According to monitoring data:
1) Seismicity: During the last week, in the Campi Flegrei were recorded 14 earthquakes (Mdmax = 0.2).
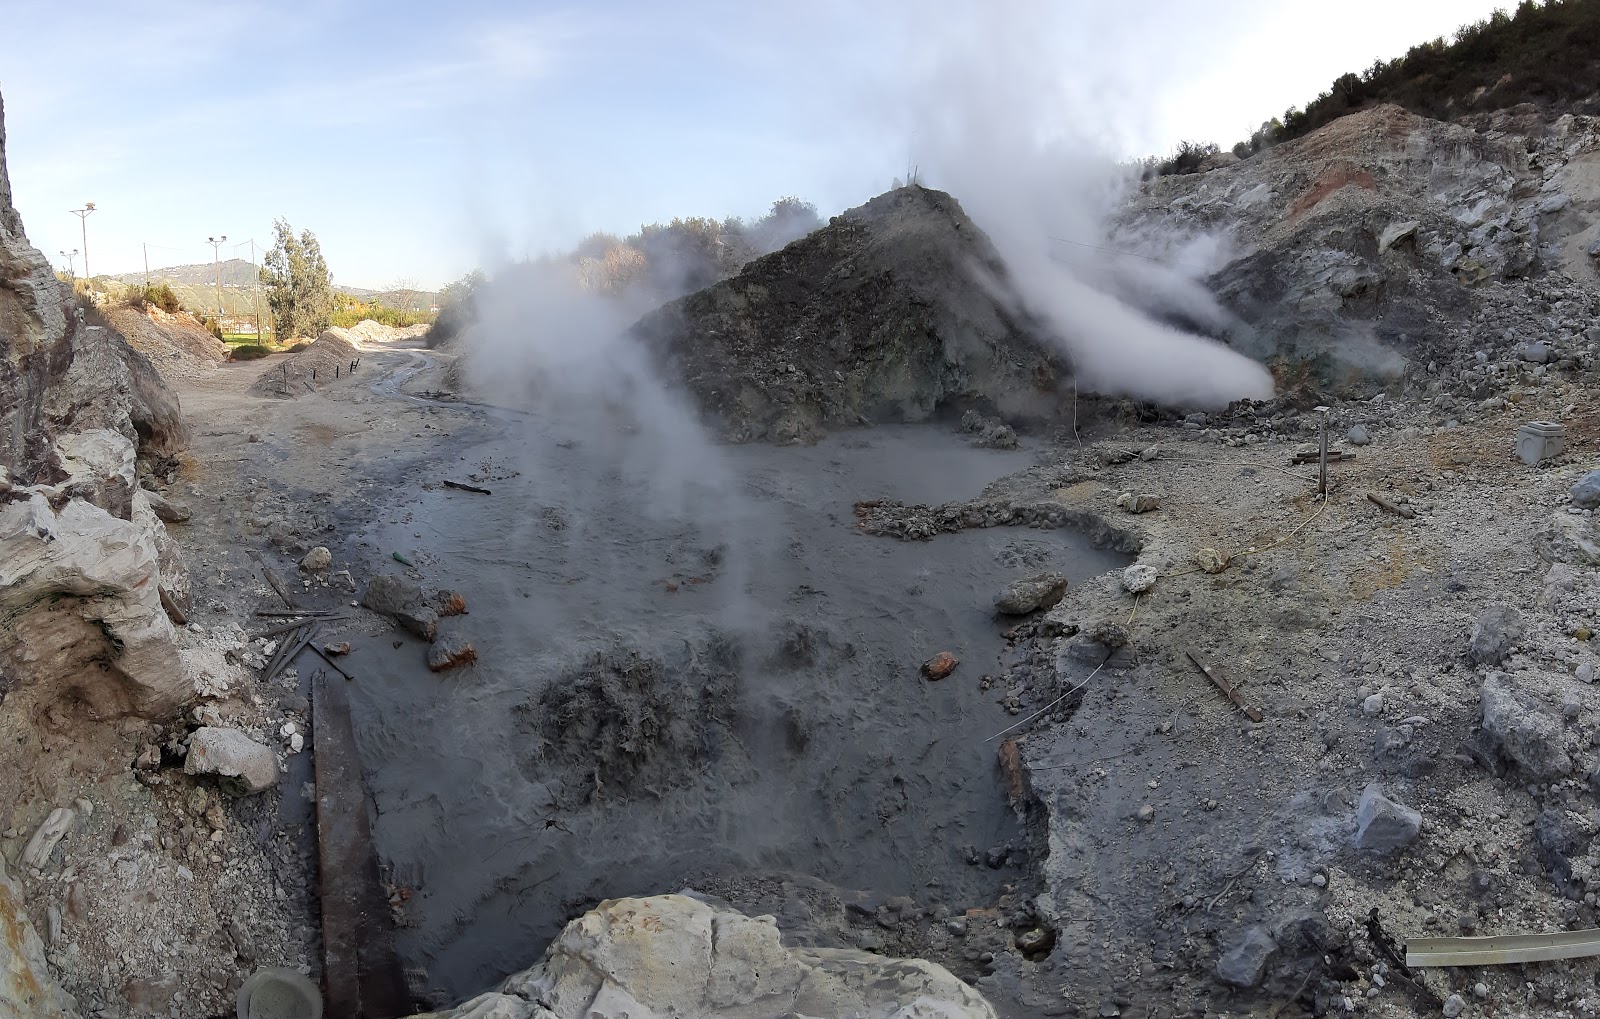
Pisciarelli , Tullio Ricci, December 2019
2) Deformation: The average value of the uplift of about 0.7 cm / month since July 2017 in the zone of maximum deformation showed an increase during the weeks between the end of November and the beginning of December, then returned to the usual average values after l swarm of December 6. The lift recorded at the RITE GPS station has been approximately 60.5 cm since January 2011.
3) Geochemistry: The flow of CO2 from the ground measured last week showed no significant change compared to the previous period, which confirms the persistence of the long-term trend; last week, the temperature of the main fumarole of Pisciarelli showed an average value of around 115 ° C.
Source : INGV .
Photo : Tullio Ricci .
Hawaii , Mauna Loa :
19°28’30 » N 155°36’29 » W,
Summit Elevation 13681 ft (4170 m)
Current Volcano Alert Level: ADVISORY
Current Aviation Color Code: YELLOW
Activity Summary:
Mauna Loa Volcano is not erupting. Rates of deformation and seismicity have not changed significantly over the past week and remain above long-term background levels.
Observations:
During the past week, HVO seismometers recorded around 87 small-magnitude earthquakes beneath the volcano’s upper elevations. Most of these events occurred at shallow depths of less than 5 kilometers (~3 miles) below ground level.
The strongest earthquake on Mauna Loa in this period was a magnitude 2.3 event in morning of March 19. This earthquake was located in the radial vents area west of the summit caldera within the volcano.
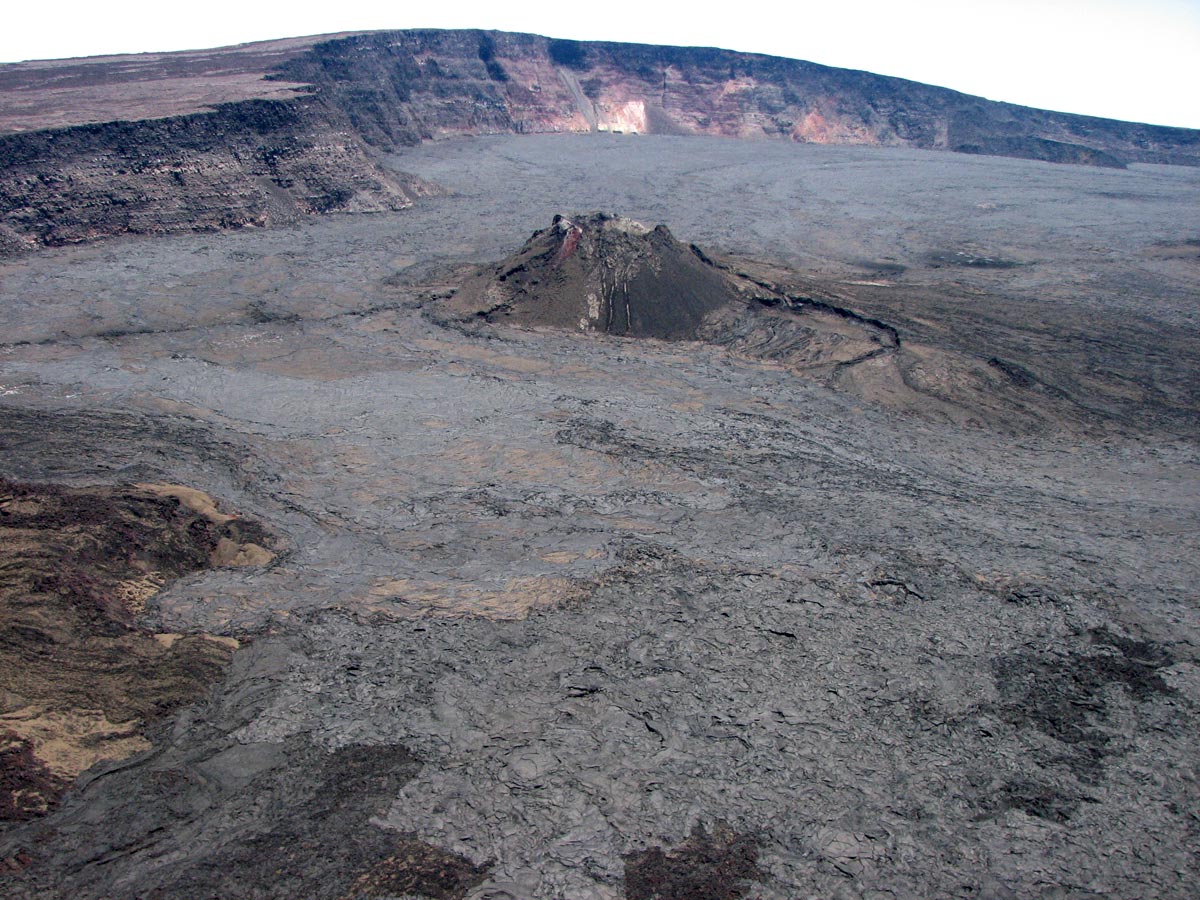
Aerial view of the 1940 cone, on the floor of the Mauna Loa caldera. The caldera wall (in the background) measures approximately 170 m (560 ft)
Global Positioning System (GPS) measurements show continued slow summit inflation, consistent with magma supply to the volcano’s shallow storage system.
Gas concentrations at the Sulphur Cone monitoring site on the Southwest Rift Zone remain stable. Fumarole temperatures as measured at both Sulphur Cone and the summit have not changed significantly.
Source : HVO.
Iceland , Mt Thorbjorn :
Continued inflation around Mt. Þorbjörn
The deformation is measured at a slower rate than in January. Most likely explanation is continued magma accumulation at depth. No signs of volcanic tremor. The Civil Protection Scientific Advisory Board will meet next week to assess the situation.

A GPS sensor at the top of Mount Thorbjorn. The town of Grindavík in the background.
From the most recent crustal deformation measurements, it is now clear that the inflation and associated uplift that occurred in Þorbjörn in January-February has started again. This is confirmed by both GPS and satellite data. Scientists from the Icelandic Met Office, University of Iceland and ISOR met Wednesday (18.03) to review the latest data.
The deformation is occurring in the same location as before, but at a slower rate. The uplift started in January and halted temporarily at the end of February. The most recent data show that since the beginning of March the uplift is about 20 mm. “The deformation now seems to be quite slow, slower than in January. Indeed, 20 mm is a small uplift and it is difficult to analyze such a small change. Data have to be collected for several days to confirm that an uplift is taking place” says Benedikt Gunnar Ófeigsson, geophysicist at the Icelandic Met Office. “We are now seeing signs of uplift and our calculations indicate that the source is similar to the source of the uplift in January”, says Benedikt.
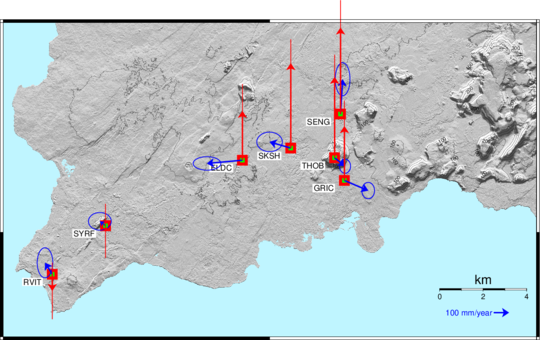
The image shows the average deformation velocity at the GPS stations around Þorbjörn and Reykjanesstá from the 3rd of March. “THOB” in the center of the image shows the location of the station on top of Mt. Þorbjörn. The red arrows show the vertical displacement velocity, and the blue ones the horizontal velocity. The blue arrow at the bottom of the image indicates, as a reference, a velocity corresponding to 100mm/year (that means approximately 1 mm per day). The figure shows that all stations around Þorbjörn are moving away from a common point. This pattern indicates that the magma is flowing upwards from depth and accumulating into the upper crust (at about 4 km depth). The vertical velocity shows that the crust has been rising of about 2-3 mm per day. A similar trend is not observed at the stations farther away, like RVIT and SYRF.
Magma can accumulate for longer periods of time without an eruption
As was already stated by the Civil Protection Scientific Advisory Board, the most likely explanation for this deformation is magma accumulation at depth. “Although we see the signs that uplift has started again, it does not mean that the events at Þorbjörn are accelerating, nor that an eruption will begin any time soon. It is known that magma accumulation can take place for a long time, months, even years, without resulting in a volcanic eruption” says Kristín Jónsdóttir, head of the Natural Hazard Monitoring Group at the Icelandic Met Office. « What we are seeing now in Reykjanes can last a long time and there can be a sequence of phases. The activity might reduce temporarily and slow down without coming to an end. The next steps are for the Scientific Advisory Board to meet to assess the situation. The meeting has been scheduled at the end of next week. » says Kristín.”
Further analysis needed
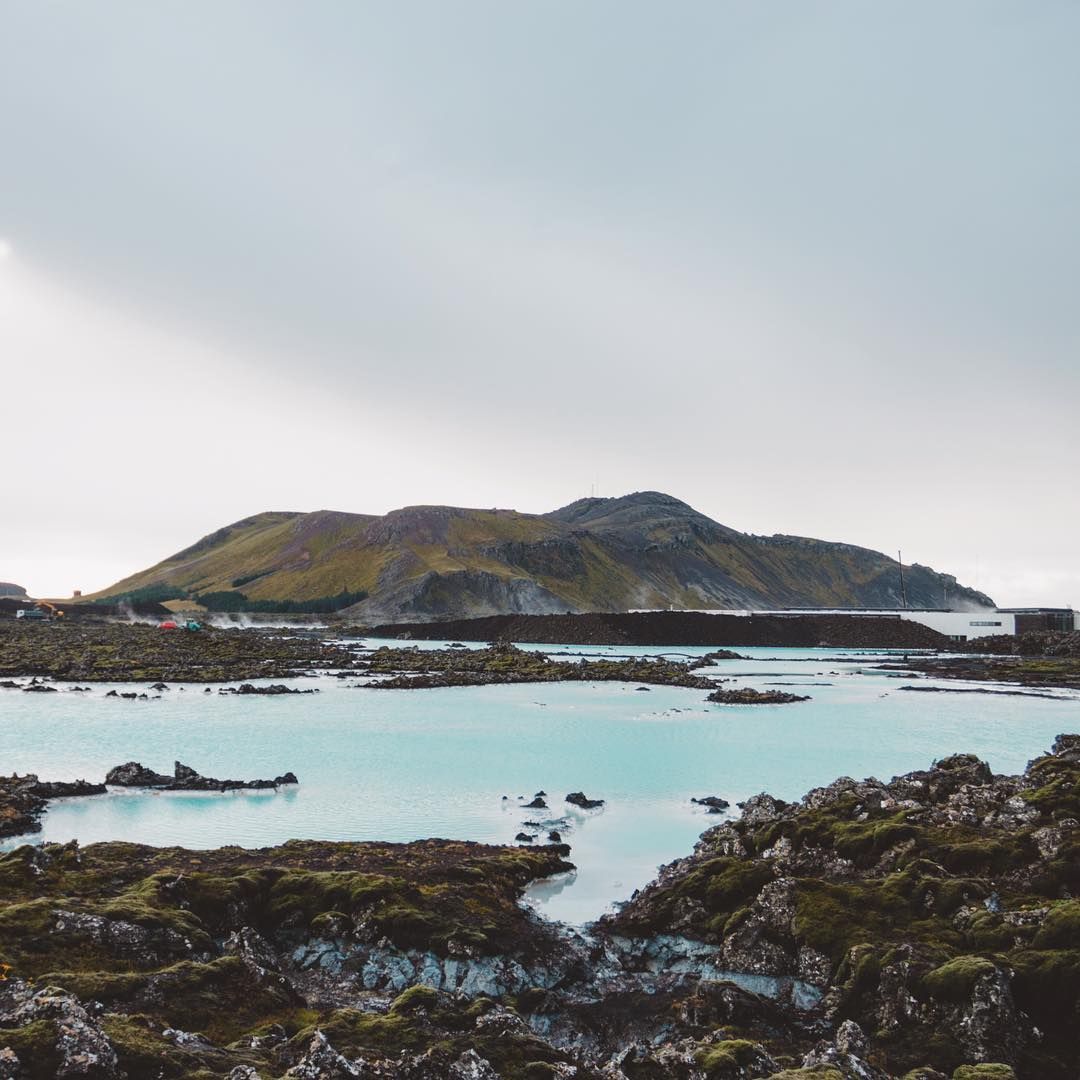
Considerable earthquake activity followed the deformation, as it was expected by the Scientific Advisory Board. An earthquake that was widely felt in the southwest of Iceland was recorded in the morning of March 12 at about 4 km NNA of Grindavík and 2 km east of the Blue Lagoon. Several aftershocks followed. « We evaluated the earthquake on March 12 to be M5.2, but now we have reassessed its magnitude at M4.6. It can be complicated to estimate the size of larger earthquakes, but now several of us have studied the event and this is the result » says Kristín Jónsdóttir. « This is partly because of strong wave reflections in the crust in Reykjanes Peninsula that complicate the data processing. We will look at this swarm in the context of other data currently available at the next Scientific Advisory Board meeting, and assess the likely course of events » says Kristín.
Source : IMO.
Read the article : https://en.vedur.is/about-imo/news/continued-inflation-around-mt-thorbjorn
Photos : IMO , Photograph taken by an unknown photographer. Via Volcanodiscovery.