March 04 , 2020.
Indonesia , Semeru :
* Gunung Semeru ejects hot clouds up to three kilometers *
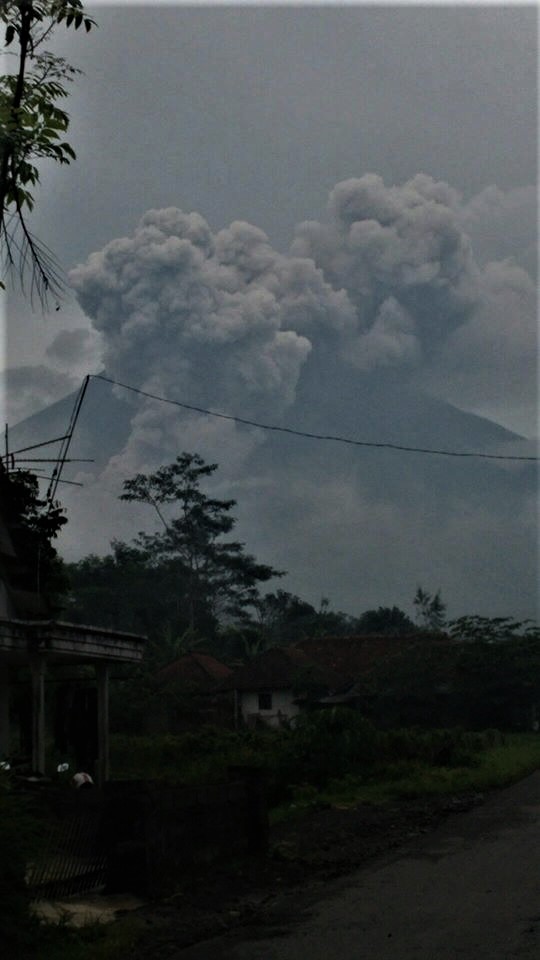
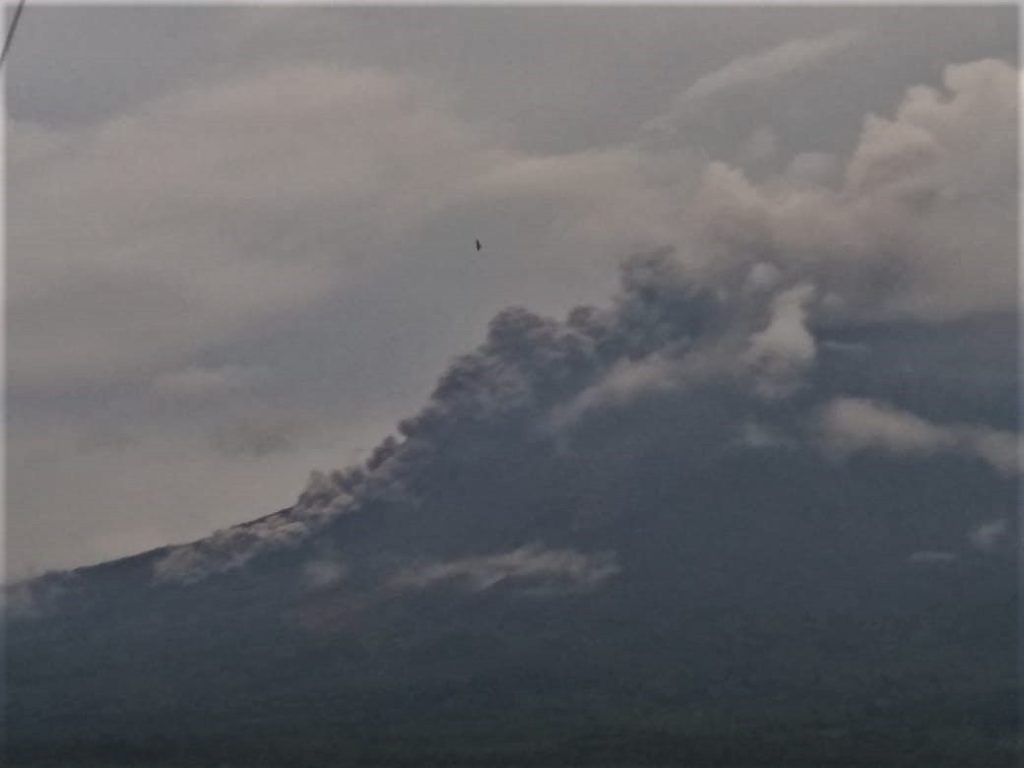
MALANG – Mount Semeru emitted a hot avalanche cloud down to three kilometers, as reported by the head of the regional disaster management agency of the regency of Malang (BPBD) via a digital message on Tuesday (3 / 3) at 5:33 p.m. WIB. Currently, the highest mountain in Java is at alert level II (Waspada).
The descent of the hot cloud was observed with a maximum amplitude of 23 millimeters and an earthquake duration of up to 540 seconds. The hot clouds slid towards Besuk Kembar and Besuk Bang from the center of the avalanche for a distance of about 750 meters from the main crater.
According to Subagyo, these natural phenomena have occurred frequently and current conditions are still safe and under control. Nevertheless, the Center for Volcanology and Mitigation of Geological Disasters (PVMBG) and BPBD have always called on the public not to carry out activities within a radius of one kilometer and an area of about four kilometers in the sector in the South-South-East slope which is a path of descent of the hot clouds from the main crater.
In addition, the public should also always be alert to the potential for warm cloud slides from the Janggring Saloko crater so that later the natural phenomenon does not become a disaster.
VOLCANO OBSERVATORY NOTICE FOR AVIATION – VONA.
Issued: March 03 , 2020
Volcano: Semeru (263300)
Current Aviation Colour Code: ORANGE
Previous Aviation Colour Code: orange
Source: Semeru Volcano Observatory
Notice Number: 2020SMR16
Volcano Location: S 08 deg 06 min 29 sec E 112 deg 55 min 12 sec
Area: East java, Indonesia
Summit Elevation: 11763 FT (3676 M)
Volcanic Activity Summary:
Eruption with volcanic ash cloud at 22h52 UTC (05h52 local)
Volcanic Cloud Height:
Best estimate of ash-cloud top is around 12403 FT (3876 M) above sea level, may be higher than what can be observed clearly. Source of height data: ground observer.
Other Volcanic Cloud Information:
Ash cloud moving to north
Remarks:
Seismic activity is characterized by eruption, avalanche and gas emission earthquakes.
The eruptive activity and the continuous gas bursts in the Jonggring Seloko crater of G. Semeru show that the supply or pressure of magma continues to occur accompanied by an increase in fluids (gas, liquid and solids) at depths weaker, as the lava flows. Hot avalanche clouds occur due to gravity at the end of the unstable lava flow. The appearance of harmonic tremors without accompanying volcanic earthquakes (shallow volcanic or deep volcanic) shows that the system is now open. A fairly close interval of eruption earthquakes shows that there has so far been no accumulation of energy capable of causing more intense eruptions.
Source : Agus Wibowo , Responsable du centre de données BNPB sur les informations et la communication en cas de catastrophe. Magma Indonésie , PVMBG.
Photo : Bastian Pulalo.
Italy / Sicily , Etna :
Weekly bulletin from 24/02/2020 to 01/03/2020 (issue date 03/03/2020)
SUMMARY OF ACTIVITY STATUS
In light of the monitoring data, it is highlighted:
1) VOLCANOLOGICAL OBSERVATIONS: Strombolian and effusive intra-crater activity of the Voragine crater. Discontinued ash emissions and discontinued strombolian activity from the Northeast crater and the new Southeast crater.
2) SEISMOLOGY: Low seismic fracturing activity; amplitude of the volcanic tremor at the average level.
3) INFRASOUND: weak infrasound activity.
4) DEFORMATIONS: The Etna soil deformation monitoring networks have not shown any significant variation to report during the last week.
5) GEOCHEMISTRY: The flow of SO2 is at an average level. The HCl flow is at an average level. The flow of CO2 from soils is at medium-low levels. The partial pressure of dissolved CO2 does not show significant variations. The isotopic ratio of helium (data from February 14) is fixed at medium-high values. No update on the CO2 / SO2 ratio is available.
VOLCANOLOGICAL OBSERVATIONS
During the week, monitoring of volcanic activity in the summit craters of Etna was carried out by analyzing images from the network of surveillance cameras from the INGV Catania section, Etneo Observatory (INGV-OE) and by the through two inspections carried out by INGV-OE staff on February 24 and 25. During this latest inspection, visible and thermal images and video footage were also acquired using drones.
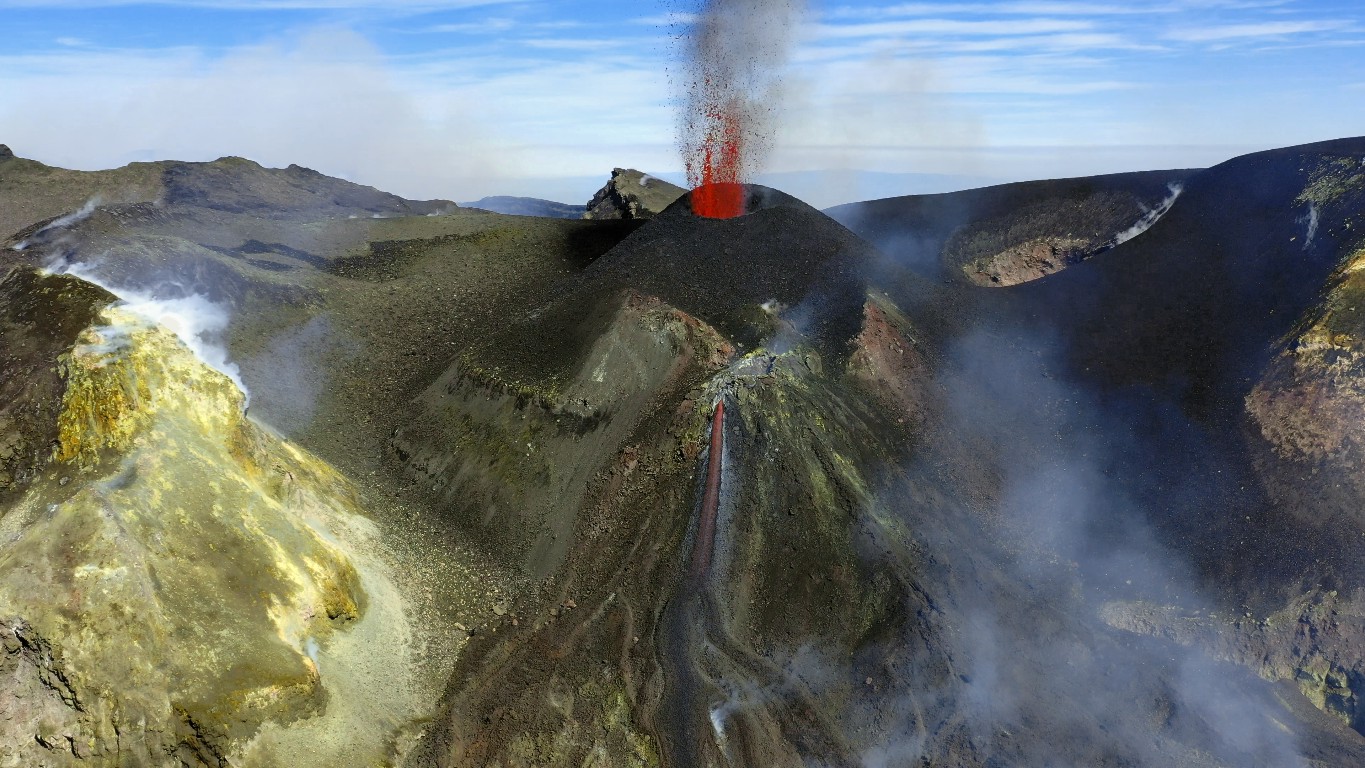
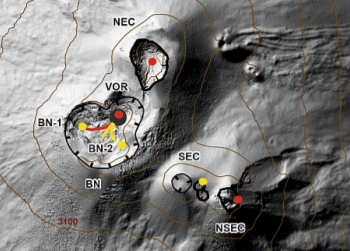
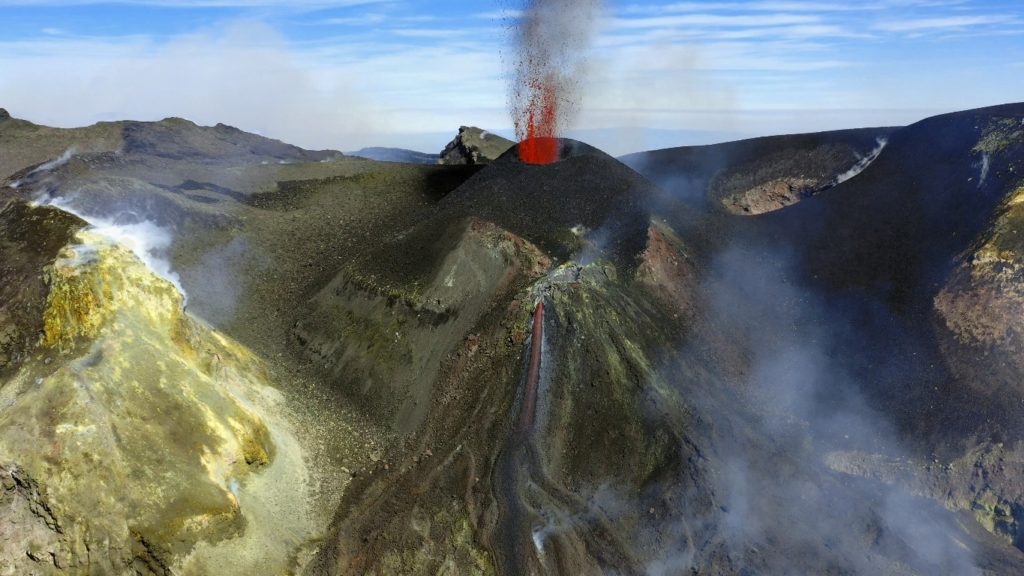
During the period considered, the upper craters were mainly characterized by an explosive strombolian and effusive activity of Voragine (VOR), and by a degassing with a discontinuous strombolian activity and intermittent ash emissions from the New Southeast Crater (NSEC) and the Northeast Crater (NEC). In particular, inspections have shown that the eruptive activity of the Voragin’s intracrater slag cone has continued. The explosive strombolian activity is produced by a single mouth placed above the cone. An almost continuous weak stream of lava flaps was observed; during the strongest explosions, separated by intervals of a few minutes, the launches sometimes reached 150-200 m above the mouth. The explosive activity also produced ash which quickly dispersed into the atmosphere. During the inspections, new decimeter bombs fell on the western edge of the Voragine’s edge, probably in the days preceding the inspections. On February 29, weak Strombolian activity was reported in a mouth located at the base of the northern flank of the ash cone. This activity could have been produced by an old mouth already observed during the inspection of February 17 or by a new mouth, yet very close to the previous one.
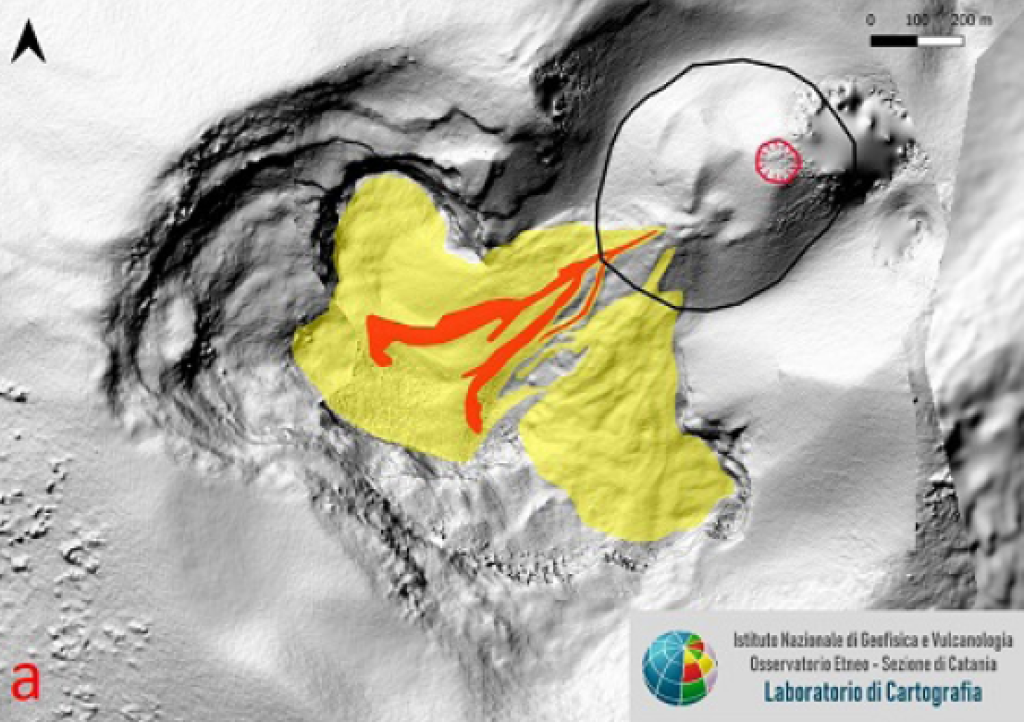
Ground observations integrated into visible and thermal images and video recordings acquired by drones made it possible to map the lava field and the Voragine’s intra-crater slag cone. In particular, it has been observed that on the south side of the ash cone a structure similar to a huge mound has formed, where the mouth is which feeds the effusive activity. The position of this mouth has changed over time, generating flows which in recent months have formed a vast delta of lava which is now partially cold. During the week, active lava flows continued to flow into the western depression of the Bocca Nuova (BN-1), gradually filling it.
During the week, the NE crater (NEC) produced strong explosions, sporadic emissions of diluted ash and occasional strombolian intra-crater activity, probably through vents in the wells at the bottom of the NE crater, described last week (see Rep. n ° 09/2020).
During field inspections, it was observed that the new South-East crater (NSEC) produced weak but continuous ash emissions, from a mouth present in the « saddle cone » area, a structure formed during the activity of February-April 2017. During the week, strombolian activity was also observed in some of the mouths present in the « saddle cone » area. The images acquired by means of drones have highlighted the area of the « saddle cone » which shelters numerous mouths active at different times. In addition, the soil is heavily weathered due to the presence of fractures which produce widespread fumarolic activity. Finally, there are rocky points in a potentially unstable position, also taking into account the steep slope of the sides of the cone of the new South-East crater (NSEC).
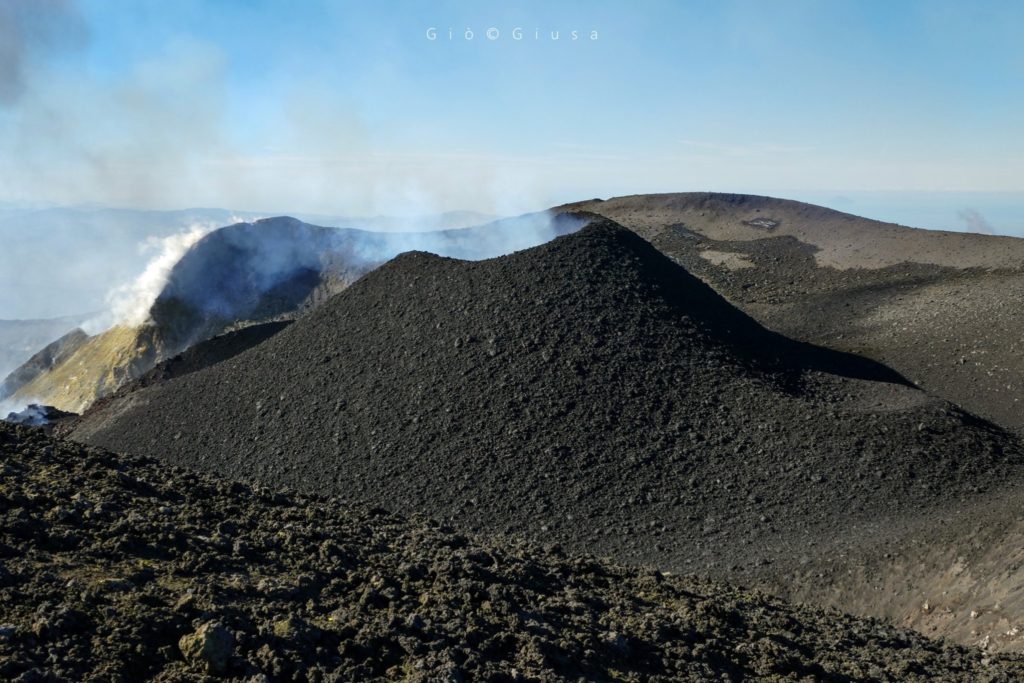
Here, we can see the « cone » formed inside the Voragine crater.
At the base on the right, we can see what must have been another small mouth, it was probably active for several weeks, but for the moment it does not seem to be any more fed. Photo: Giò Giusa
Volcanic tremors:
During the week, the average amplitude of the volcanic tremor did not show significant variations, but only a few modest fluctuations inside the average level. The sources of the tremor were located under the summit craters, in the altitude range between 2400 and 2800 m above mean sea level
Source : INGV Vulcani .
Read the whole article : file:///C:/Users/Utilisateur/AppData/Local/Packages/Microsoft.MicrosoftEdge_8wekyb3d8bbwe/TempState/Downloads/BollettinoEtna20200303%20(1).pdf
Photos : INGV , Gio Giusa .
Alaska , Pavlof :
AVO/USGS Volcanic Activity Notice
Current Volcano Alert Level: NORMAL
Previous Volcano Alert Level: ADVISORY
Current Aviation Color Code: GREEN
Previous Aviation Color Code: YELLOW
Issued: Tuesday, March 3, 2020, 10:38 AM AKST
Source: Alaska Volcano Observatory
Location: N 55 deg 25 min W 161 deg 53 min
Elevation: 8261 ft (2518 m)
Area: Alaska Peninsula
Volcanic Activity Summary:
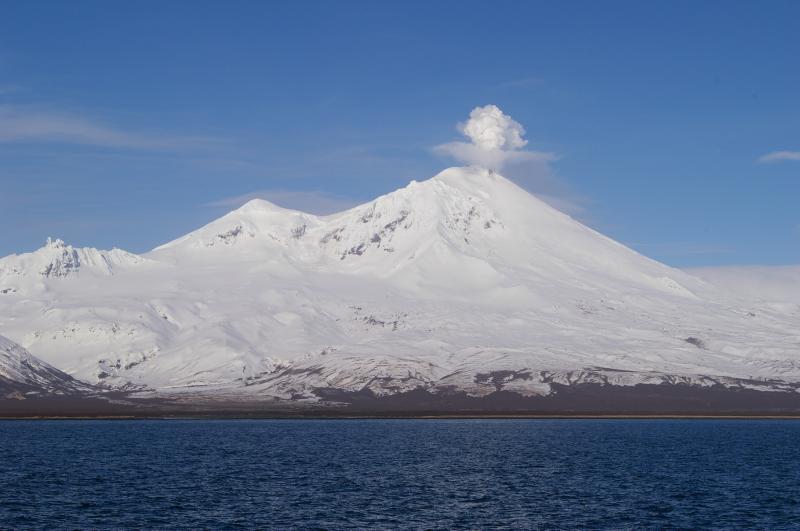
Over the past several weeks seismic activity has decreased at Pavlof. No eruptive activity or emissions from the summit have been observed since minor steam emissions in late February. Since activity is now at background levels, we are decreasing the Aviation Color Code and Alert Level to GREEN/NORMAL.
Recent Observations:
[Volcanic cloud height] None
[Other volcanic cloud information] None
[Lava flow/dome] None
[Lava flow] None
Remarks:
Pavlof Volcano is a snow- and ice-covered stratovolcano located on the southwestern end of the Alaska Peninsula about 953 km (592 mi) southwest of Anchorage. The volcano is about 7 km (4.4 mi) in diameter and has active vents on the north and east sides close to the summit. With over 40 historic eruptions, it is one of the most consistently active volcanoes in the Aleutian arc. Eruptive activity is generally characterized by sporadic Strombolian lava fountaining continuing for a several-month period. Ash plumes as high as 49,000 ft ASL have been generated by past eruptions of Pavlof, and during the March 2016 eruption, ash plumes as high as 40,000 feet above sea level were generated and the ash was tracked in satellite data as distant as eastern Canada. The nearest community, Cold Bay, is located 60 km (37 miles) to the southwest of Pavlof.
Source et photo : AVO.
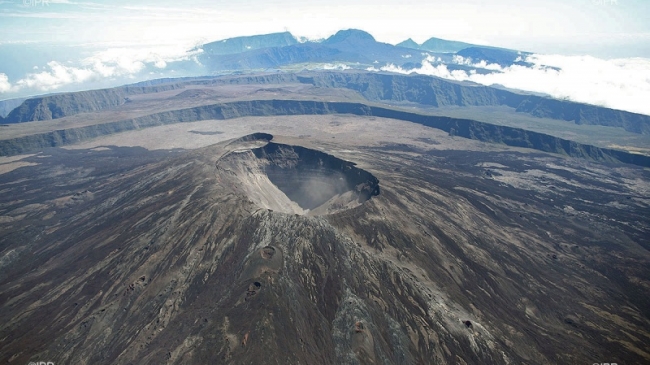
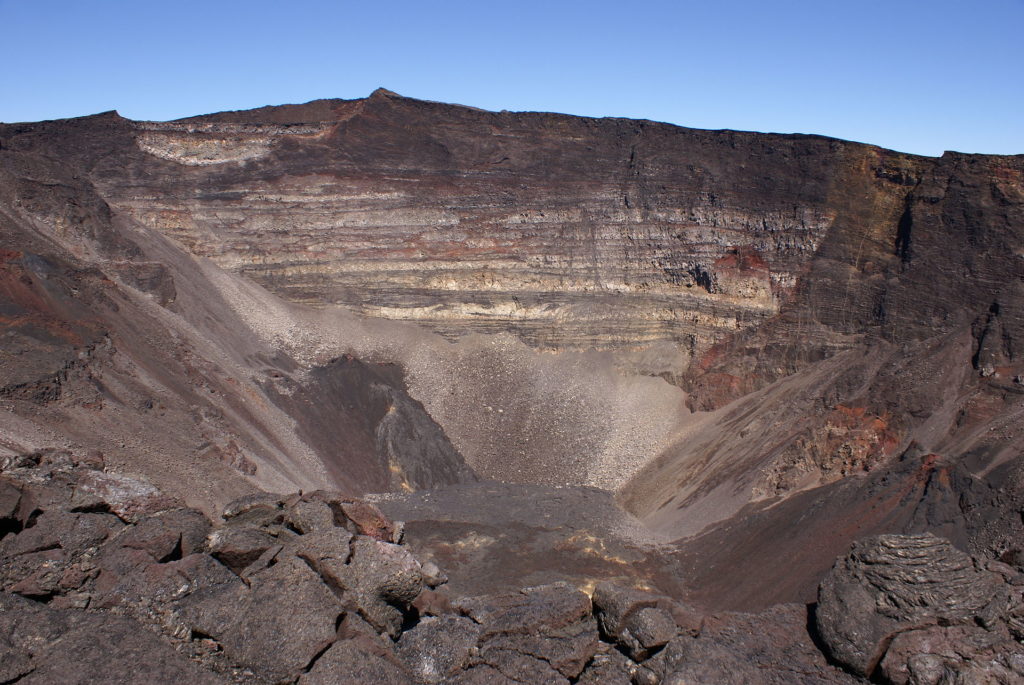
La Réunion , Piton de la Fournaise :
Seismicity
In February 2020, the OVPF recorded at Piton de La Fournaise:
• 249 shallow volcano-tectonic earthquakes (0 to 2 km depth) below the summit craters;
• 11 deep earthquakes (>2 km depth);
• 563 rockfalls (inside the Cratère Dolomieu or along the cliff of the Enclos Fouqué caldera and the Rivière de l’Est rempart).
In February 2020, the volcano-tectonic activity below the summit of Piton de la Fournaise was predominated by the seismic crisis preceding the February 10-16, 2020 eruption (with 208 earthquakes in about 30 minutes between 10h27 and 10h57 local time on Februay 10 ).
Following the strong seismic activity recorded during the first half of January 2020 (258 shallow volcano-tectonic earthquakes recorded bellow the summit craters between January 1 and 16, 2020), the seismicity was lower with an average of 1 earthquake per day between January 17 and 31. From February 1 to 9, about 4 earthquakes per day were recorded below the summit, and 10 earthquakes were recorded one day before the onset of the eruption.
The summit volcano-tectonic activity decreased after the end of the eruption, with only two shallow earthquakes recorded between February 17 and 29 . However, 8 deep earthquakes (at > 2 km depth) were recorded between February 17 and 19 underneath the approximate location of Piton de Crac, and on the edge of the deformation field linked to the magma injection that fed the February 10-16 eruption .
Deformation
No significant inflation directly preceded the February 10-16, 2020 eruption. On the contrary, the inflation rate that had been observed between late December 2019 and January 18, 2020, had slowed down . However, upon the end of the October 25-27, 2019 eruption, two significant phases of inflation occurred (one starting at the end of October until mid–November, and a second phase starting at the end of December until mid-January; 3). Those periods of inflation resulted in a cumulative distance elongation of max. 5 cm between GPS stations located at the base of the terminal cone, and about 4 cm between GPS stations located around the summit craters between October 28, 2019 and February 09, 2020 (i.e. one day before the onset of the February eruption).
The magma intrusion that led to the February 2020 eruption was accompanied by rapid inflation of about 20 cm recorded on permanent GPS stations located at the summit of the volcano and of max. 27 cm on the reiteration stations .
Edifice inflation directly resumed after the end of the eruption at rates similar to those observed upon the end of the October 25-27, 2019 eruption.
Source : OVPF
Read the whole article : http://www.ipgp.fr/sites/default/files/ovpf_20200303_bullmensu.pdf
Photos : IPR , B.Navez .

