December 29 , 2019.
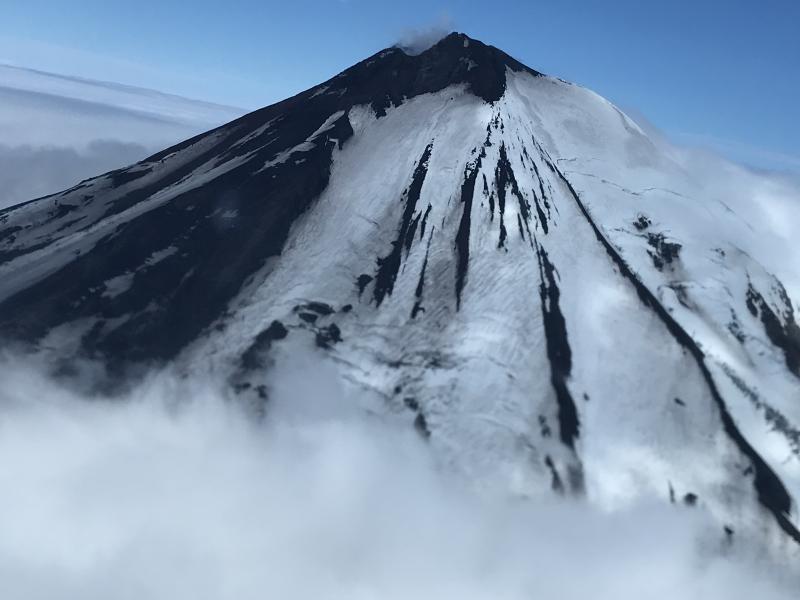
Alaska , Pavlof :
AVO/USGS Volcanic Activity Notice
Current Volcano Alert Level: ADVISORY
Previous Volcano Alert Level: NORMAL
Current Aviation Color Code: YELLOW
Previous Aviation Color Code: GREEN
Issued: Saturday, December 28, 2019, 11:43 AM AKST
Source: Alaska Volcano Observatory
Location: N 55 deg 25 min W 161 deg 53 min
Elevation: 8261 ft (2518 m)
Area: Alaska Peninsula
Volcanic Activity Summary:
Over the past several days seismic activity has increased at Pavlof. No eruptive activity or emissions from the summit have been observed. However, the seismic activity represents an increase from background levels and we are thus increasing the the Aviation Color Code and Alert Level to YELLOW/ADVISORY. This does not mean that an eruption is likely or imminent. However, past eruptions of Pavlof occurred with little or no warning.
Recent Observations:
[Volcanic cloud height] None
[Other volcanic cloud information] None
[Lava flow/dome] None
[Lava flow] None
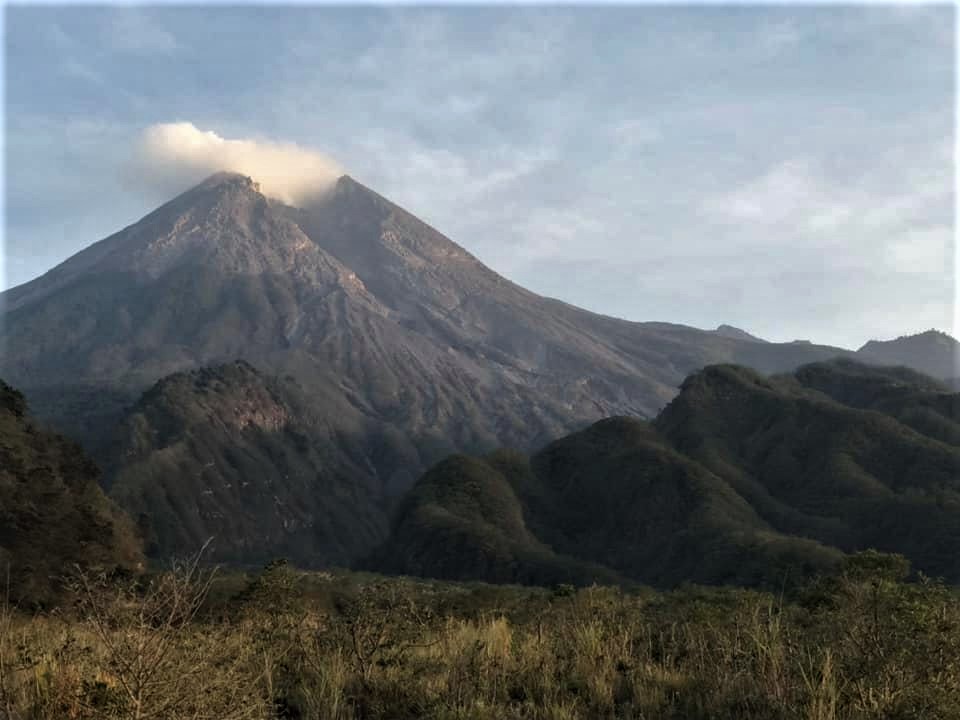
Remarks: Pavlof Volcano is a snow- and ice-covered stratovolcano located on the southwestern end of the Alaska Peninsula about 953 km (592 mi) southwest of Anchorage. The volcano is about 7 km (4.4 mi) in diameter and has active vents on the north and east sides close to the summit. With over 40 historic eruptions, it is one of the most consistently active volcanoes in the Aleutian arc. Eruptive activity is generally characterized by sporadic Strombolian lava fountaining continuing for a several-month period. Ash plumes as high as 49,000 ft ASL have been generated by past eruptions of Pavlof, and during the March 2016 eruption, ash plumes as high as 40,000 feet above sea level were generated and the ash was tracked in satellite data as distant as eastern Canada. The nearest community, Cold Bay, is located 60 km (37 miles) to the southwest of Pavlof.
Source : AVO.
Photo : Mulliken, Katherine , July 21 , 2018.
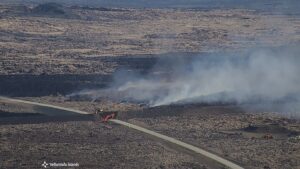
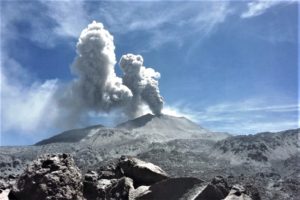
Ecuador / Galapagos , Fernandina :
VOLCÁN FERNANDINA – GALÁPAGOS n ° 001
SATURDAY DECEMBER 28, 2019.
The activity of the volcano is low but has shown a slight increase in its seismic activity and its deformation in recent weeks. Today, 6 seismic events have occurred, the largest recorded at 20:13 of magnitude 4.3 with a depth of 10.4 km. These types of earthquakes can precede eruptions on the volcano, as has been observed in the past. You cannot predict the occurrence of a rash, its location, or its size.
The Geophysical Institute of the National Polytechnic School monitors activity on the volcano and will report any changes that may be recorded.

Fernandina, the most active of Galápagos volcanoes and the one closest to the Galápagos mantle plume, is a basaltic shield volcano with a deep 5 x 6.5 km summit caldera. The volcano displays the classic « overturned soup bowl » profile of Galápagos shield volcanoes. Its caldera is elongated in a NW-SE direction and formed during several episodes of collapse. Circumferential fissures surround the caldera and were instrumental in growth of the volcano. Reporting has been poor in this uninhabited western end of the archipelago, and even a 1981 eruption was not witnessed at the time. In 1968 the caldera floor dropped 350 m following a major explosive eruption. Subsequent eruptions, mostly from vents located on or near the caldera boundary faults, have produced lava flows inside the caldera as well as those in 1995 that reached the coast from a SW-flank vent. Collapse of a nearly 1 km3 section of the east caldera wall during an eruption in 1988 produced a debris-avalanche deposit that covered much of the caldera floor and absorbed the caldera lake.
Source : IGEPN , GVP .
Photo :Unknown author ( 2017).
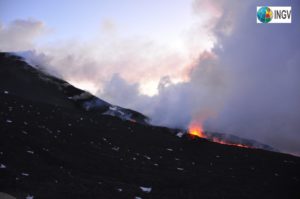
Indonesia , Merapi :
Merapi volcano activity report, December 20-26, 2019
OBSERVATION RESULTS.
visual:
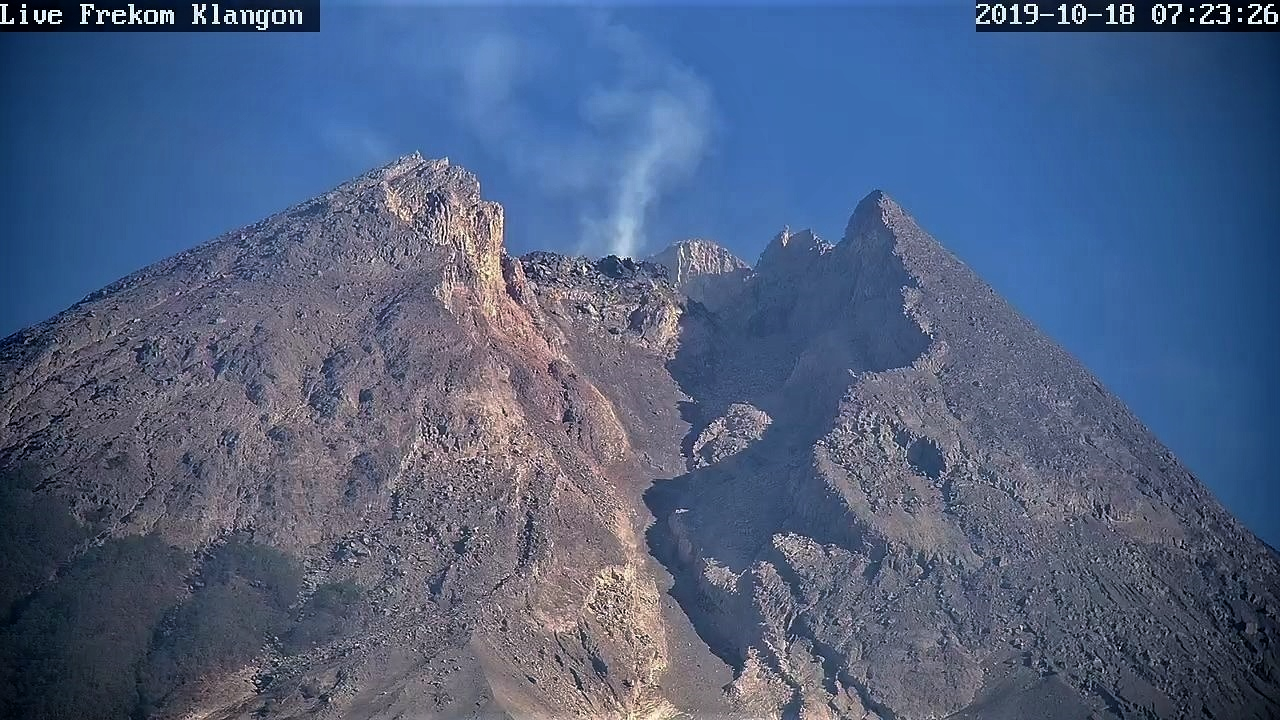
The weather around Mount Merapi is generally sunny in the morning and afternoon, while the evening is mostly foggy. White, medium to thick smoke with low pressure is noted. A maximum smoke height of 300 m was observed from the Mount Merapi observation post in Kaliurang on December 25, 2019 at 12:26 p.m. Western Indonesia time.
A morphological analysis of the crater area based on photographs of the Southeast sector did not show any significant morphological change. The volume of the lava dome based on aerial photo analysis with drones on November 19, 2019 was 396,000 m3.
Earthquake :
During this week, the seismicity of Mount Merapi recorded
6 explosion earthquakes (DG),
31 deep volcanic earthquakes (VTA),
5 shallow volcanic earthquakes (VTB),
11 multiple phase (MP) earthquakes,
13 avalanche earthquakes (RF),
4 low frequency earthquakes (LF)
15 tectonic earthquakes (TT).
The seismic intensity this week is higher than last week.
Deformation:
The deformation of G. Merapi which was monitored by EDM and GPS this week did not show any significant change.
Rain and lahars:
This week, December 24, 2019, there was rain at the Mount Merapi observation post with the highest precipitation of 32 mm / hour at the Jrakah post.
Conclusion:
Based on the results of the visual and instrumental observations, it was concluded that:
1. The lava dome is currently in a stable state.
2. The volcanic activity of Mount Merapi is still quite high and is determined at the « WASPADA » activity level.
3. The danger potential today is in the form of hot clouds from the collapse of the lava dome and volcanic materials projected by explosive eruptions.
Source : BPPTKG.
Photo : Martin Fontaine , photo Live Frekom Klangon 18.10.2019 / 7h23.
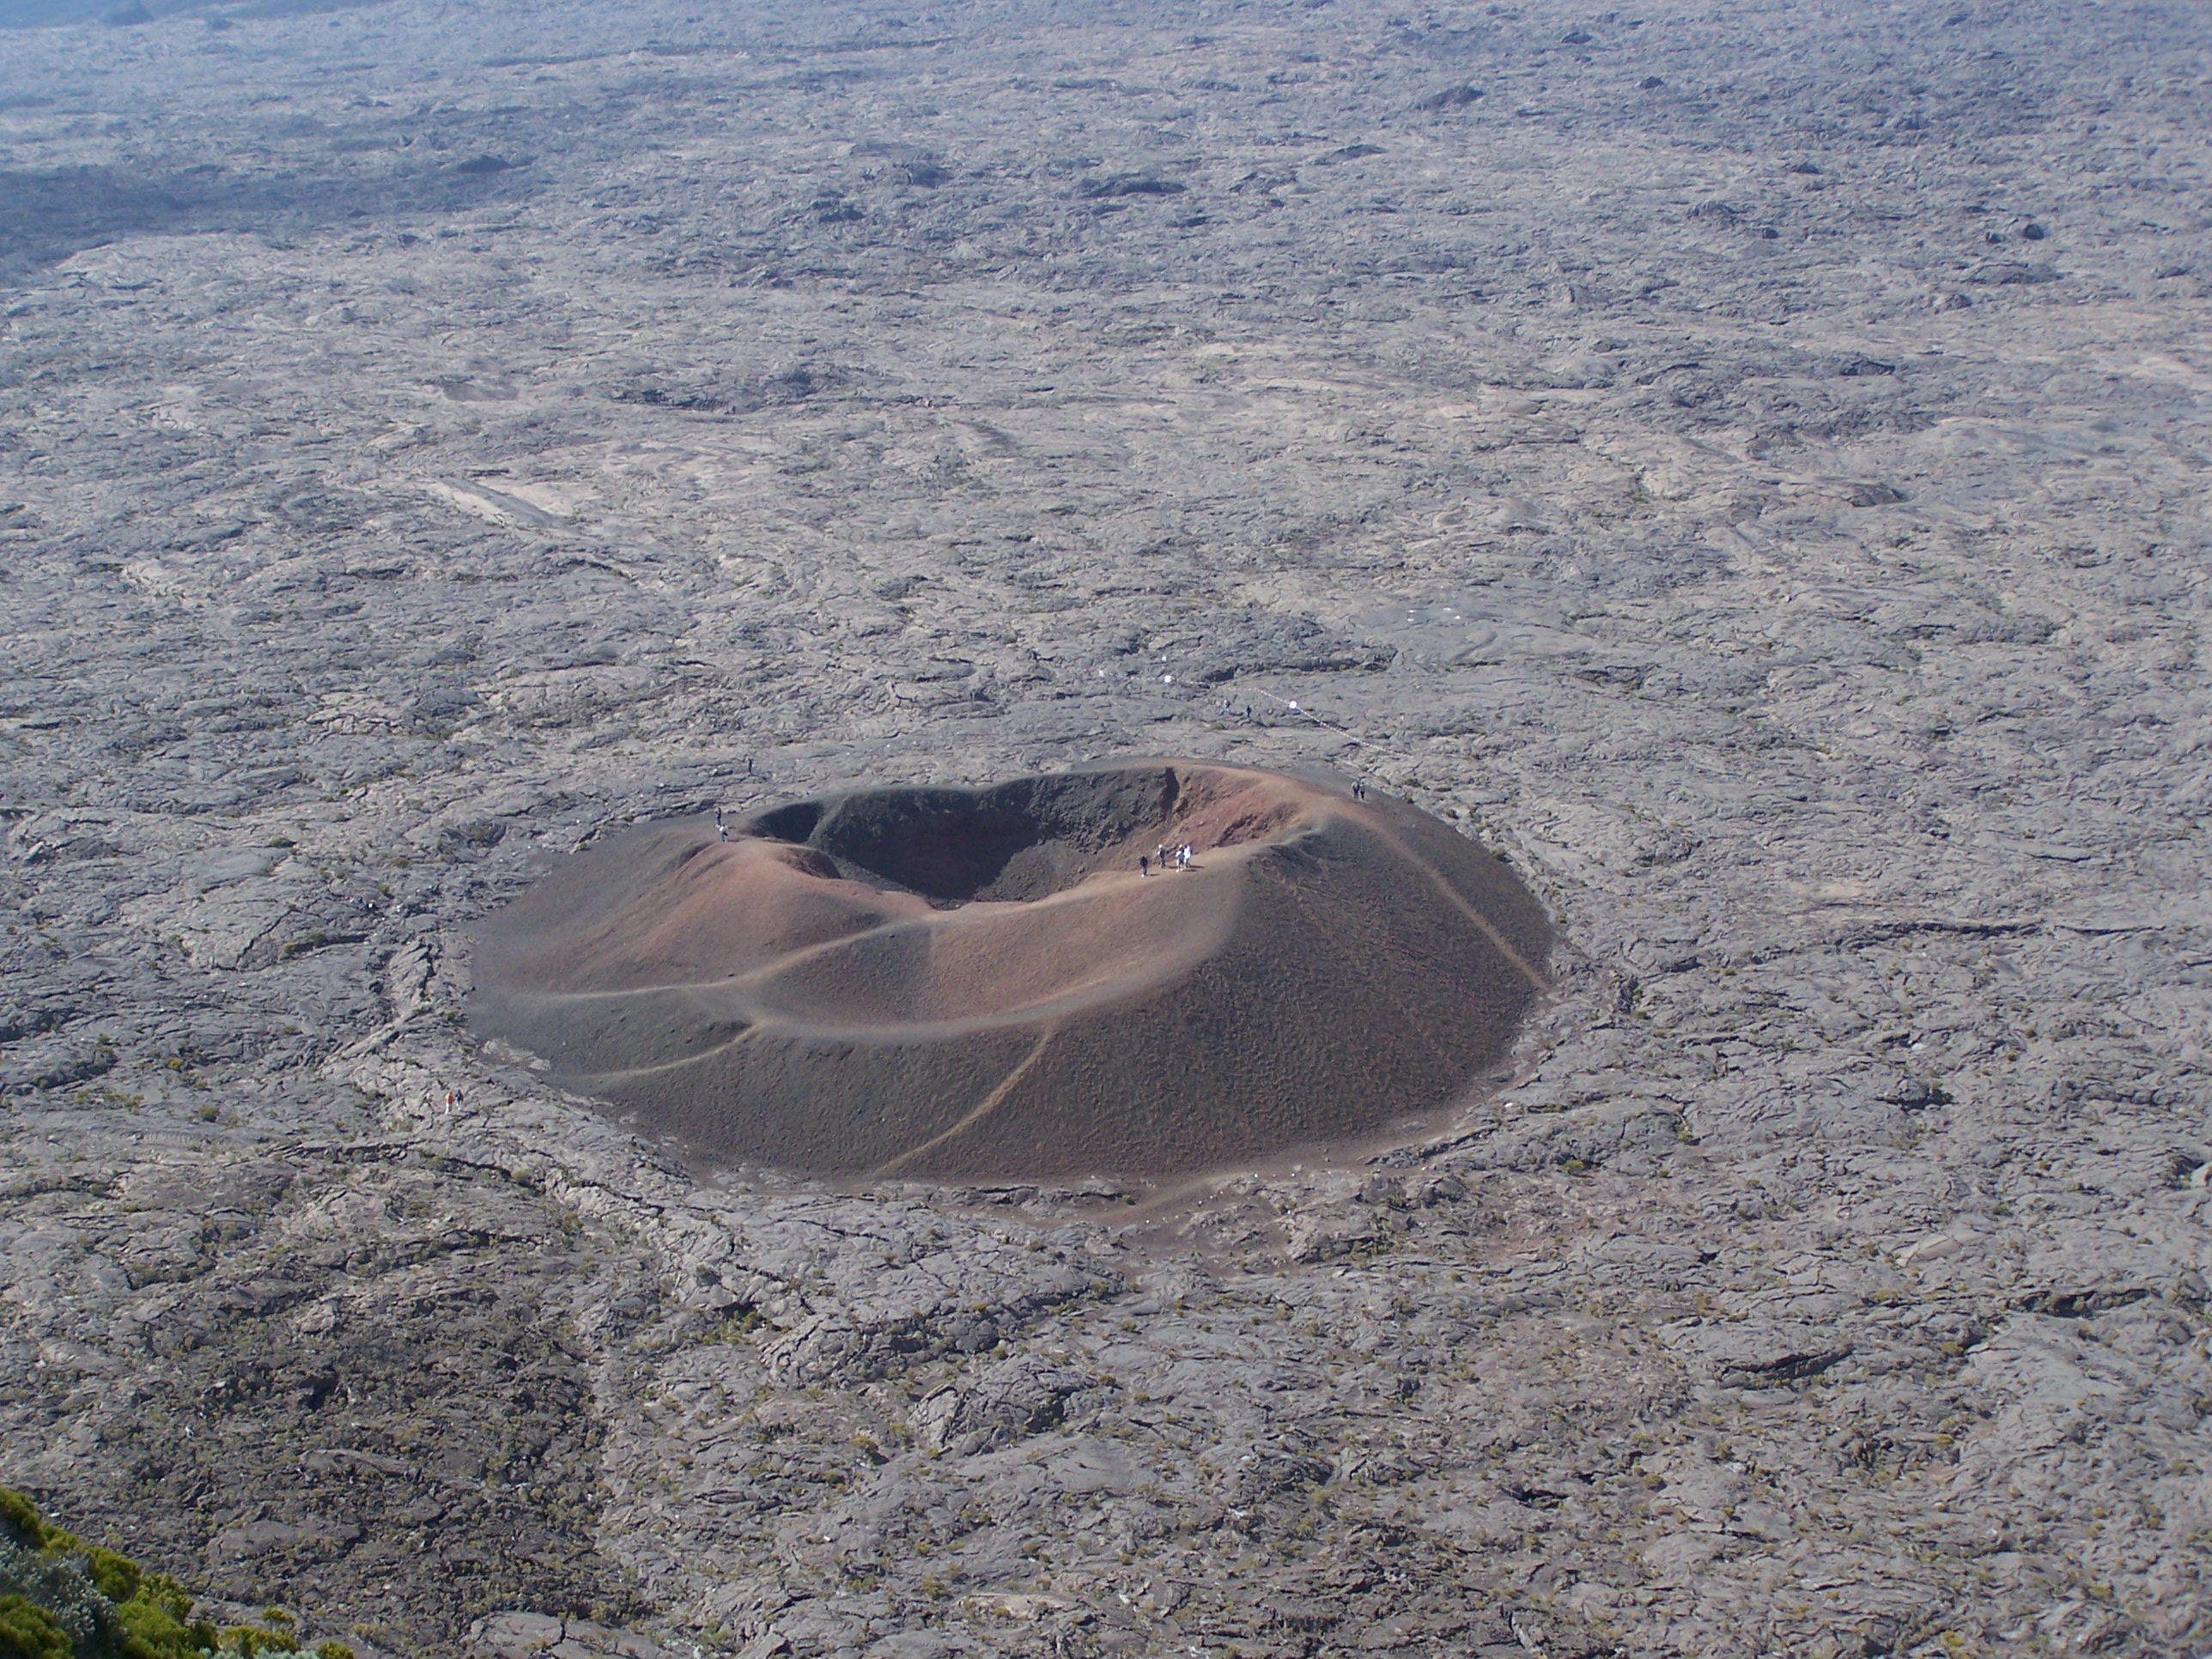
La Réunion , Piton de la Fournaise :
21 ° 14’38 « S
55 ° 42’29 « E
Altitude: 2632m
Alert level: Vigilance.
Seismology:
– Number of landslides of December 28, 2019: 26
Areas affected by landslides:
Summit cone, Enclos .
– Number of volcano-tectonic earthquakes (VT) of December 28, 2019: 2
Zone concerned by the VT:
Summit cone
– Largest volcano-tectonic earthquake of December 28, 2019:
Duration: 4.16 s
Duration Magnitude: 0.46
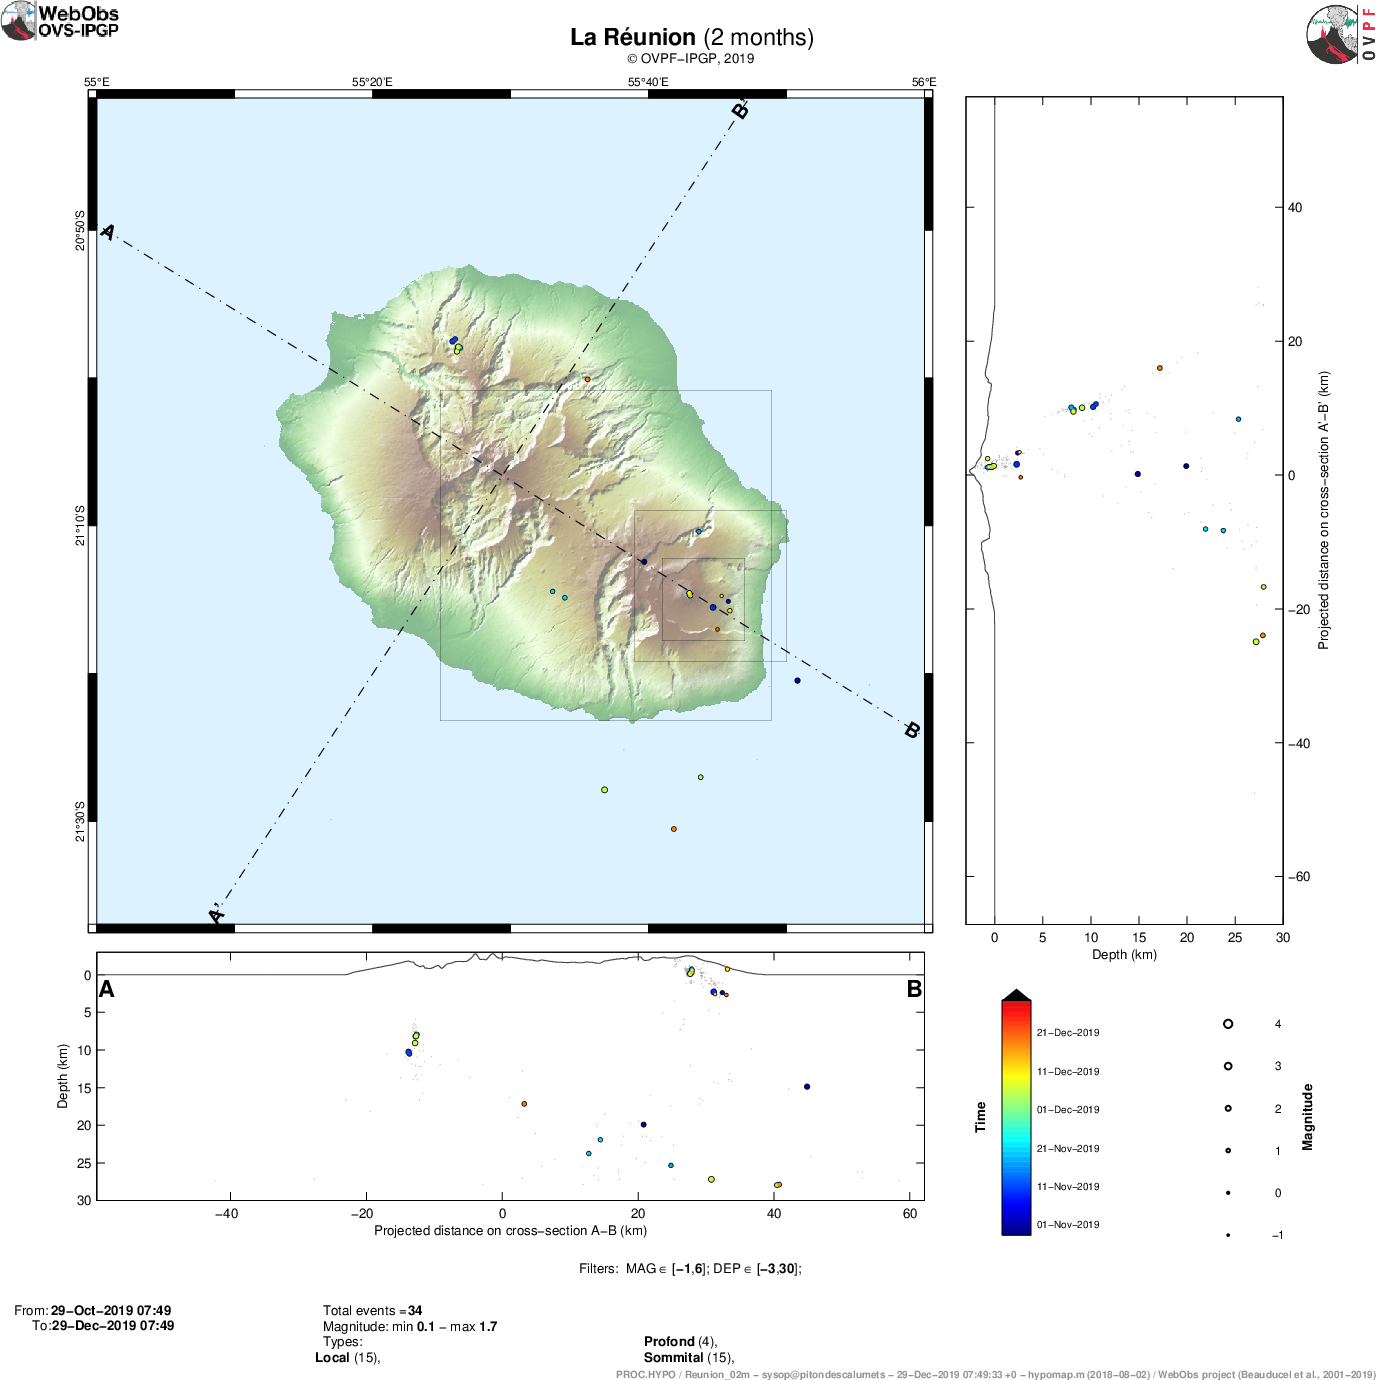
Location map (epicenters) and North-South and East-West sections (showing the location in depth, hypocenters) of earthquakes recorded and located by the OVPF-IPGP over 2 months in Reunion. Only localizable earthquakes have been represented on the map.
The observatory records seismic events not shown on this map because they cannot be located, due to their too low magnitude.
To find out the number of earthquakes detected by the observatory’s networks, you can refer to its latest Activity Bulletin.
Deformations:
– The GPS in the summit area registers an inflation, witnessing the pressurization of a surface source.
– The GPS in the far field records an inflation, witnessing the pressurization of a deep source.

Illustration of the deformation over 2 months. Here are represented baselines (variation in distance between two GPS receivers) crossing the Piton de la Fournaise building, at the top (top), at the base of the terminal cone (in the middle) and in the far field (bottom ) (see location on associated maps). An increase is synonymous with elongation and therefore swelling of the volcano; conversely, a decrease is synonymous with contraction and therefore deflation of the volcano. Any periods colored in light pink correspond to eruptions.
Geochemistry:
Geochemistry not given.
Source : OVPF.
Read the bulletin : http://volcano.ipgp.fr/reunion/Bulletin_quotidien/bulletin.html
Photo : G Vitton.