June 19 , 2024.
Iceland : Reykjanes Peninsula :
Eruption ongoing and lava flowing mostly to the northeast .
Uplift continues in Svartsengi
Updated 18. June at 15:40 UTC
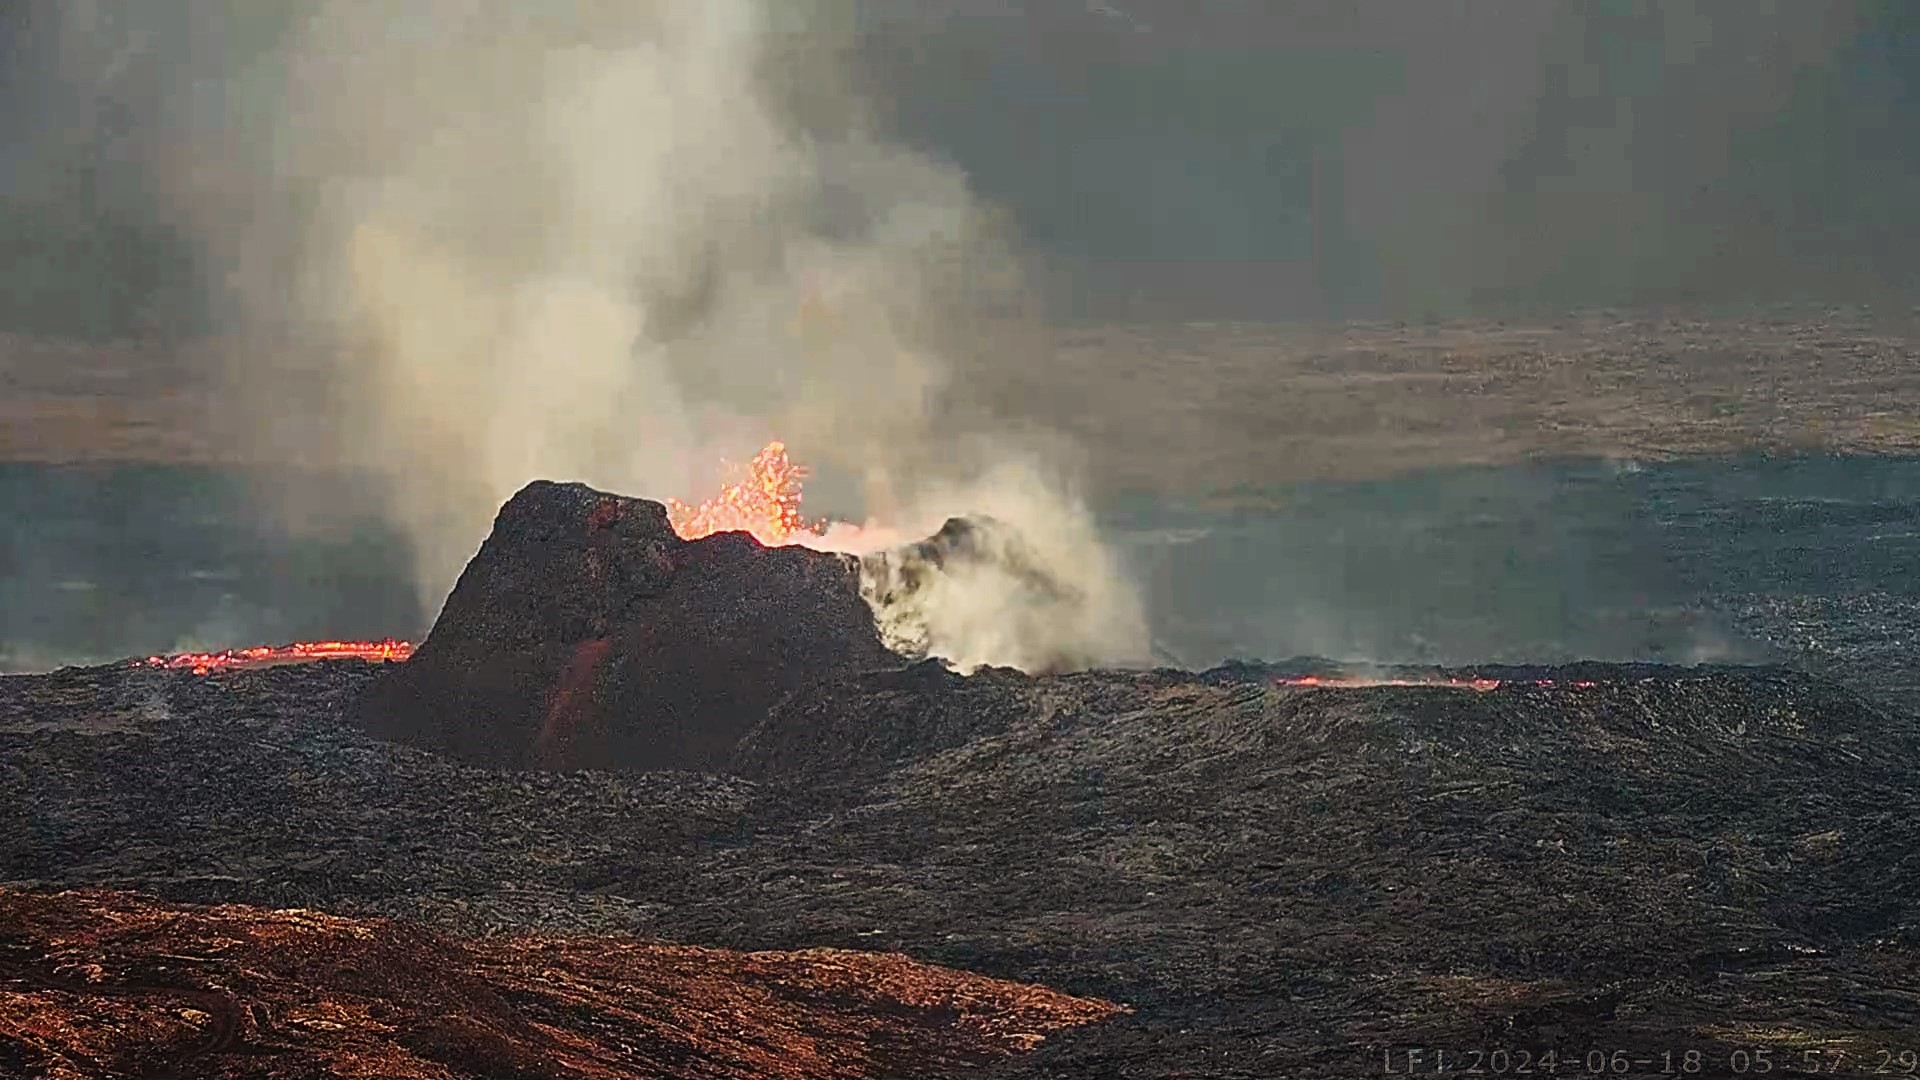
The eruption is ongoing, and lava is flowing from one crater.
Lava flows mostly to the north alongside Mt. Sýlingarfell.
Uplift continues in Svartsengi at a similar pace. The rate of uplift is slightly lower than before the eruption started.
The eruption has been rather stable the past few days and one crater remains active. Lava is flowing mostly to the north from the crater, but a part of the lava accumulates to the south of the crater. The lava that flows to the north enters the lava lake near Mt. Sýlingarfell and continues to the north where the lava field continues to thicken. A small opening in the western crater rim appeared yesterday at noon and from there a stream of lava flowed a short distance to the west towards Mt. Sundhnúkur, but that stream has since been inactive. Little to no seismicity has been detected in the area.
During the period from June 3 to June 10, the lava extrusion rate from the eruption was estimated at about 10 m³/s, and since then, there have been no significant changes in the eruption’s activity, indicating that the flow rate is stable. Despite the ongoing eruption the Svartsengi reservoir continues to display inflation (as was observed during the previous eruption). Geodetic modelling shows that the inflation of the magma reservoir beneath Svartsengi, results from an additional volume increase in the range of 1-2 m³/s. If the magma accumulation rate beneath Svartsengi is combined with the lava extrusion rate on the surface, this provides an indication of the total magma inflow from depth. There is still considerable uncertainty in the model calculations and the estimation of the lava extrusion rate from the eruption in the past week, which can affect this assessment.
The development of the unrest will continue to be closely monitored.
According to weather forecasts the wind direction is from the southeast today but more southerly tonight. Gas pollution from the eruption will go to the northwest and later to the north and increased gas pollution can be expected in northern Reykjanes. Tomorrow the wind will be light, variable and westerly later in the day. The gas pollution will then move towards the capital area. Real time measurements of air quality can be found at loftgaedi
is .
The hazard assessment that was published on the 13th of June is still valid until the 20th of June, unless any significant changes occur.
Source : IMO
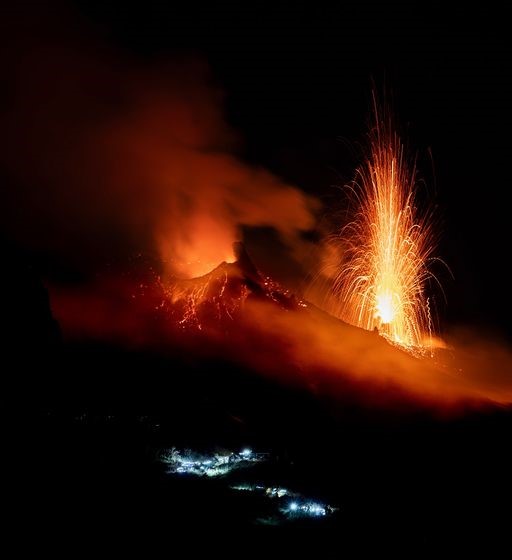
Italy , Stromboli :
WEEKLY BULLETIN, from June 10, 2024 to June 16, 2024. (issue date June 18, 2024)
SUMMARY STATEMENT OF ACTIVITY
In light of the monitoring data, it appears:
1) VOLCANOLOGICAL OBSERVATIONS: During this period, normal Strombolian activity was observed with projection activity in the northern zone. The total hourly frequency was established at high values (15-19 events/h).The intensity of the explosions was between low and medium in both areas of the crater.
2) SISMOLOGY: The monitored seismological parameters do not show significant variations.
3) GROUND DEFORMATIONS: The signals from the ground deformation monitoring networks did not show significant variations.
4) GEOCHEMISTRY: SO2 flux at medium level
The CO2 flux in the summit zone is at average values.
The C/S ratio in the plume is at average values.
There are no updates to the helium isotope ratio in the thermal aquifer.
CO2 flow in Mofeta in the San Bartolo area: increasing compared to last week.
CO2 flux in Scari: stable values at medium-high levels.
5) SATELLITE OBSERVATIONS: Thermal activity observed by satellite was generally low level with some isolated thermal anomalies of moderate level.
VOLCANOLOGICAL OBSERVATIONS
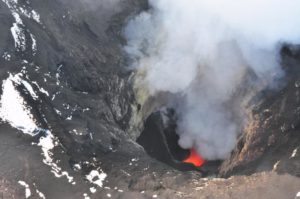
In the observed period, the eruptive activity of Stromboli was characterized through the analysis of images recorded by the INGV-OE surveillance cameras located at Pizzo (SPT), at altitude 190 m (SCT-SCV) and at Point dei Corvi (SPCT). . The explosive activity was mainly produced by 3 eruptive vents located in the northern zone of the crater and by 1 vent located in the south central zone.
Observations of explosive activity captured by surveillance cameras.
In the area of the North crater (N), with two vents located in sector N1 and one in sector N2, explosive activity was observed which was mainly of low intensity (less than 80 m in height) and medium (less than 150 m high). . Furthermore, projection activity was observed, sometimes intense in sector N1, particularly on June 10 and 15. The products emitted in the eruption were mainly coarse materials (bombs and lapilli). The average frequency of explosions varied between 9 and 13 events/h.
In the South-Central (CS) zone, sectors C and S1 showed no activity, while in sector S2 the explosions varied in intensity from low (less than 80 m in height) to high (more than 150 m height) emitting fine materials mixed with coarse materials. The average frequency of explosions varied from 4 to 8 events/h.
Source : INGV
Photo : Stromboli stati d’animo / Sebastiano Cannavo.
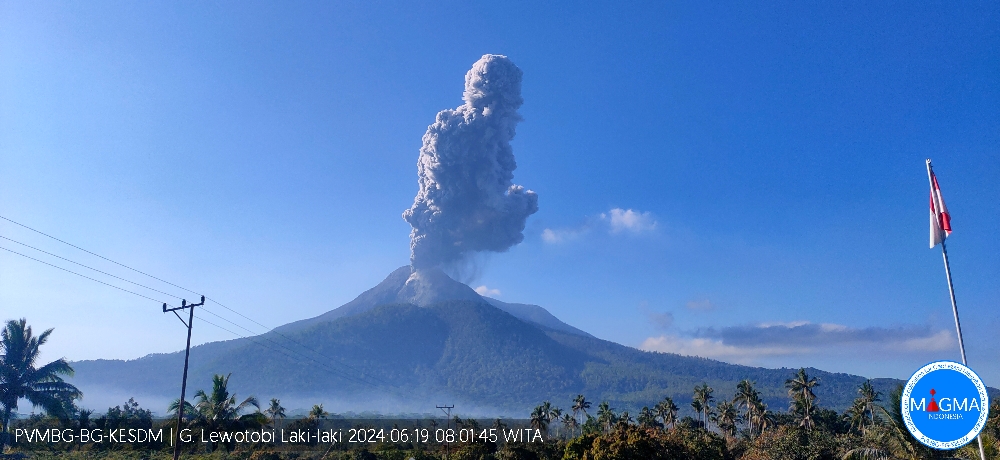
Indonesia , Lewotobi Laki-laki :
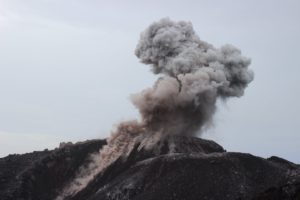
An eruption of Mount Lewotobi Laki Laki occurred on Wednesday June 19, 2024 at 07:58 WITA with the height of the ash column observed at ±900 m above the summit (±2484 m above sea level) . The ash column was observed to be gray with thick intensity, oriented towards the South-West and West. At the time of writing, the eruption was still ongoing.
VOLCANO OBSERVATORY NOTICE FOR AVIATION – VONA
Issued : June 18 , 2024
Volcano : Lewotobi Laki-laki (264180)
Current Aviation Colour Code : ORANGE
Previous Aviation Colour Code : orange
Source : Lewotobi Laki-laki Volcano Observatory
Notice Number : 2024LWK087
Volcano Location : S 08 deg 32 min 20 sec E 122 deg 46 min 06 sec
Area : East Nusa Tenggara, Indonesia
Summit Elevation : 5069 FT (1584 M)
Volcanic Activity Summary :
Eruption with volcanic ash cloud at 23h58 UTC (07h58 local).
Volcanic Cloud Height :
Best estimate of ash-cloud top is around 7949 FT (2484 M) above sea level or 2880 FT (900 M) above summit. May be higher than what can be observed clearly. Source of height data: ground observer.
Other Volcanic Cloud Information :
Ash cloud moving from southwest to west. Volcanic ash is observed to be gray. The intensity of volcanic ash is observed to be thick.
Remarks :
Eruption recorded on seismogram with maximum amplitude 47.3 mm and maximum duration 279 second.
Source et photo : Magma Indonésie.
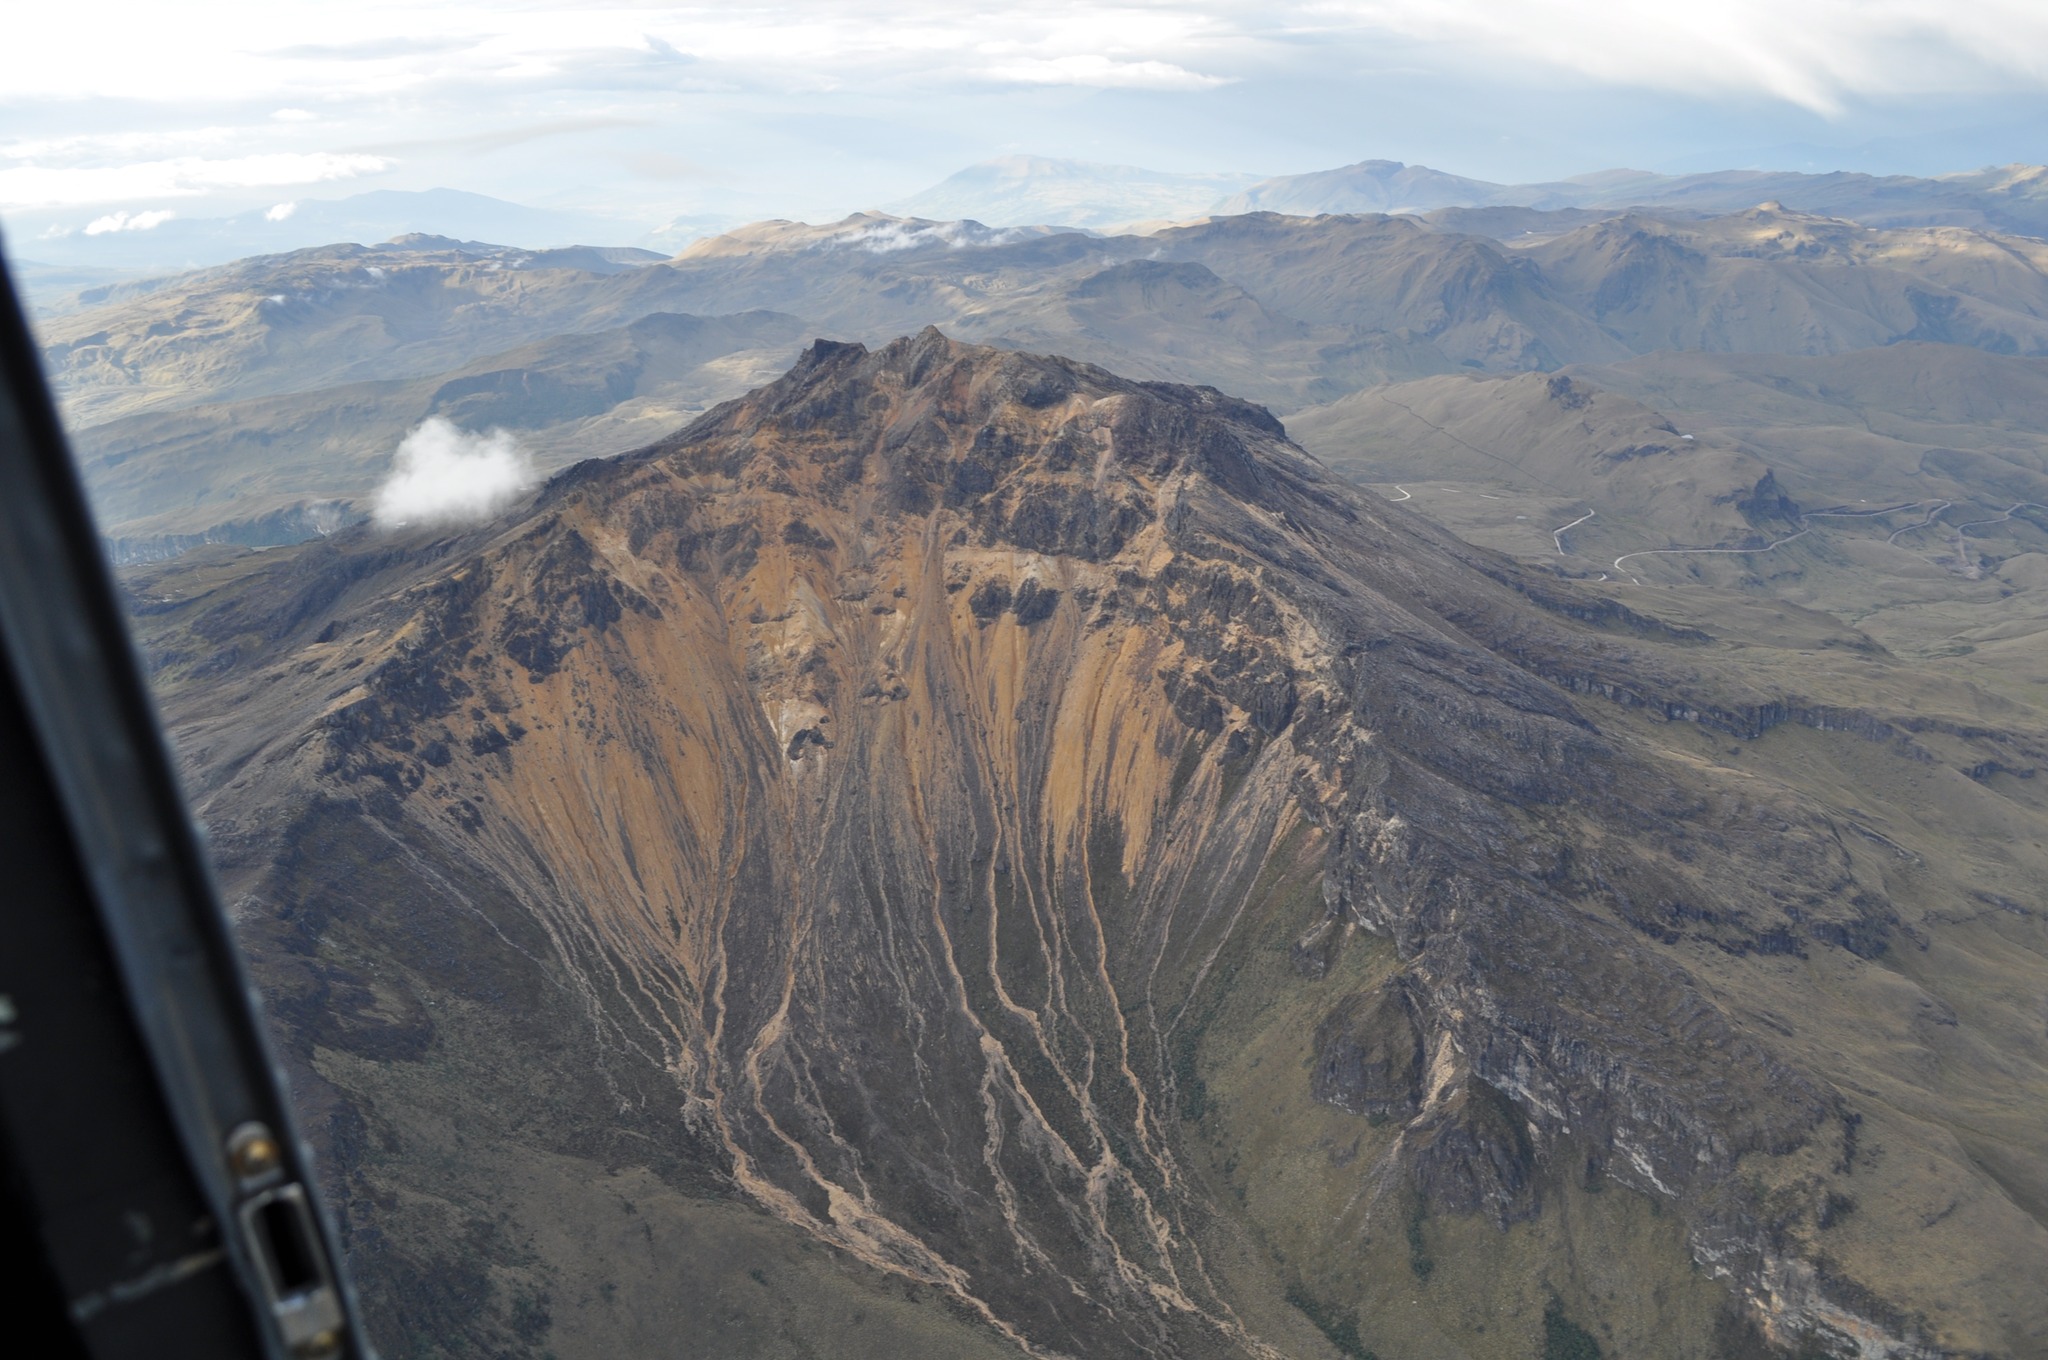
Colombia , Chiles / Cerro Negro :
San Juan de Pasto, June 18, 2024, 3:35 p.m.
Weekly activity bulletin: Chiles Volcanic Complex and Cerro Negro (CVCCN):
Regarding the monitoring of the activity of the CHILES AND CERRO NEGRO VOLCANOES, the COLOMBIAN GEOLOGICAL SERVICE (SGC), an entity attached to the MINISTRY OF MINES AND ENERGY, reports that:
During the week evaluated, between June 11 and 17, 2024 and compared to previous weeks, an increase in the frequency of earthquakes was recorded, but with a decrease in their energy levels. The predominance of seismicity associated with rock fracture has remained, both in terms of occurrence and energy, and the recording of earthquakes associated with fluid movement also continues, some of them with lower frequencies very low dominants.
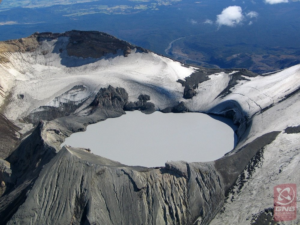
The fracture earthquakes were preferentially located in 2 sources. The first at the summit, in the collapse zone existing to the north of the summit of the Chiles volcano, at distances less than 1.2 km, with depths between 2 and 5 km compared to the reference height (4,700 m above sea level) and maximum magnitude of 1.1.
The second source was located south-southeast of the summit of Chiles Volcano, at distances between 0.3 and 4.0 km, with depths between 3 and 8 km and a maximum magnitude of 2.0. A few other earthquakes were located scattered toward the southeast of Chiles Volcano, at distances up to 14 km, with depths close to 12 km from the summit of Chiles Volcano and a maximum local magnitude of 0, 9.
Volcanic deformation processes recorded by sensors installed on the ground and by remote satellite sensors continue. The evolution of activity in the CVCCN is the result of internal processes derived from the complex interaction between the magmatic system, the hydrothermal system and the geological faults of the area. Therefore, the probability of the occurrence of energetic earthquakes that can be felt by residents in the region of influence of the CVCCN persists.
Volcanic activity remains in a YELLOW ALERT state: active volcano with changes in the behavior of the base level of monitored parameters and other manifestations.
Source et photo : SGC
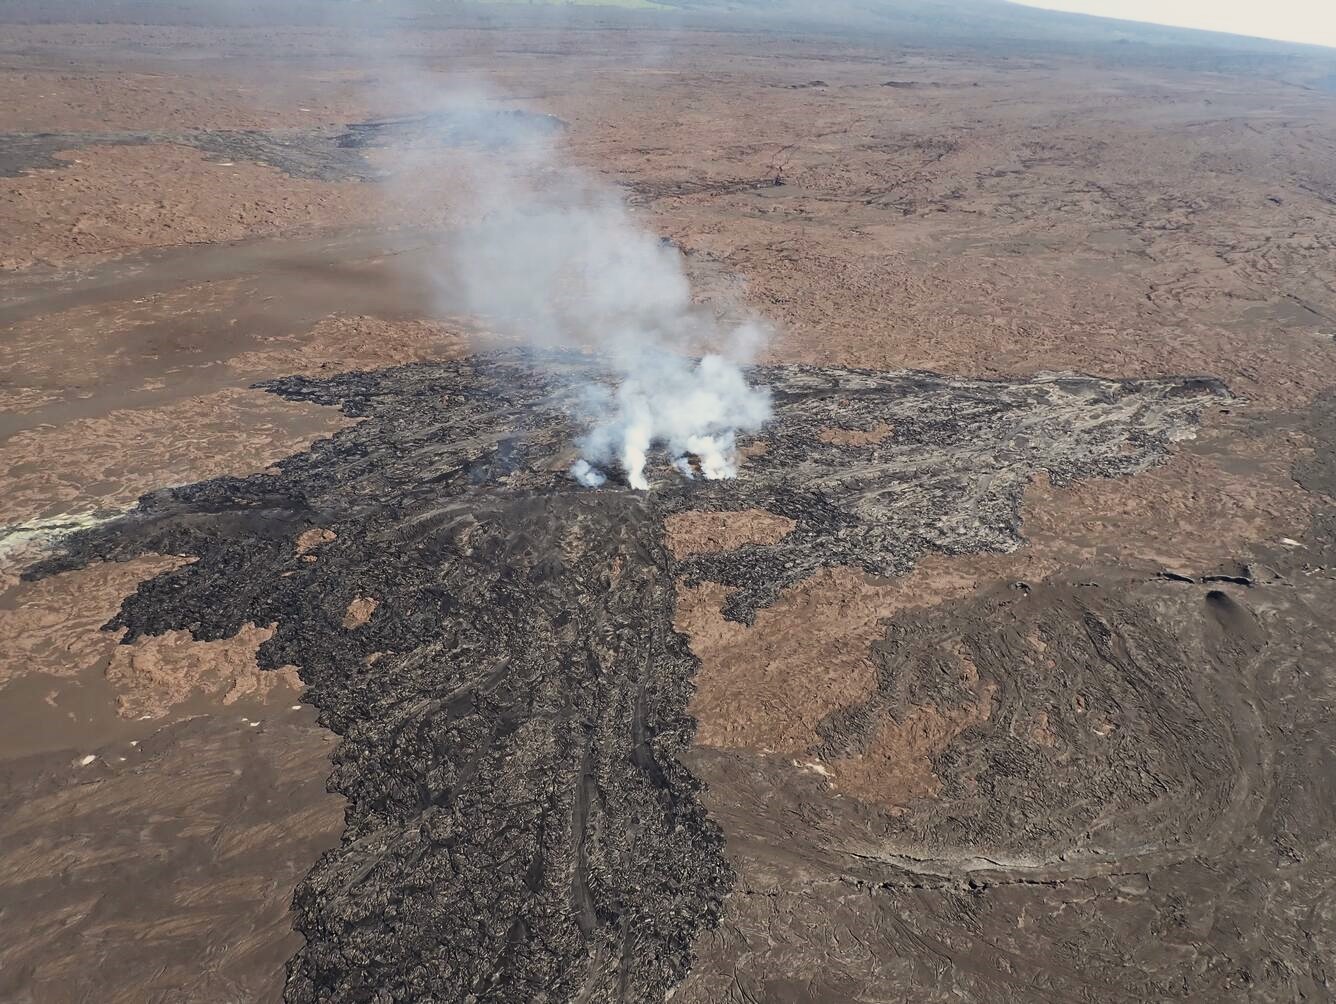
Hawaii , Kilauea :
Tuesday, June 18, 2024, 9:11 AM HST (Tuesday, June 18, 2024, 19:11 UTC)
19°25’16 » N 155°17’13 » W,
Summit Elevation 4091 ft (1247 m)
Current Volcano Alert Level: ADVISORY
Current Aviation Color Code: YELLOW
Activity Summary:
Kīlauea volcano is not erupting. Earthquake counts and rates of inflationary ground deformation in the summit and upper rift zones have resumed the slightly elevated behavior of last week after a two-day lull. Any additional or renewed increase in seismicity and/or deformation could result in new eruptive episodes within or near the summit region.
Recent Eruption Site Observations:
Kīlauea erupted briefly on Monday, June 3, southwest of Kaluapele (Kīlauea caldera) within a closed area of Hawai’i Volcanoes National Park. Glow from fissure vents is no longer visible in webcam imagery. SO2 emissions from the eruption site have likely decreased since the most recent measurement and may be around 50-100 tonnes per day (t/d) (similar to background emission levels at the summit). Seismic activity remains low at the eruption site.
Summit and Upper Rift Zone Observations:
Rates of seismicity beneath the summit, upper East Rift Zone, and upper Southwest Rift Zone have returned to slightly elevated levels. Over 35 earthquakes occurred over the past 24 hours. Earthquakes were mostly located beneath the south caldera region and upper East Rift Zone, at depths of 1.5-3 km (1–1.8 miles), with magnitudes under M2.5. Ground deformation data at the summit shows resumed steady inflation. The Uēkahuna tiltmeter northwest of the summit recorded overall inflation of approximately 6 microradians over the past 24 hours. The Sand Hill tiltmeter southwest of the summit recorded approximately 3 microradians of inflation over the past 24 hours. The most recent summit SO2 emission rate measured was approximately 50 t/d on June 10, 2024; accordingly, total SO2 emissions from the summit and recent eruption site are likely less than 200 t/d.
Lower Rift Zone Observations:
Rates of seismicity and ground deformation beneath the middle and lower East Rift Zone and lower Southwest Rift Zone are low. Eruptive activity and unrest have been restricted to the summit and upper rift zone regions. Measurements from continuous gas monitoring stations downwind of Puʻuʻōʻō in the middle East Rift Zone remain below detection limits for SO2, indicating that SO2 emissions from Puʻuʻōʻō are negligible.
Source : HVO
Photo : USGS / A.R. Nalesnik. (archive)