December 04 , 2021.
Spain / La Palma , Cumbre Vieja :
December 03, 2021, 09:00 UTC. Eruptive activity continues on La Palma.
Since the last declaration, a total of 77 earthquakes have been located in the area affected by the volcanic reactivation on the island of La Palma, of which 5 were felt by the population.
Seismicity continues below the central area of Cumbre Vieja in the same areas of the previous days, 76 of these earthquakes are located at depths of 9 to 18 km and only one at a depth of about 30 km.
The maximum recorded magnitude is 4.2 (mbLg) corresponding to yesterday’s earthquake at 21:11 UTC, with a depth of 11 km and an intensity V (EMS98).
The amplitude of the tremor signal was maintained at low levels.

The island’s network of permanent GNSS stations shows an elevation of about 6 cm at station LP03, which is closest to the eruptive centers.
In the rest of the stations, the slight deflation possibly linked to the deep seismicity has stabilized, except in LP01 which continues to record it.
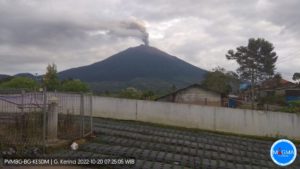
In view of the image calibrated at 08:30 UTC, an ash cloud height of 1900 m is estimated, and a cloud diffuses in a south-southwest direction.
The height of the cone is measured by obtaining a value of 1.125 m on sea level.
Sulfur dioxide emission associated with the volcanic plume records high values, with a downward trend that has occurred since September 23. Diffuse emission of carbon dioxide has been at stable values since November 15. The air quality due to the presence of sulfur dioxide is at levels between good, reasonably good and regular, depending on the areas, while the quality for particles smaller than 10 microns is at an unfavorable level in Los Llanos de Aridane and between good and regular levels in the rest of the areas.
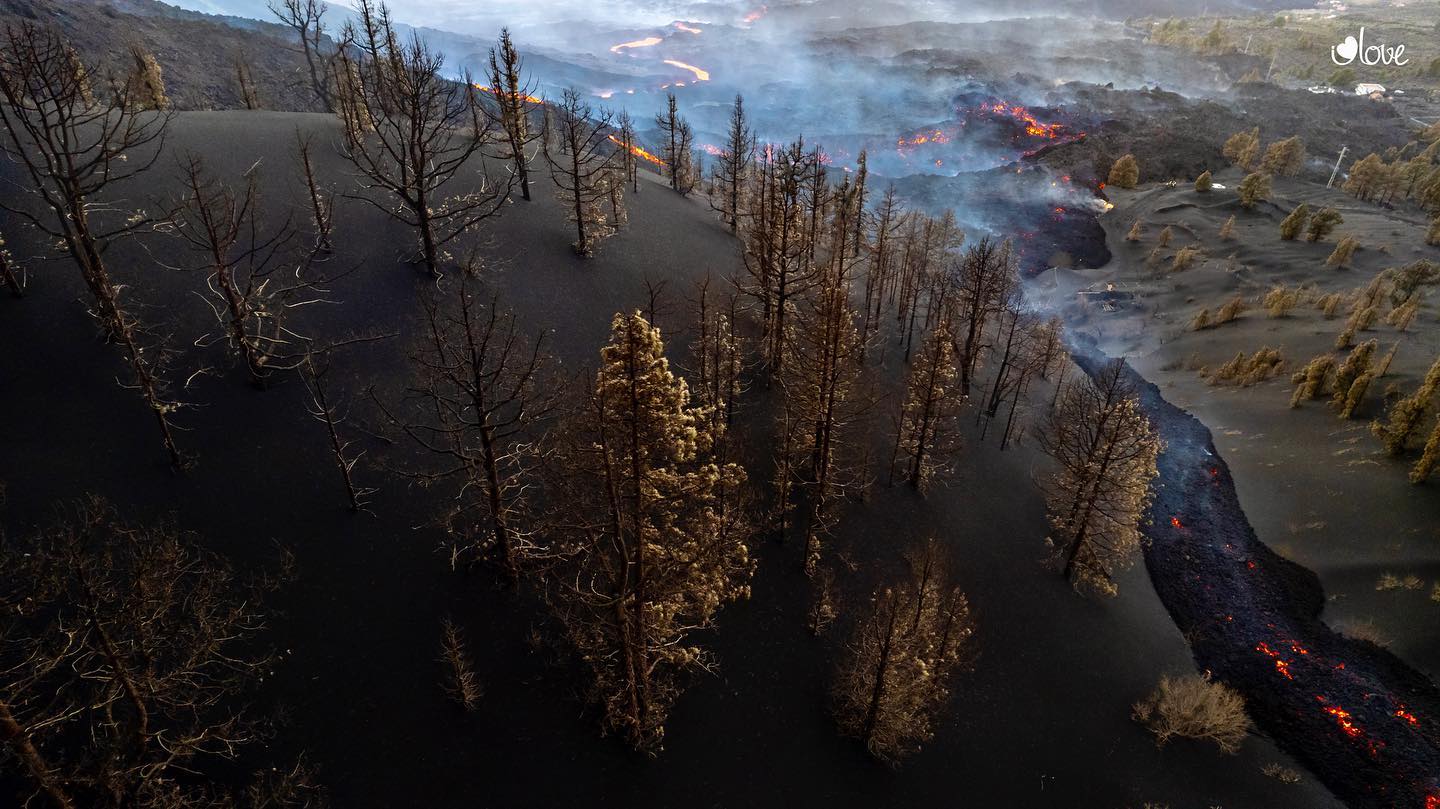
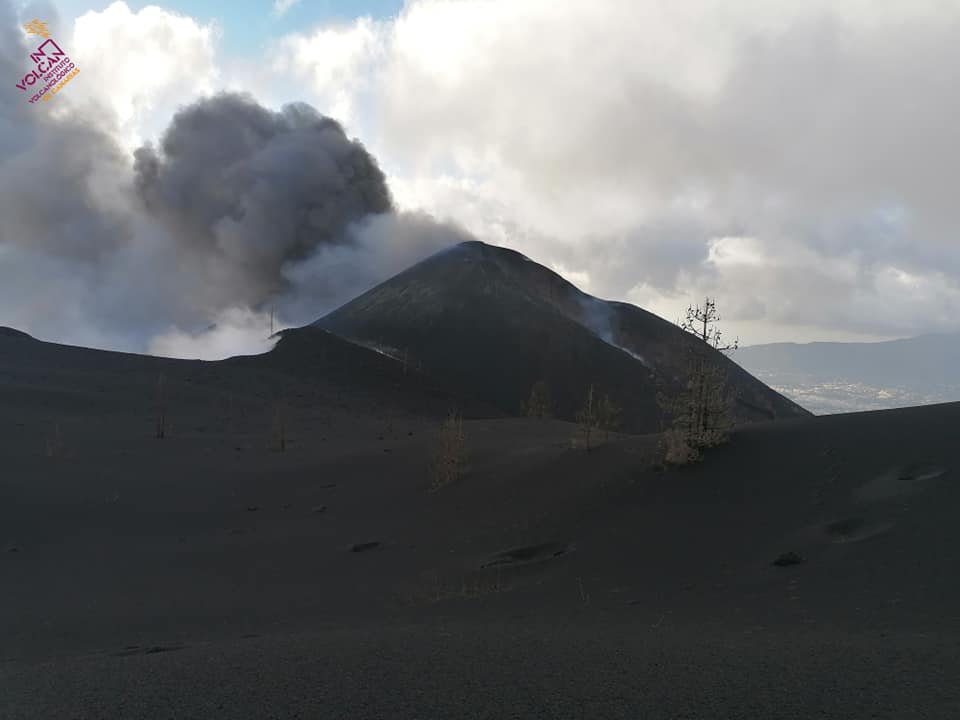
A new flow has emerged from one of the former emitting foci of the La Palma volcano and is heading southwest towards the Las Manchas region, spokespersons for the Special Protection Plan reported on Friday. civil and emergency care for volcanic risk (Pevolca).
Francisco Prieto, spokesperson for the technical committee of Pevolca, explained that it is still early to talk about the magnitude of this new flow, but the first news suggests that at the moment it is passing through already occupied areas. . In the northern part, there was not much variation in the flows, except for a small advance in the upper area which flows slowly and reaches the Tacande road without really separating from the flow. original. The main lava flow passes through the central area, with little velocity.
Sources : IGN es , El Pais .
Photos : Involcan , I love the world .
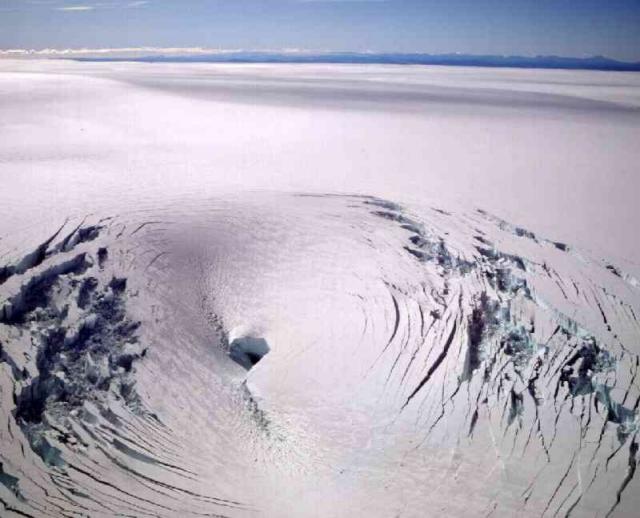
Iceland , Grímsvötn :
Update 3.12. at 15:07
The icesheet in Grímsvötn started to subside and the water started to drain out from the lake 10 days ago. IMO‘s GPS instruments show that the icesheet has now sunk over 27 meters. This morning, between 10:15 and 12:20, hydrologists from IMO measured a discharge rate of about 1600 m3/s in Gígjukvísl. The electrical conductivity, which is an indicator of the amount of geothermal meltwater in the river, has also been increasing over the last couple of days and it was over 464 µS/cm today. Higher than normal gas concentrations have been measured at the glacier edge, but they are currently within the health and safety levels.
The newest measurements are consistent with the flood forecast model, and it is highly likely that the flood will peak on Sunday.
There are past examples of Grímsvötn eruptions started following a flood. The loss of the water from Grímsvötn lake reduces the pressure on top of the volcano and this can allow an eruption to begin. This happened in 2004, and before that in 1934 and in 1922. In 2004 the eruption started three days after the first observations were made of flood onset. There were a series of earthquakes in the days preceding the eruption. No such earthquakes have been measured now.
The last eruption in Grímsvötn was in 2011. There was a flood 6 months prior to that eruption. Since 2011 there have been 6 floods without an eruption in the aftermath.
Recent eruptions in Grímsvötn have happened every 5-10 years and, considering measurements and observations, scientists agree that Grímsvötn is ready to erupt. It is still not possible, however, to anticipate if there will be an eruption following the current flood or not. IMO is monitoring the area very carefully to see if there are any indications of increased seismicity or gases that might indicate an imminent eruption.
IMO and scientists from the Institute of Earth Sciences continue to monitor Grímsvötn and will continue to provide updates as events evolve.
GPS measurements in Grímsvötn show that the ice-cap has subsided by about 38 meters.
Glacialwater flows towards Gígjukvísl river, there on Nov. 29th between 09:30 and 10:20 the discharge measured at 240 m3/s. On Dec. 1st between 15:00-16:30 the discharge measured 660 m3/s. On December 2nd between 09:40 and 11:20 the discharge measured 924 m3/s. Measurements from 16:20 – 18:15 concluded 1140 m3/s. discharge. Yesterday between 10:15 and 12:20 the discharge measured 1600 m3/s. Between 16:40 and 18:40 the discharge was 1850 m3/s.
Source : Vedur is .
Photo : GVP Smithsonian.
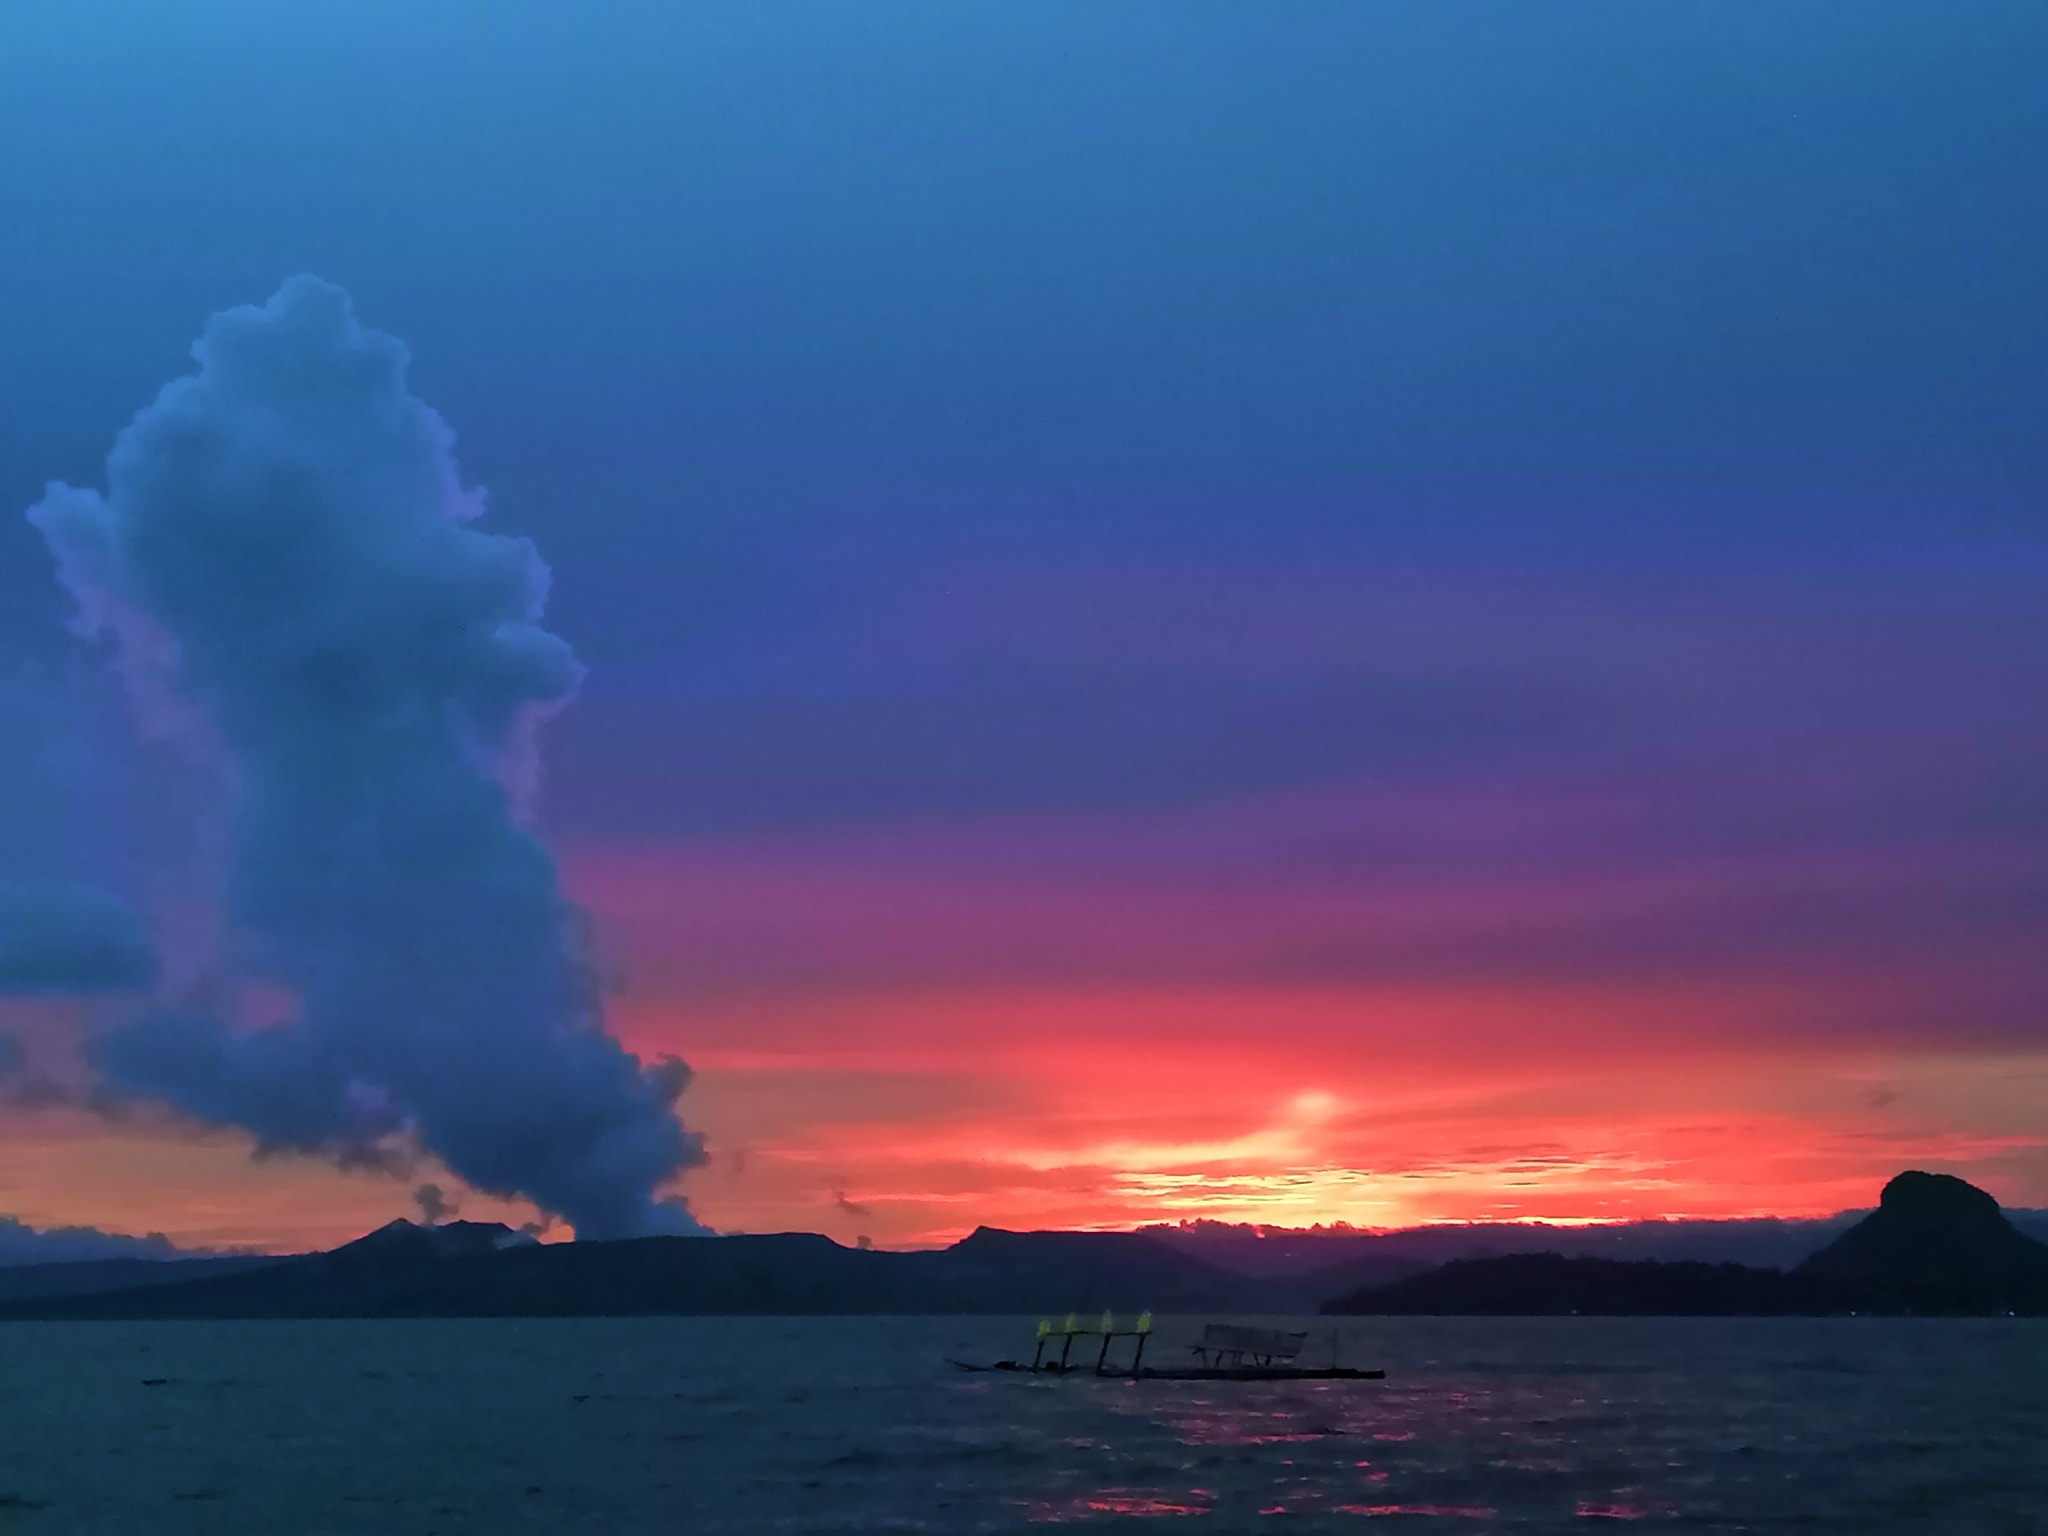
Philippines , Taal :
TAAL VOLCANO BULLETIN 04 December 2021 8:00 AM
In the past 24-hour period, the Taal Volcano Network recorded eighty-one (81) volcanic earthquakes, including seventy-three (73) volcanic tremor events having a duration of one (1) to six (6) minutes, eight (8) low-frequency volcanic earthquakes, and low-level background tremor that has persisted since July 7, 2021. Activity at the Main Crater was dominated by upwelling of hot volcanic fluids in its lake which generated plumes 300 meters tall that drifted southwest. Sulfur dioxide (SO2) emission averaged 3,648 tonnes/day on 3 December 2021. Based on ground deformation parameters from electronic tilt, continuous GPS and InSAR monitoring, Taal Volcano Island and the Taal region has begun deflating in October 2021.
Alert Level 2 (Increased Unrest) prevails over Taal Volcano. DOST-PHIVOLCS reminds the public that at Alert Level 2, sudden steam- or gas-driven explosions, volcanic earthquakes, minor ashfall, and lethal accumulations or expulsions of volcanic gas can occur and threaten areas within and around TVI. DOST-PHIVOLCS strongly recommends that entry into Taal Volcano Island, Taal’s Permanent Danger Zone or PDZ must be strictly prohibited, especially the vicinities of the Main Crater and the Daang Kastila fissure, and extended stays on Taal Lake.
Source : Phivolcs .
Photo : Paleny Paleny.
Ecuador , Sangay :
Activity from 01 to 02 December:
From 4:00 p.m. (TL) on December 1, the SAGA seismic station, located southwest of the Sangay volcano, recorded a swarm of long-period type seismic events (LP; Fig. 1, red arrow to the left of the ‘image), which were associated with the movement of fluids in the volcano. During this process, the first report was published documenting this anomaly in the internal activity of the volcano. The number of these seismic events has increased at a rate of up to 60 events per hour, starting at 11:56 p.m. TL on December 1. The magnitude and frequency of occurrence of events increased. It should be noted that it was possible to record them in regional stations such as PUYO and BULB (Tungurahua). After that, a second report was released reporting this increase in the number of events and magnitudes.
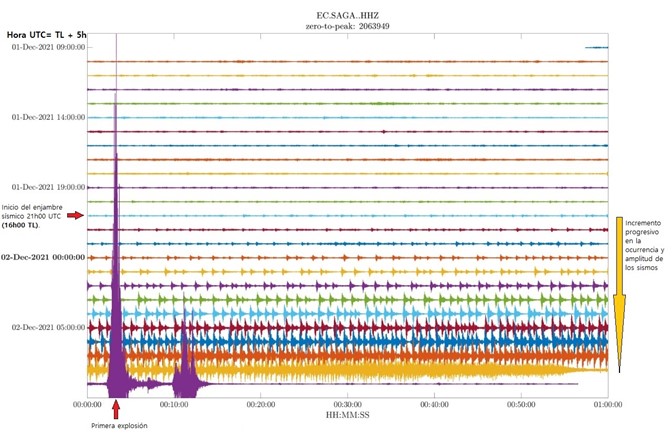
At 04:03 (TL) on December 2, the SAGA seismic station recorded a major explosion (Fig. 1, red arrow at the bottom of the image). Subsequently, the WASHINGTON VAAC reported varying heights of the emission columns between 7 and 10 km above crater level. This explosion and the scattering of the emission column have been reported in two reports, warning of the possible scattering of ash. In coordination with the National Risk and Emergency Management Service (SNGRE), information was gathered on the damage caused by the volcanic ash, which, with an outage until 12:30 p.m. TL on December 2, indicated that no ash fall has only been recorded nationally. For this reason, we can conclude that the ash content of the eruptive column was low, without being transported to the nearest towns, located about 25 km from the volcano.
Technical-scientific appendix, Degassing and sulfur dioxide (SO2) measurements.
Degassing data shows an increase from the third week of November compared to previous months. The maximum value recorded last week is 1705 tonnes. In Figure 2, the black (moving average) and red (cumulative) lines show the upward trend in data for the third week of November.
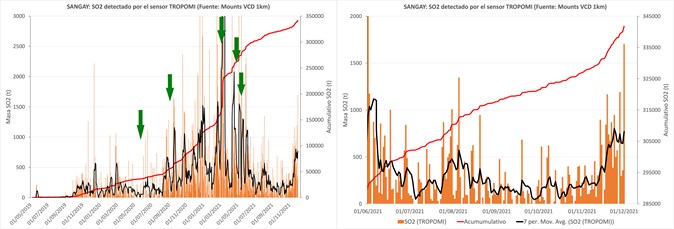
Graph 2. Left: Chronological series of degassing of the Sangay volcano for the current eruptive period. Orange bars are the mass of SO2 reported by MOUNTS (http://www.mounts-project.com/timeseries/352090) using the TROPOMI satellite sensor. The black line represents the weekly moving average of the data, while the red line highlights the cumulative value of the data. The green arrows in the graph on the left point to some of the most significant eruptions that have occurred, namely: June 8-9, 2020, September 20, 2020, March 5-6 and March 11, 2021, April 12, 2021 and May 7, 2021 .
The permanent DOAS (Differential Optical Absorption Spectroscopy) station located in Atillo (about 30 km west of the volcano) did not show significant changes in the daily values of emission rate for this volcano, however, an increase in the number of valid measurements is observed from the third week of November 2021. This increase in the number of valid measurements at the DOAS station reflects a stability in terms of the permanence of the gas in the environment, on the station. The maximum value recorded by the station last week is 450 tonnes / day, common values for the current activity of the volcano.
While the weather conditions did not allow a completely clear view of the volcano, images obtained by SENTINEL-2 and the MOUNTS satellite system (http://www.mounts-project.com/timeseries/352090) show a new flow of lava (Fig. 4) which is emitted by a new vent observed on the northern flank of the volcano. At the time of publication of this report, the number and intensity of thermal anomalies exhibited by the MIROVA system remain high (Fig. 5).

Graph 4. Overlay SENTINEL-2 images on SENTINEL-1. The map identifies the thermal anomaly (star and red polygon) observed by the SENTINEL-2 satellite. In the same figure, you can see other important morphological features, such as the edge of the southeast ravine (black polygon), the central crater (orange triangle).
Source : IGEPN.
Read the full article: https://www.igepn.edu.ec/servicios/noticias/1904-informe-volcanico-especial-sangay-2021-n-03
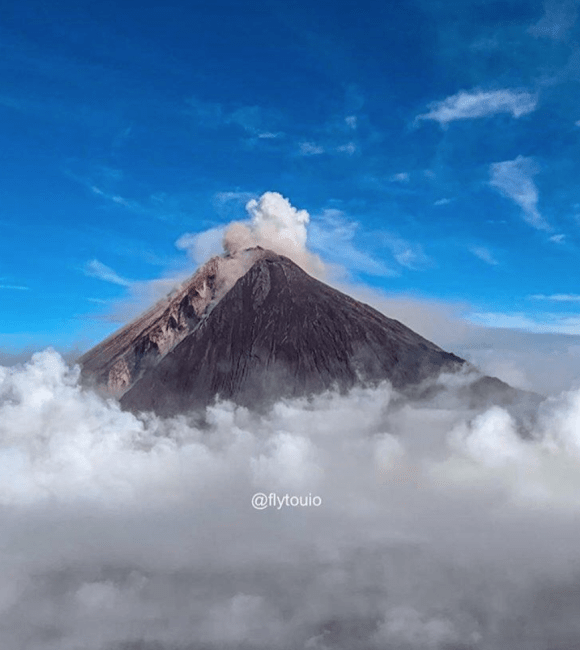
Photo : flytouio
Alaska , Great Sitkin :
52°4’35 » N 176°6’39 » W,
Summit Elevation 5709 ft (1740 m)
Current Volcano Alert Level: WATCH
Current Aviation Color Code: ORANGE
Lava effusion within the summit crater of Great Sitkin Volcano continues at a slow rate according to observations made throughout the week. The overall level of seismicity is low. Elevated surface temperatures consistent with lava effusion were detected in satellite data all week when the volcano was not obscured by cloud cover. No ash emissions were observed and no local observations have been reported to AVO this week.
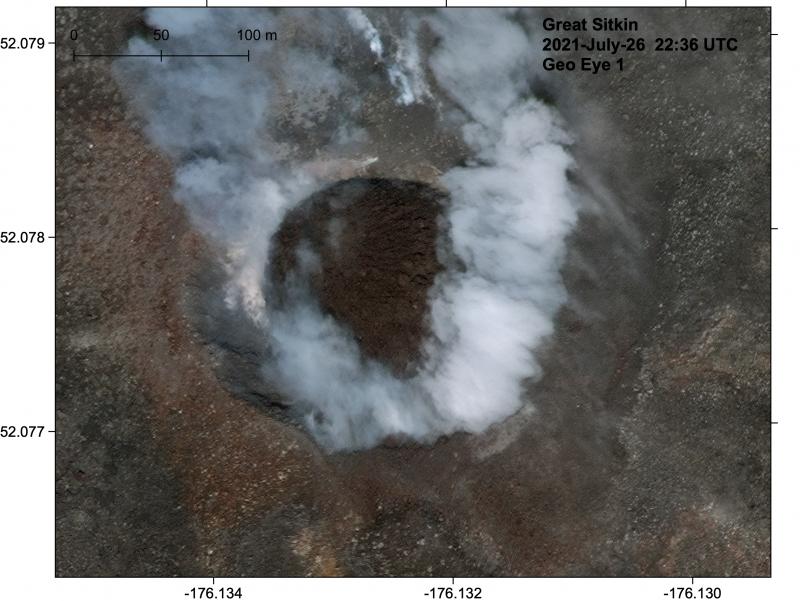
Erupted lava has overtopped the summit crater rim and is flowing into small valleys on the south, west, and north flank of the volcano. The terrain is steep in these areas, and blocks of lava and lava rubble could detach from the terminus of the flow lobes without warning and form small rock avalanches in these valleys. Such avalanches may liberate ash and gas and could travel several hundred meters beyond the lava flows; they would be hazardous to anyone in those areas.
Great Sitkin is monitored by local seismic and infrasound sensors, satellite data, web cameras, and remote infrasound and lightning networks.
Source : AVO.
Photo : Loewen, Matt