September 02 , 2018.
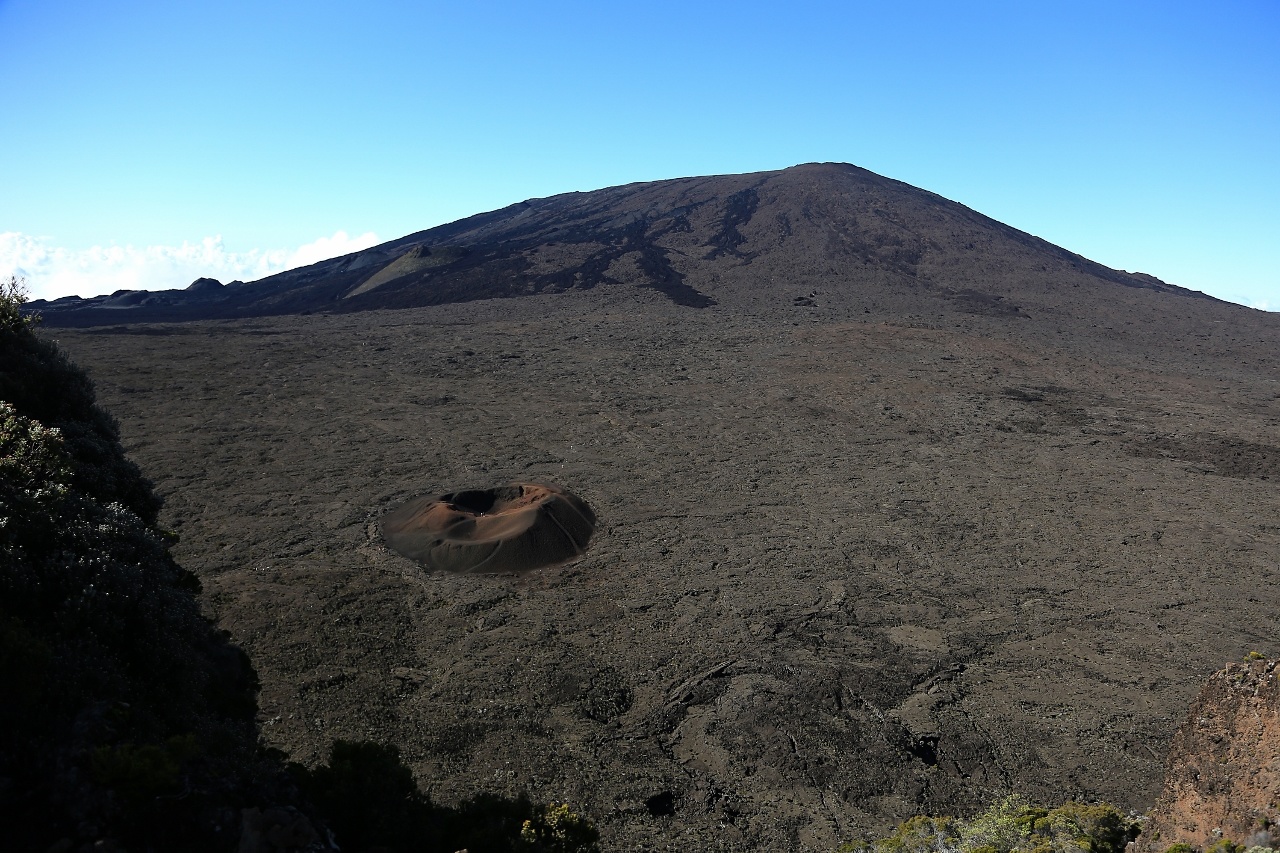
La Réunion , Piton de la Fournaise :
Latitude: 21.244°S Longitude: 55.708°E
Summit elevation: 2632 m
Piton de la Fournaise is a basaltic hot spot volcano located in the southeast of La Réunion Island (Indian Ocean). Piton de la Fournaise first erupted about 500,000 years ago. Its volcanic activity is characterized by frequent effusive eruptions (with emissions of lava fountains and lava flows) that occur on average twice a year since 1998. More rarely, larger explosive eruptions (with blocks covering the summit area and ash emissions that can disperse over long distances) have happened in the past with a centennial recurrence rate. Most of the current eruptive activity (97% during the last 300 years) occurs from vents inside the Enclos Fouqué caldera. A few eruptions, however, have occurred from vents outside the caldera (most recently in 1977, 1986, and 1998).
Since late 1979, the activity of Piton de la Fournaise is monitored by the Piton de la Fournaise Volcanological Observatory (Observatoire Volcanologique du Piton de la Fournaise – OVPF), from Institut de Physique du Globe de Paris (IPGP).
Seismicity
In August 2018, the OVPF recorded at Piton de La Fournaise:
• 36 shallow volcano-tectonic earthquakes (0 to 2 km depth) below the summit craters;
• 2 deep earthquakes (>2 km depth below the surface);
• 161 rockfalls (inside the Cratère Dolomieu or along the cliff of the Enclos Fouqué caldera).
The volcano-tectonic activity below the Piton de la Fournaise summit remained low in August 2018 (36 summit volcanotectonic earthquakes and 2 deep earthquakes in one month.
Deformation
The edifice inflation, which was recorded since the end of the July, 13 2018 eruption, stopped at the beginning of August. Since then, the OVPF deformation networks did not record any significant deformation
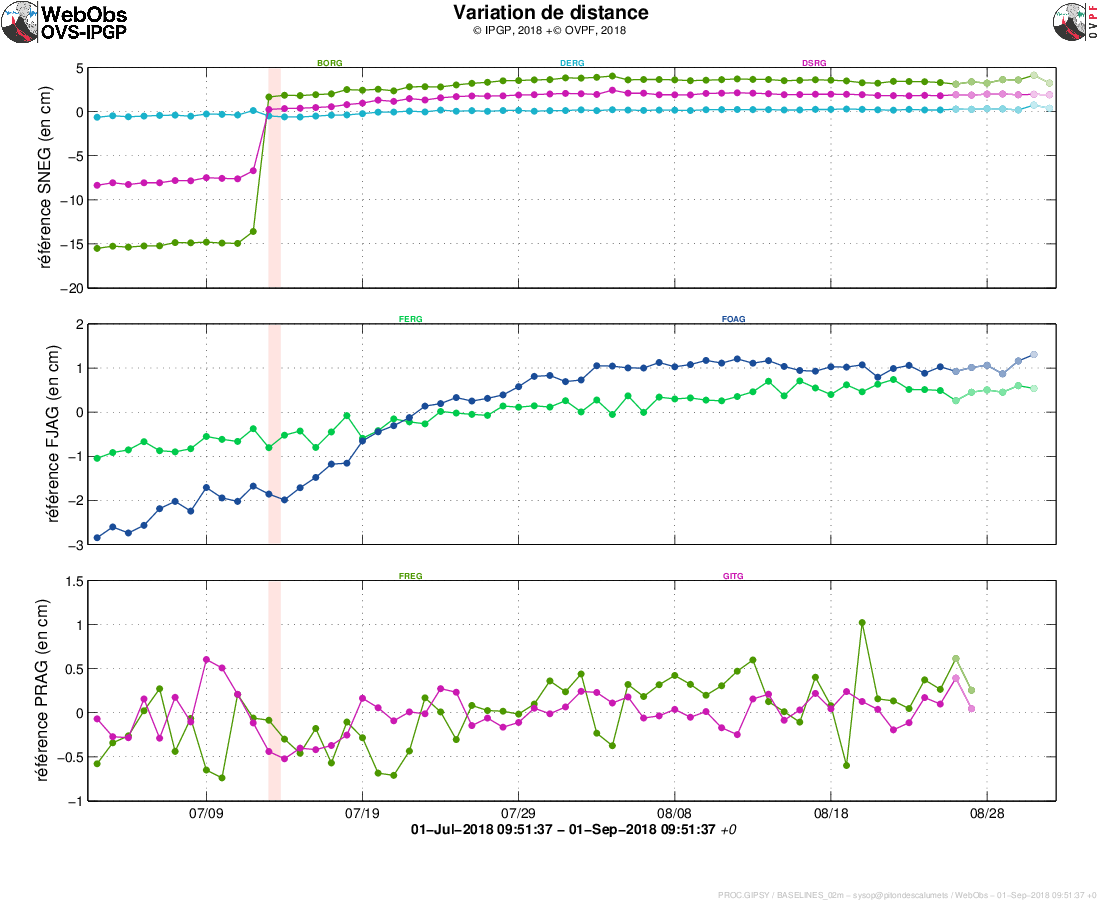
Illustration of the deformation over 2 months. Here are shown baselines (variation of distance between two GPS receivers) crossing the Piton de la Fournaise building, at the top (at the top), at the base of the terminal cone (in the middle) and in the far field (at the bottom ) (see location on the associated maps). A rise is synonymous with elongation and therefore swelling of the volcano; conversely, a decrease is synonymous with contraction and therefore deflation of the volcano. Any periods colored in light pink correspond to eruptions.
Gas geochemistry
CO 2 concentration in the soil
– In the far field ( i.e. at the Plaine des Cafres and Plaine des Palmistes sectors ) : in August, CO2 concentrations in the soil were stable at intermediate values .
– In the near field ( i.e. at the « Gîte du volcan » sector ) : the CO2 concentrations in the soil were stable at low values (except the last measurements on August 29).
Summary
Deep magma recharge and pressurization of the shallow magma reservoir that had resumed following the end of the July 13 eruption appear to have stopped after early August.
Nevertheless, the soil CO2 concentrations in the far-field (Plaine des Cafres, Plaine des Palmistes) are still high, which are signs of magma being present at great depth.

Note that since 2016, deep magma recharge below Piton de la Fournaise is discontinuous and occurs in pulses. For example, several periods ranging from 15 to ~80 days that were characterized by no deformation and low seismic activity have been observed in 2016 and 2017. Given the amount of magma that is already stored within the shallow magma reservoir, any new influx of magma from depth into the reservoir could potentially trigger the onset of a new eruption, as observed in 2016 or 2017. At that time, a high state of initial reservoir pressurization is thought to be the reason for relatively short time spans (of only 1-25 days) between evidence of deep magmatic feeding (from seismicity and ground deformation) and the onset of a new eruption.
Source : OVPF.
Photo : B Duyck. G. Vitton.
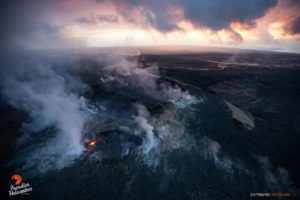
Ecuador / Galapagos , Sierra Negra :
End of the current eruptive episode.
abstract:
Over the past week, the monitoring parameters of the Sierra Negra volcano, located on Isabela Island in the Galapagos, have been steadily declining. This volcano initiated the current eruptive process in the afternoon of June 26 this year after several months of turbulence. The eruption was characterized by the continuous emission of lava flows along 5 eruptive fissures located on the north and northwest flanks of the volcano, areas far removed from the inhabited area of Puerto Villamil. The presence of 5 activity pulses that showed an increase in the rate of lava emission was highlighted. These pulses were observed due to an increase in the number and energy levels of thermal anomalies and were detected as volcanic tremor pulses.
According to the follow-up carried out by the IGEPN, the eruption was divided into two main phases:
• The first phase lasted less than a day (only June 26th), but it was the most energetic. During this period, all cracks (1, 2, 3, 4 and 5) were active, emitting lava flows up to 7 km downstream without reaching the sea.
• On the other hand, the second eruptive phase lasted about 57 days (from June 27 to August 23) and focused on crack 4. During this period, the lava flows released reached the sea on the 6th July, increasing the area of Ecuadorian territory by 1.5 km2 in the Elizabeth Bay area.
During this eruptive period, the Sierra Negra volcano emitted lava flows that covered about 30.6 km2. Thanks to the permanent monitoring network, information from the IGEPN and the satellites have shown that the eruptive activity has decreased during the last week, announcing the end of this eruptive episode which lasted 58 days. It is not excluded that in the future a new episode may occur, as has been the case in previous eruptions on the Galapagos volcanoes, so that constant monitoring is maintained.
Follow-up of the eruptive period:
The IGEPN has a permanent network of seismic monitoring stations that allow to follow the volcanic processes of the Galapagos in real time. This information is and has been supplemented by satellite data during the eruptive process of the Sierra Negra volcano. The complete evolution of SO2 (volcanic gas) degassing processes recorded by AURA / OMI and Suomi NPP / OMP, the thermal anomalies observed by the MODIS satellite and near-real-time GOES-16 satellite images, as well as seismic stations have allowed us to follow in detail the evolution of the eruptive process.
Figure 1 shows the progressive decrease in the number of earthquakes with amplitudes greater than 290 μm / s (magnitude about 2.1) from its record level of 38 events recorded on June 26 to less than three events per day last week .
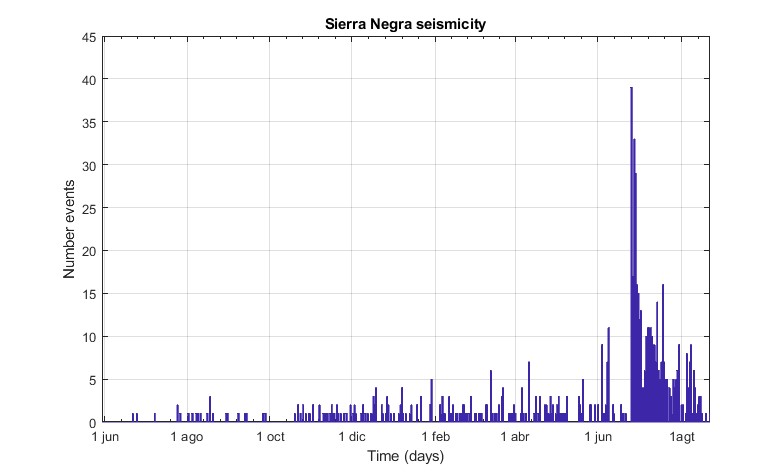
Figure 1. Daily number of earthquakes with magnitude greater than 2.1 recorded on the Sierra Negra volcano. The decrease in these parameters can be observed up to values equal to those prior to eruption.
Figure 2 shows several pulses or stages where the eruption was more intense (higher lava extrusion rate). These were recorded both by seismic stations and by satellite images and reported in due time in special earlier reports. The five most important impulses took place on July 1st, 2nd, 7th and 8th and on August 4th and 9th, 2018 (green bars).
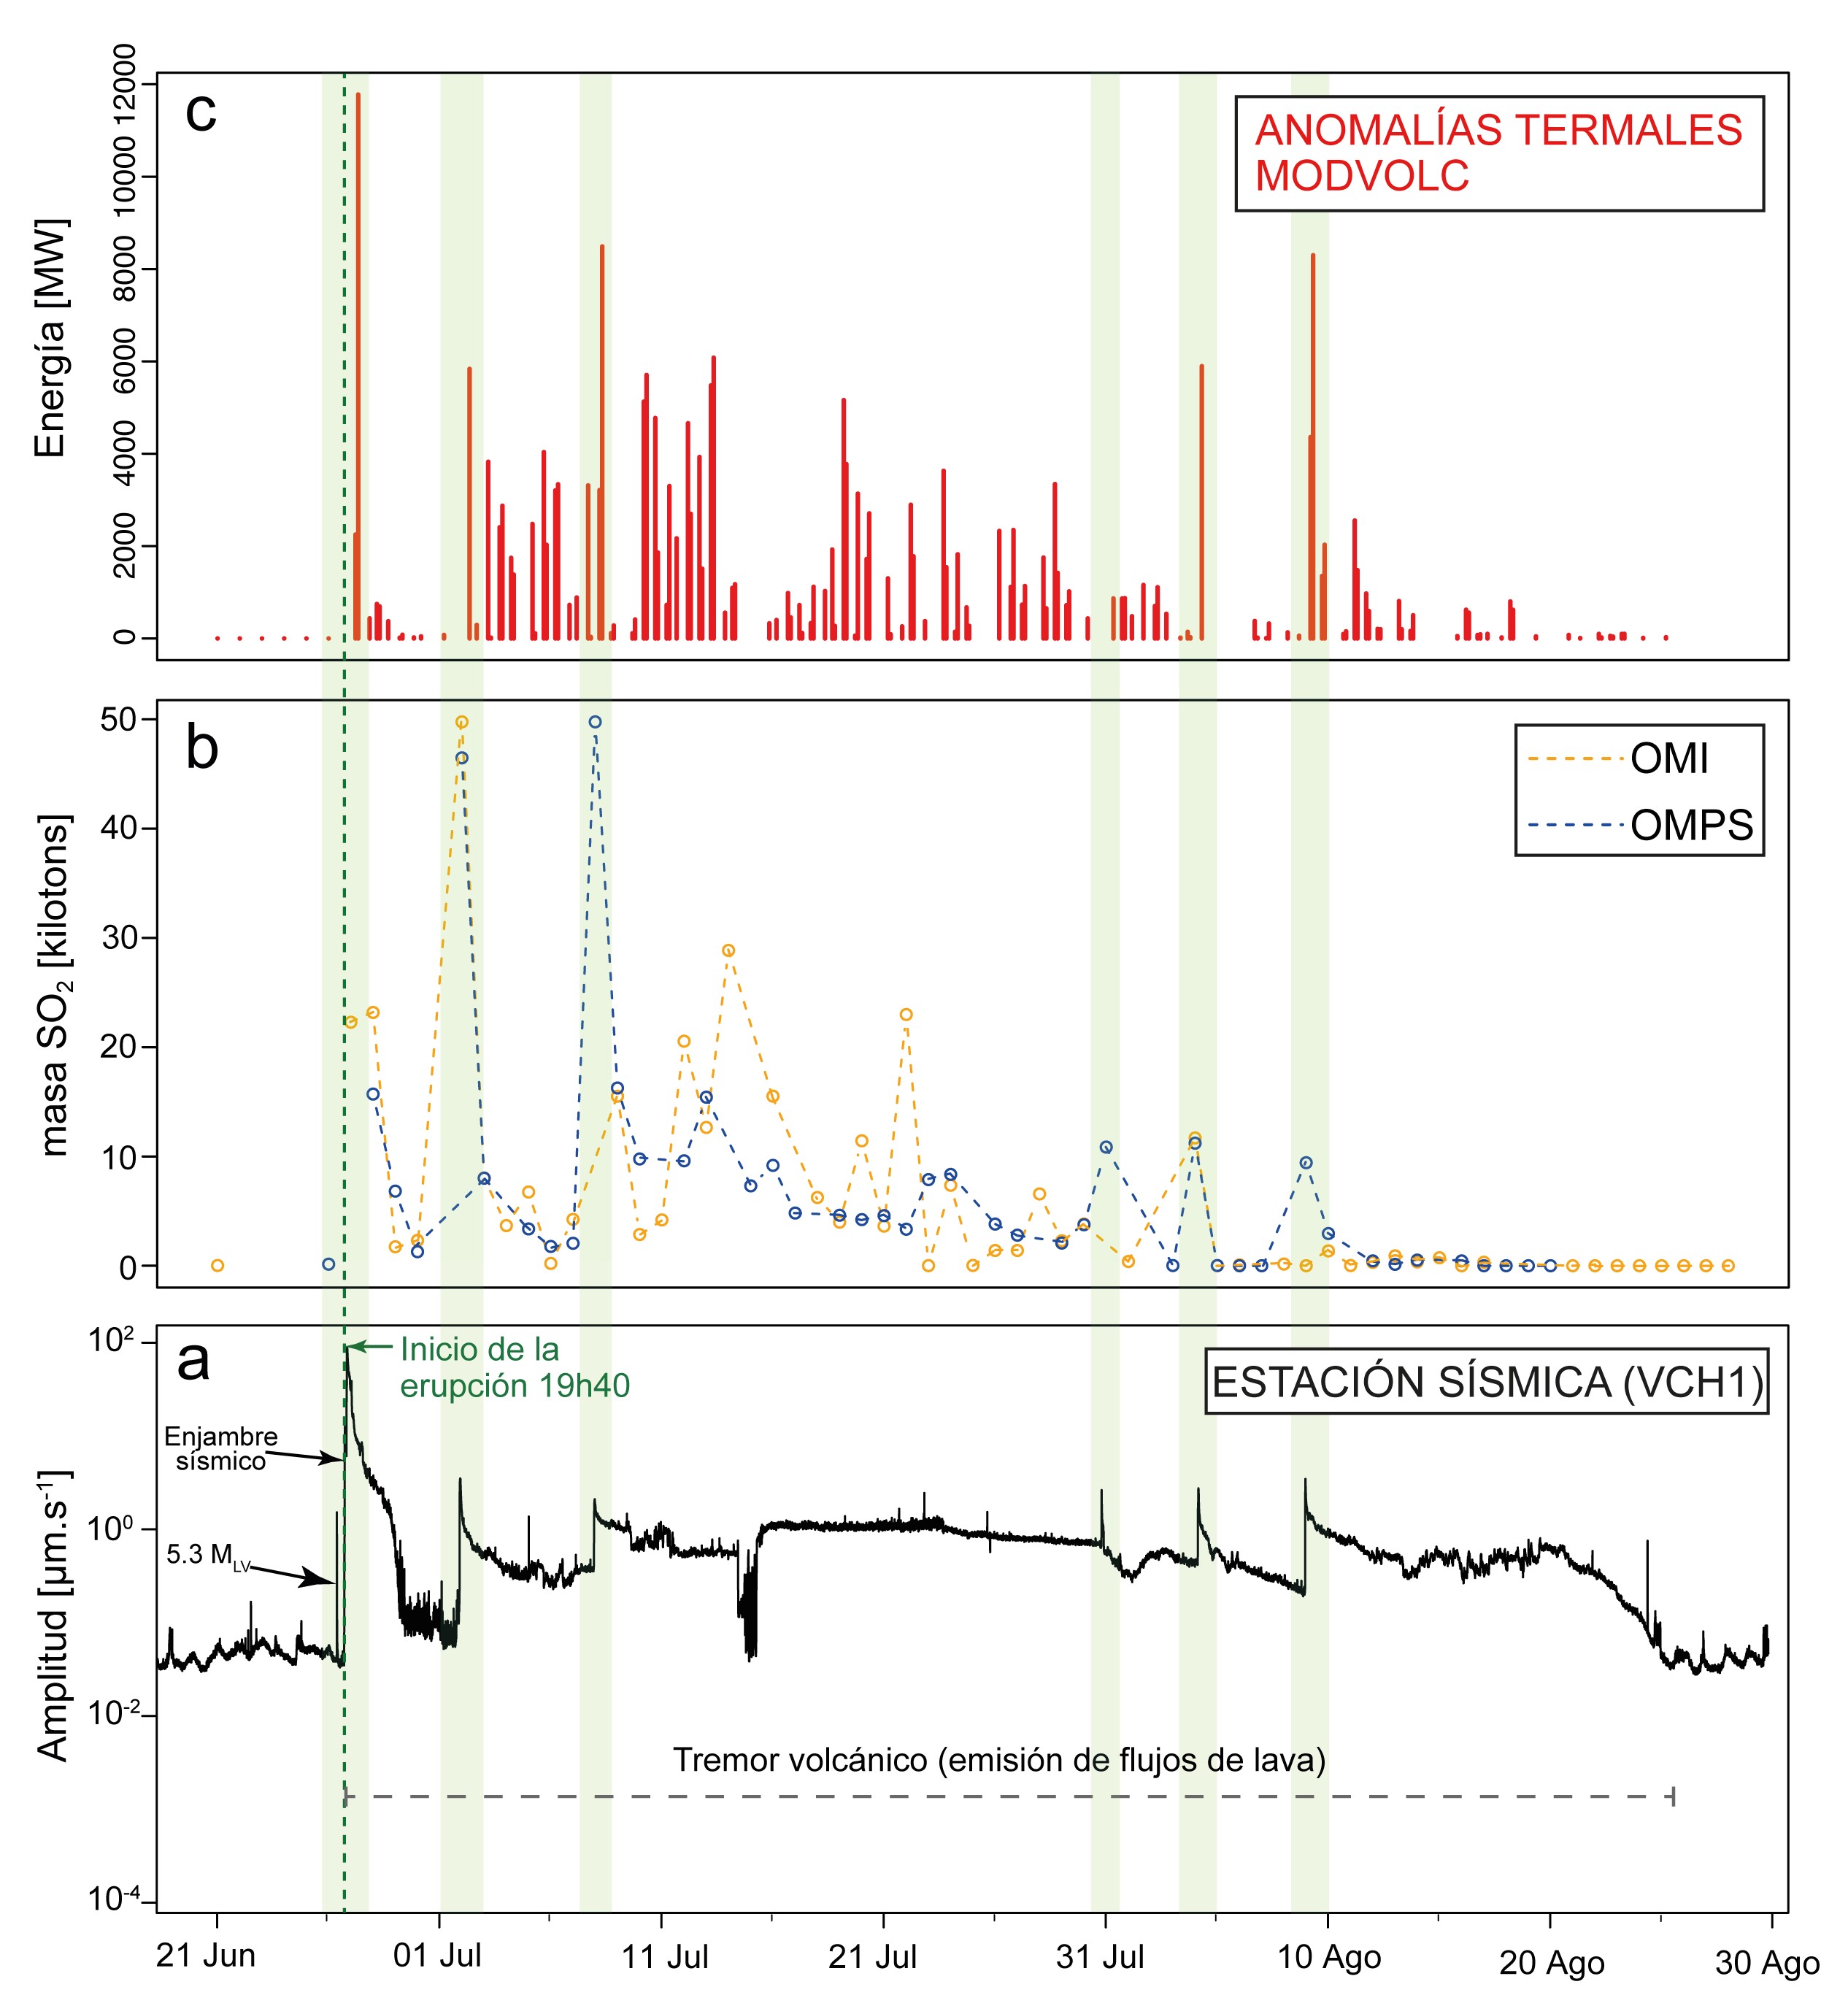
Figure 2. Multi-parametric image of the eruption of the Sierra Negra volcano from June 21 to August 30, 2018. The broken green line marks the beginning of the eruption, while the green bars indicate the different eruptive pulses recorded during the eruption. . this eruptive period. a) Seismic energy data (RSAM) recorded by the VCH1 station (see Figure 4 for the station location), within 10 minutes between 1 and 8 Hz. b) Recorded SO2 degassing time series IMO and OMPS satellites. Data downloaded from https://so2.gsfc.nasa.gov/pix/daily/0718. c) Thermal anomalies recorded by MODVOLC. Data downloaded from http://modis.higp.hawaii.edu/.
These tremor pulses are characterized by their greater amplitude in the VCH1 station (see Figure 4), located on the Chico volcano, the closest to Fissure 4. Figure 3 shows that the tremor has frequencies between 1 and 4. Hz, very different from the frequencies associated with marine activity. The last tremor impulse occurred on August 9th (Figure 2).
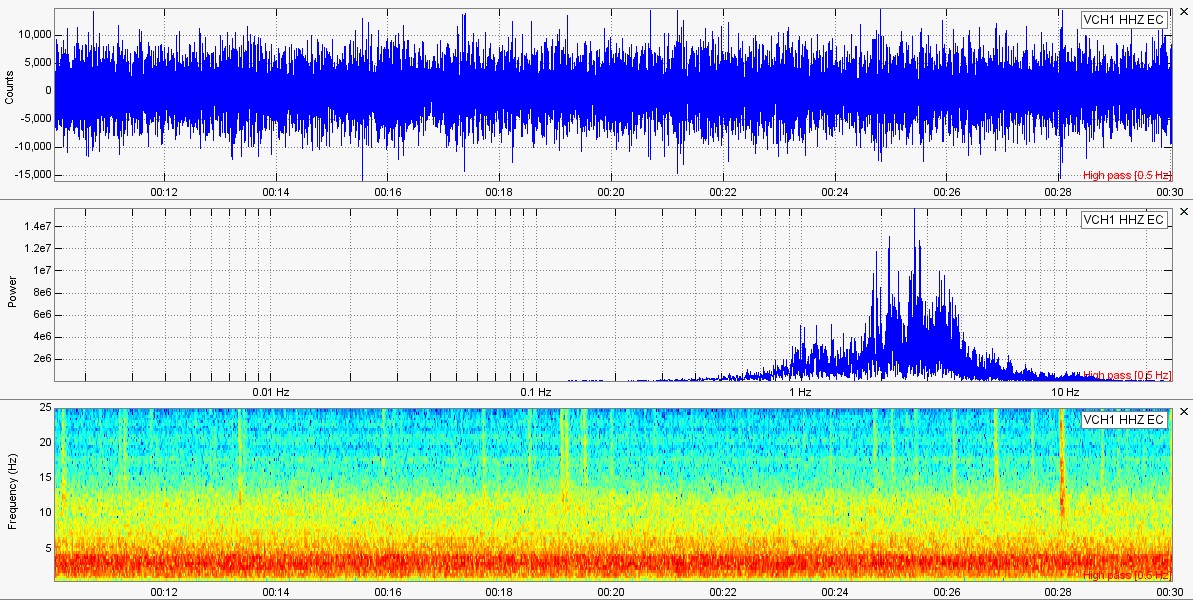
Figure 3.- Volcanic tremor signal recorded in the VCH1 station, located on the northeast flank of the Sierra Negra caldera. The upper panel indicates the seismic trace of July 8 at 00:10 UT (18:10 local time of the Galapagos). The central panel shows its frequency spectrum in logarithmic scale where the highest concentration of energy in the band between 1 and 4 Hz is observed. The lower panel shows the distribution of the amplitudes, represented by the color, corresponding to the frequencies (vertical axis) over time.
…/…
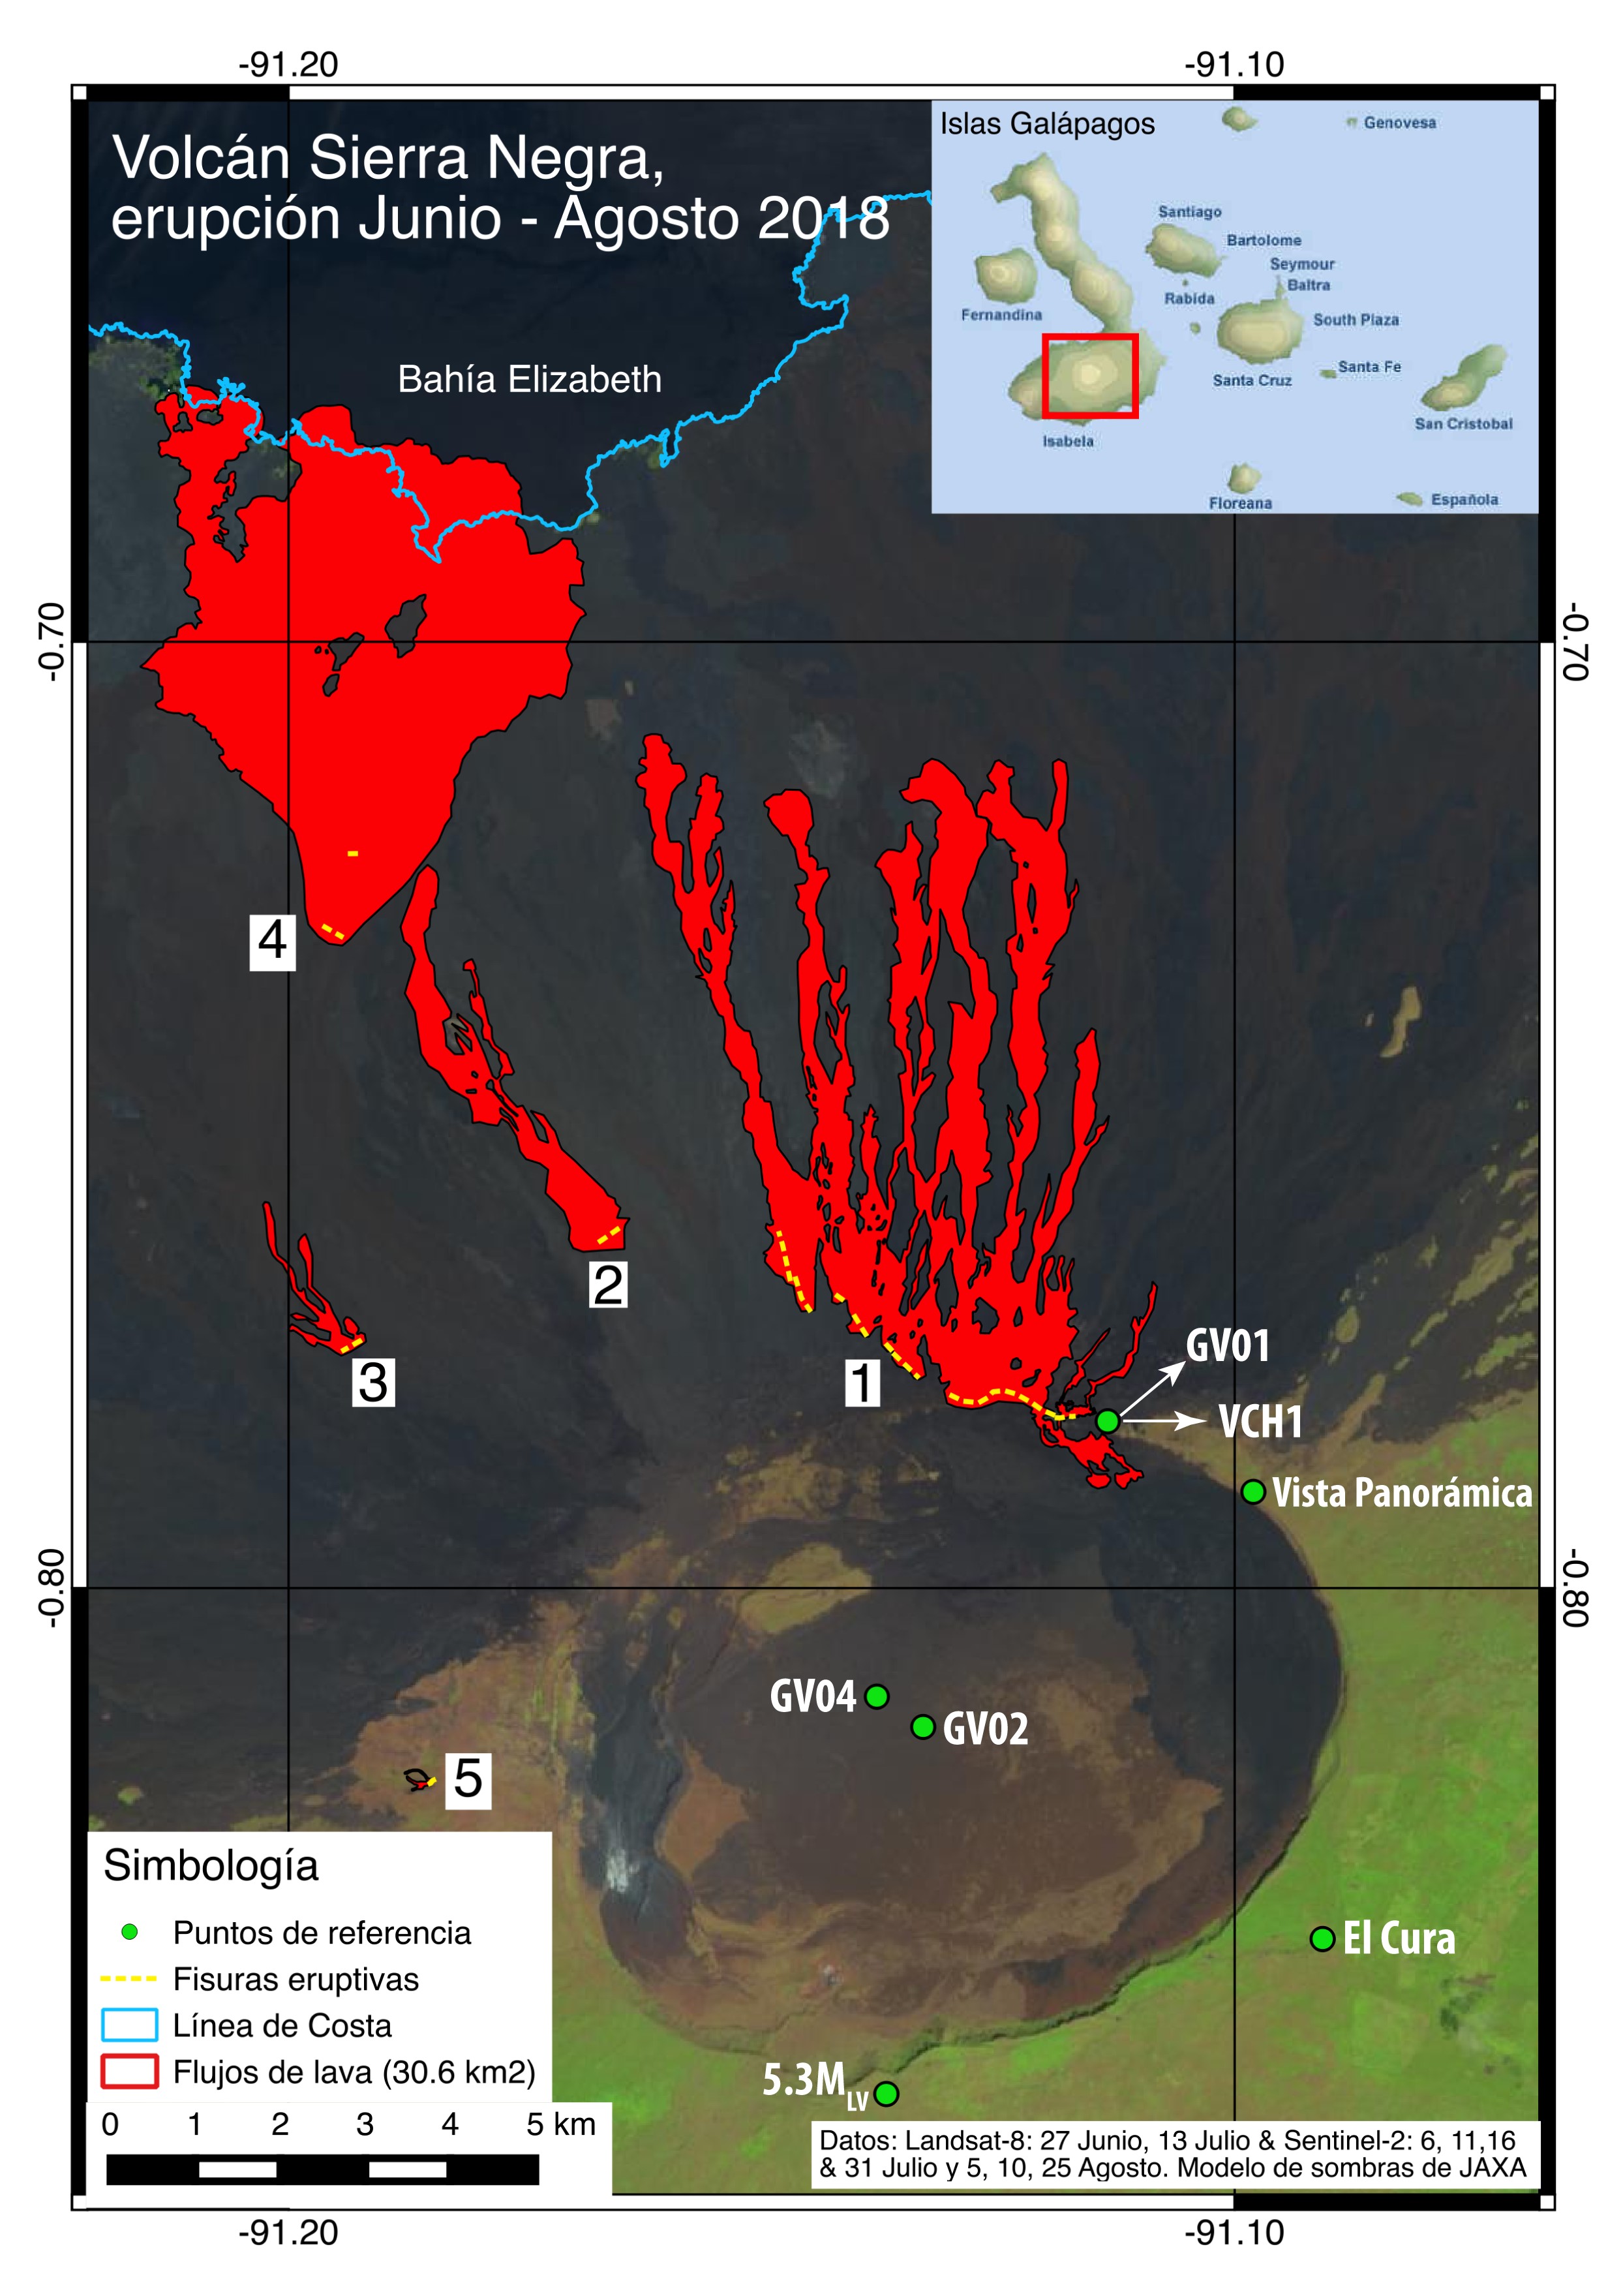
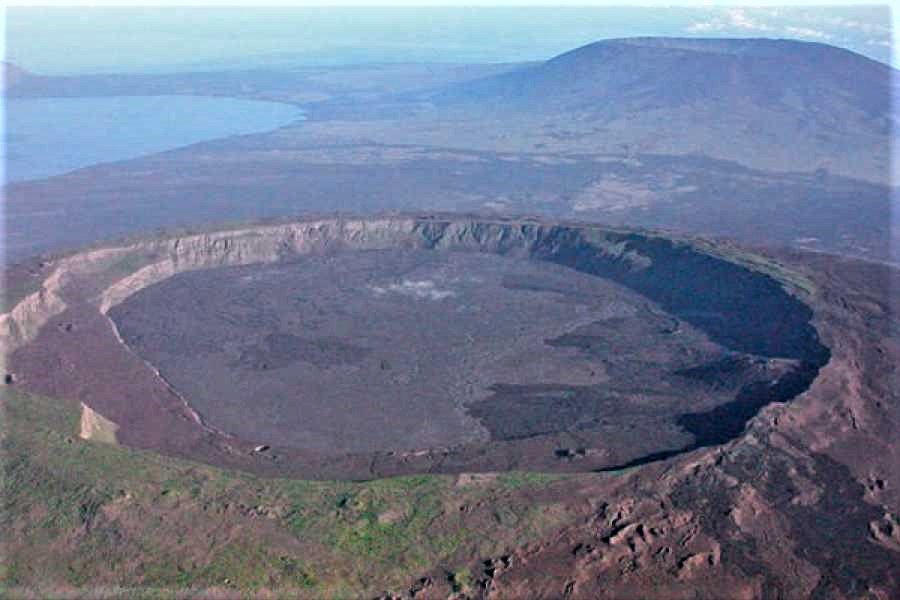
Figure 4. Map of the June-August 2018 eruption of the Sierra Negra volcano (Galapagos). The green dots represent the main reference areas, including cGPS and seismic stations, the epicenter of the 5.3 MLV pre-eruption earthquake (see Special Report No. 6), El Cura (National Park Control Station) Galapagos) and horse mooring (panoramic view), these are typical sites visited by tourists.
Interpretation
Due to the continuous decrease in seismic energy levels, reaching even earlier values at the beginning of the eruptive period from June to August 2018 on the Sierra Negra volcano (see Figure 1 and 2a), the decrease in the number of alerts and of thermal levels as well as the degassing of SO2, the IGEPN signals the possible completion of the eruptive process or the entry into a period of calm, after 58 days of eruption.
Source : IGEPN ( https://www.igepn.edu.ec/servicios/noticias/1626-informe-especial-volcan-sierra-negra-n-18-2018 )
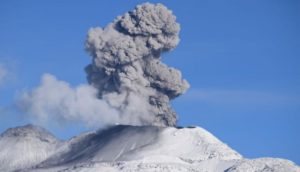
Indonesia , Dukono :
VOLCANO OBSERVATORY NOTICE FOR AVIATION – VONA.
Issued: September 01 , 2018.
Volcano: Dukono (268010)
Current Aviation Colour Code: ORANGE
Previous Aviation Colour Code: orange
Source: Dukono Volcano Observatory
Notice Number: 2018DUK167
Volcano Location: N 01 deg 41 min 35 sec E 127 deg 53 min 38 sec
Area: North Maluku, Indonesia
Summit Elevation: 3933 FT (1229 M)
Volcanic Activity Summary:
Eruption with volcanic ash cloud at 09h05 UTC (18h05 local).
Volcanic Cloud Height:
Best estimate of ash-cloud top is around 5533 FT (1729 M) above sea level, may be higher than what can be observed clearly. Source of height data: ground observer.
Other Volcanic Cloud Information:
Ash cloud moving to northeast – north.
Remarks:
Eruption and ash emission is continuing.
Source : Magma Indonesia
Photo : Photovolcanica.
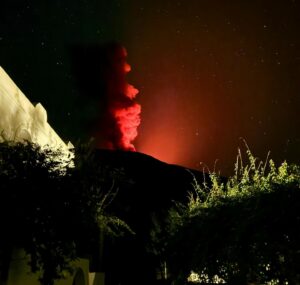
Costa Rica , Turrialba / Poas / Rincon de la Vieja :
Daily report on the state of volcanoes. Date: 2018-09-01, Updated at: 11:09:00.
Turrialba Volcano:
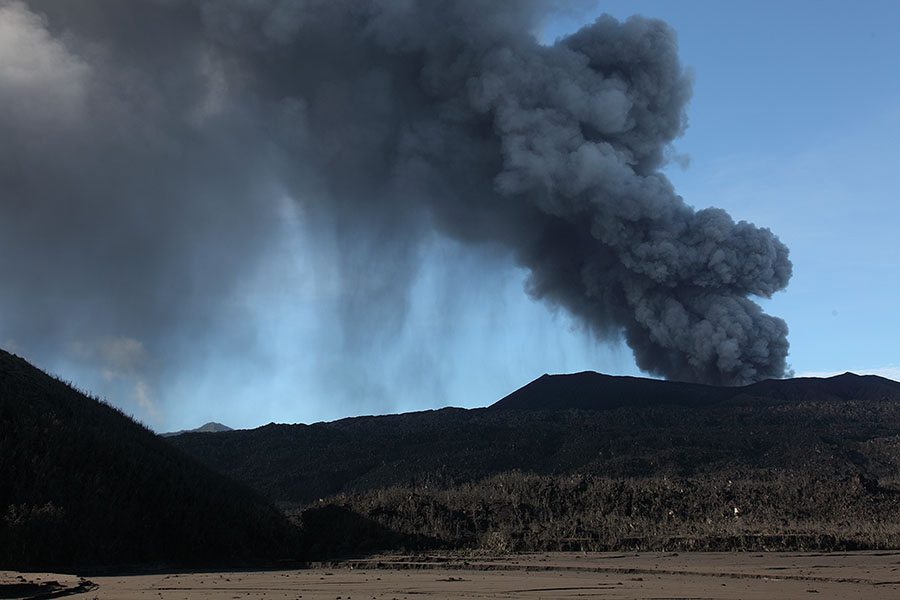
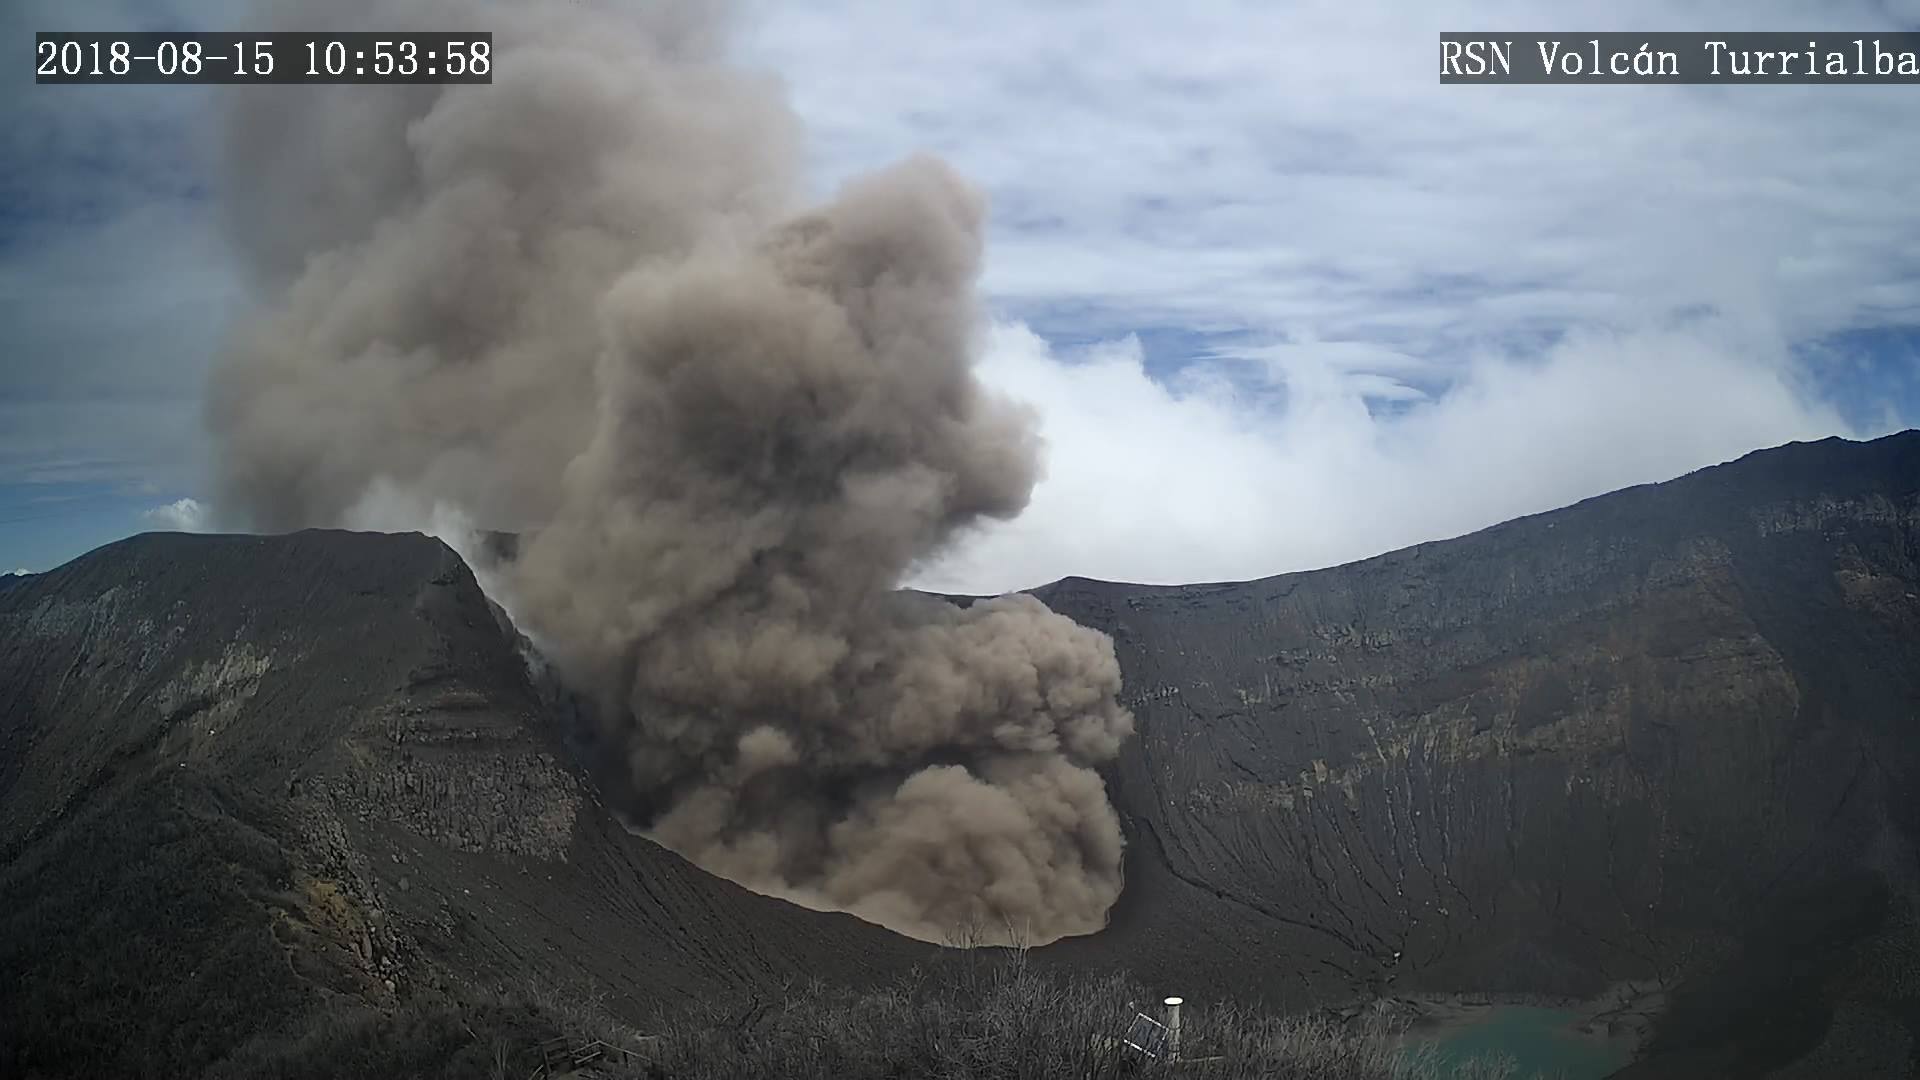
Since 31 August 2018 there has been a continuous eruption on the Turrialba volcano, with a column rising 200 meters above the crater or 3540 m.s.n.m. (meters above sea level) (11611.2 feet).
The seismic activity is lower than yesterday.
At the time of this report, the winds are blowing towards the Southwest.
The Turrialba volcano has passive and intermittent ash emissions that last several hours. Seismicity continues with tremors of low amplitude and LP volcanic earthquakes. The ashes were scattered west / southwest.
Poas Volcano:
No eruptions are reported.
The seismic activity is lower than yesterday.
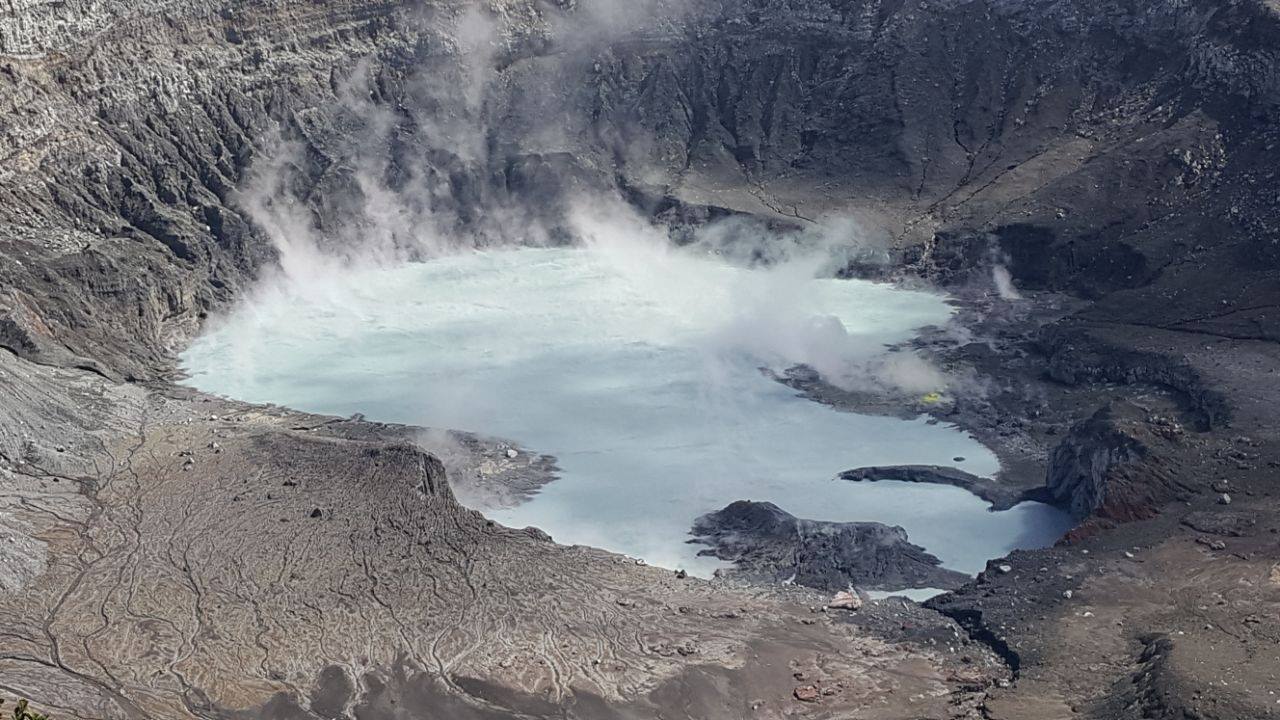
At the time of this report, the winds are blowing towards the Southwest.
The Poás volcano presents a slight degassing. The bottom tremor continues, but only now it is intermittent. Similarly, low amplitude LP type earthquakes are maintained.
Rincón de la Vieja Volcano
Since August 31, 2018, there has been a continuous eruption on the Rincon de la Vieja volcano, with a column rising to a height of 0 meters above the crater or 1916 m.s.n.m. (meters above sea level) (6284.48 ft).
The seismic activity is greater compared to the day yesterday.
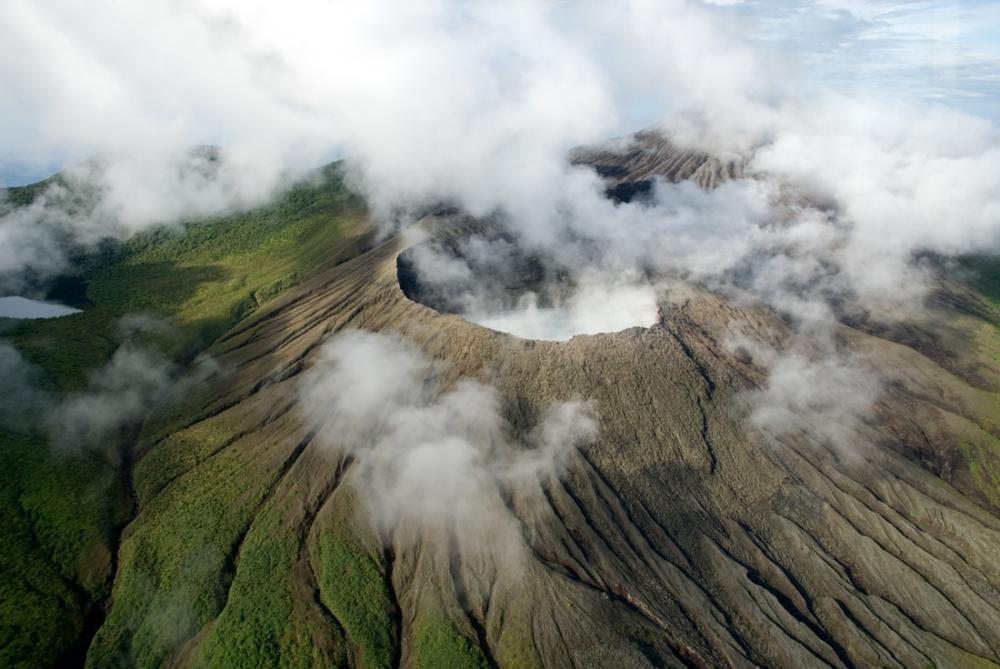
At the time of this report, the winds are blowing towards the Southwest.
Yesterday at 13:05 in the afternoon, an eruption was reported on the Rincon de la Vieja volcano, the height reached by the column due to cloud cover is not known. It shows an increase in the duration and amplitude of volcanic tremor as well as an increase in the quantity and amplitude of LP-type earthquakes.
Source : OVSICORI-UNA
Photos : RSN