September 3 , 2025.
Hawaii , Kilauea :
HVO/USGS Volcanic Activity Notice
Current Volcano Alert Level: WATCH
Current Aviation Color Code: ORANGE
Issued: Tuesday, September 2, 2025, 7:11 AM HST
Source: Hawaiian Volcano Observatory
Notice Number: 2025/H379
Location: N 19 deg 25 min W 155 deg 17 min
Elevation: 4091 ft (1247 m)
Area: Hawaii
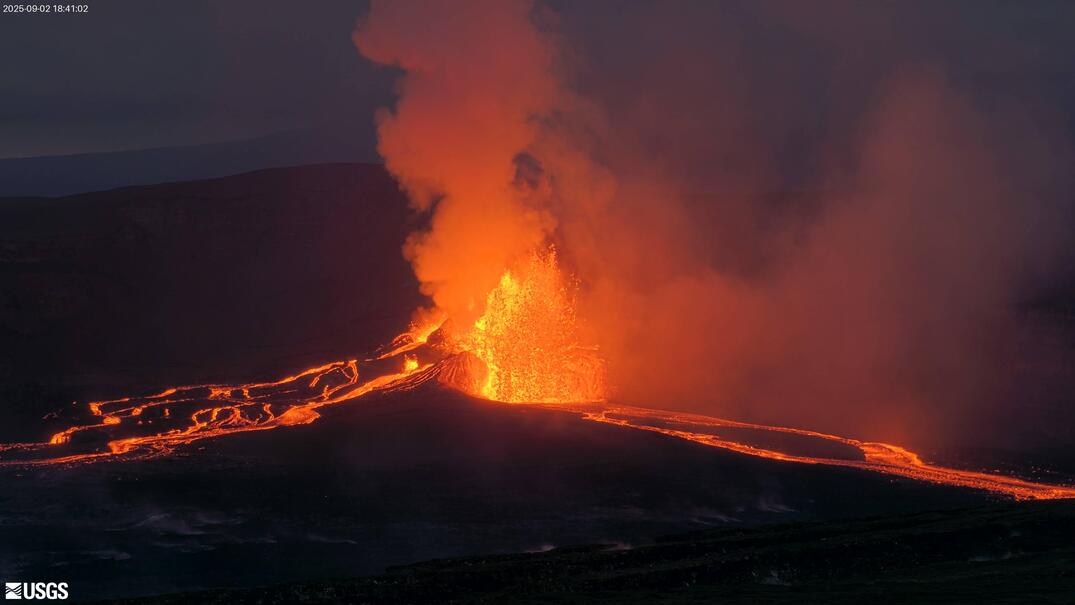
Activity Summary:
Episode 32 of the ongoing Halemaʻumaʻu eruption is underway. Vigorous north vent lava fountains started around 6:35 a.m. HST this morning and grew to exceed 330 feet (100 meters) in height, inclined to the northeast and feeding lava flows on the western half of the crater floor. Lava fountaining continues at this time and is likely to continue until the late afternoon or evening today. All lava activity is confined to within Halemaʻumaʻu crater, though tephra and Pele’s hair may be deposited to the southwest based on prevailing wind conditions.
Summit Observations:
Around 8:30 p.m. HST on September 1, gas pistoning cycles started filling the Halemaʻumaʻu north vent with lava. The first overflow from the north vent occurred at 12:43 a.m. HST this morning. Two hours later, closely spaced cyclic overflows began and continued until overflows became continuous at 5:31 a.m. HST, being fed by low dome fountain at the vent. The dome fountains escalated in vigor until 6:35 a.m. HST, when tremor and deflation increased significantly marking the onset of lava fountaining episode 32.
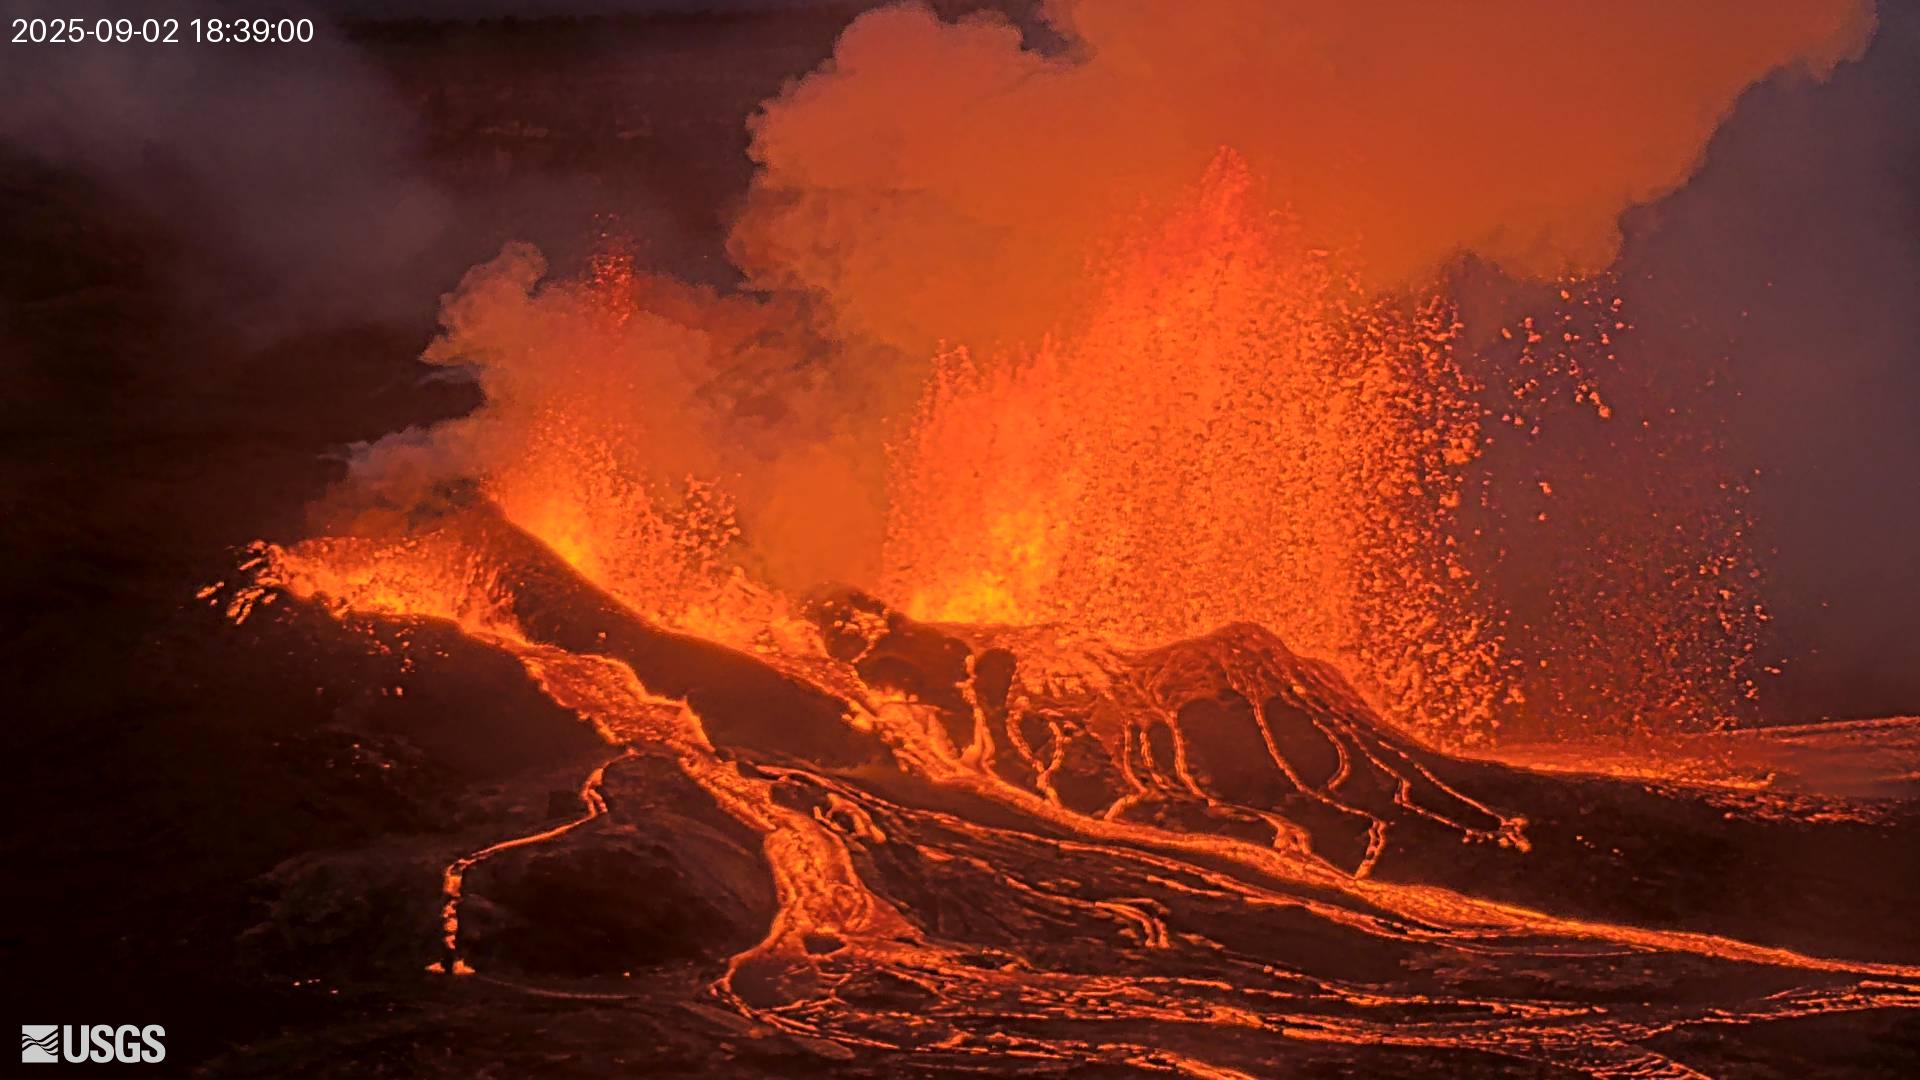
Afterwards, lava fountains grew to exceed 330 feet (100 meters) in height, inclined at an angle of 45 degrees to the northeast. Around 8:20 a.m. HST, the fountain turned slightly counterclockwise to the north-northeast, and it presently remains pointed this direction. So far, lava flows from the north vent have covered an estimated 40% of the Halemaʻumaʻu crater floor, entirely on its western side.
By the time vigorous lava fountaining started, the Uēkahuna tiltmeter (UWD) had recorded approximately 19.3 microradians of inflationary tilt since the end of episode 31, during which the instrument recorded about 22 microradians of deflationary tilt. As episode 32 lava fountains strengthened, UWD recorded the onset of rapid summit deflation; as of 9:30 a.m. HST, the instrument has recorded nearly 9 microradians of deflationary tilt.
Since the time vigorous lava fountaining started, seismic data streams around Kīlauea summit have been dominated by eruptive tremor. Sulfur dioxide (SO2) emission rates during lava fountaining episodes are typically around 50,000 tonnes/day.
Source et photos : HVO
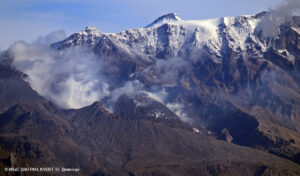
Italy / Sicily , Etna :
WEEKLY BULLETIN, August 25-31, 2025 (publication date: September 2, 2025)
ACTIVITY SUMMARY
Monitoring data highlight the following:
1) VOLCANOLOGICAL OBSERVATIONS: Effusive activity originating from a vent located at an altitude of 2,980 m, a vent located at an altitude of 3,100 m at the base of the saddle between the Bocca Nuova crater and the Southeast crater, and a vent located at an altitude of 3,200 m on the southern flank of the Southeast crater. Strombolian activity at the Southeast crater with sporadic and moderate ash emissions. Degassing of varying intensity at the Bocca Nuova, Voragine, and Northeast crater craters. 2) SEISMOLOGY: Absence of seismic activity due to fracturing. Average amplitude of volcanic tremors with high values on the first 6 days of the week; clear decrease, with medium to low values, on August 31.
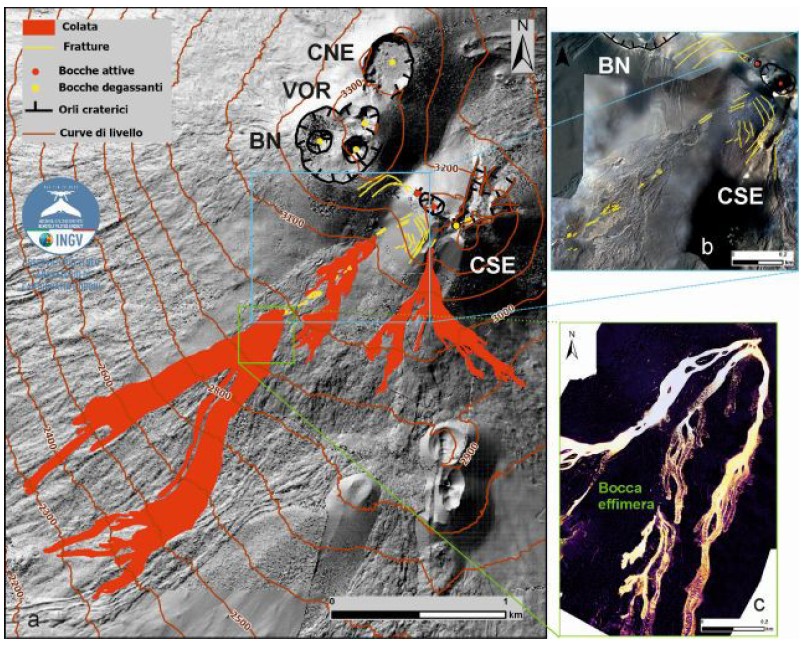
Map of lava flows emitted since August 14 (in red) superimposed on the shaded relief of the summit area of Mount Etna, obtained by processing drone images acquired between June and August 2025. Geoid contour lines are plotted every 100 meters. CSE = Southeast Crater, CNE = Northeast Crater, VOR = Voragine, BN = Bocca Nuova. b) Orthomosaic of the fracture-affected area (yellow lines). c) Thermal orthomosaic of the lava flow emitted from an altitude of 3,200 m.
3) INFRASOUND: Discontinuous, sometimes high, infrasound activity.
4) GROUND DEFORMATION: The GNSS (HF) ground deformation monitoring network did not measure any significant changes. The ECP inclinometer station and the DRUV dilatometer recorded variations consistent with ongoing eruptive activity.
5) GEOCHEMISTRY: SO2 fluxes at medium to high values, tending toward a medium level.
CO2 fluxes from the ground (Etnagas Network): The flux shows an increase, stabilizing at low values.
CO2 dissolved in groundwater (EtnaAcque Network): No update.
Helium isotope ratio at peripheral sites: No update.
6) SATELLITE OBSERVATIONS: Thermal activity observed by satellite in the summit area was generally high to very high, consistent with ongoing effusive activity. 7) OTHER OBSERVATIONS: Analysis of the flood risk associated with lava flows suggests that this type of effusive activity tends to remain confined to altitudes above 1,800 m above sea level.
VOLCANOLOGICAL OBSERVATIONS
During the week, Mount Etna’s volcanic activity was monitored through the analysis of surveillance camera images and satellite images from the INGV – Osservatorio Etneo (INGV-OE), as well as several field inspections conducted by INGV-OE staff, including using drones. In general, the observation period was characterized by a slow decrease in explosive activity at the Southeast Crater (CSE) and in effusive activity fueled by the chimney opened on 14 August at 2,980 m altitude, as well as by the chimneys located at 3,100 m altitude, active at the base of the saddle between the Bocca Nuova Crater (BN) and the Southeast Crater (CSE), and at 3,200 m altitude on the southern flank of the Southeast Crater (CSE), both active since 20 August.
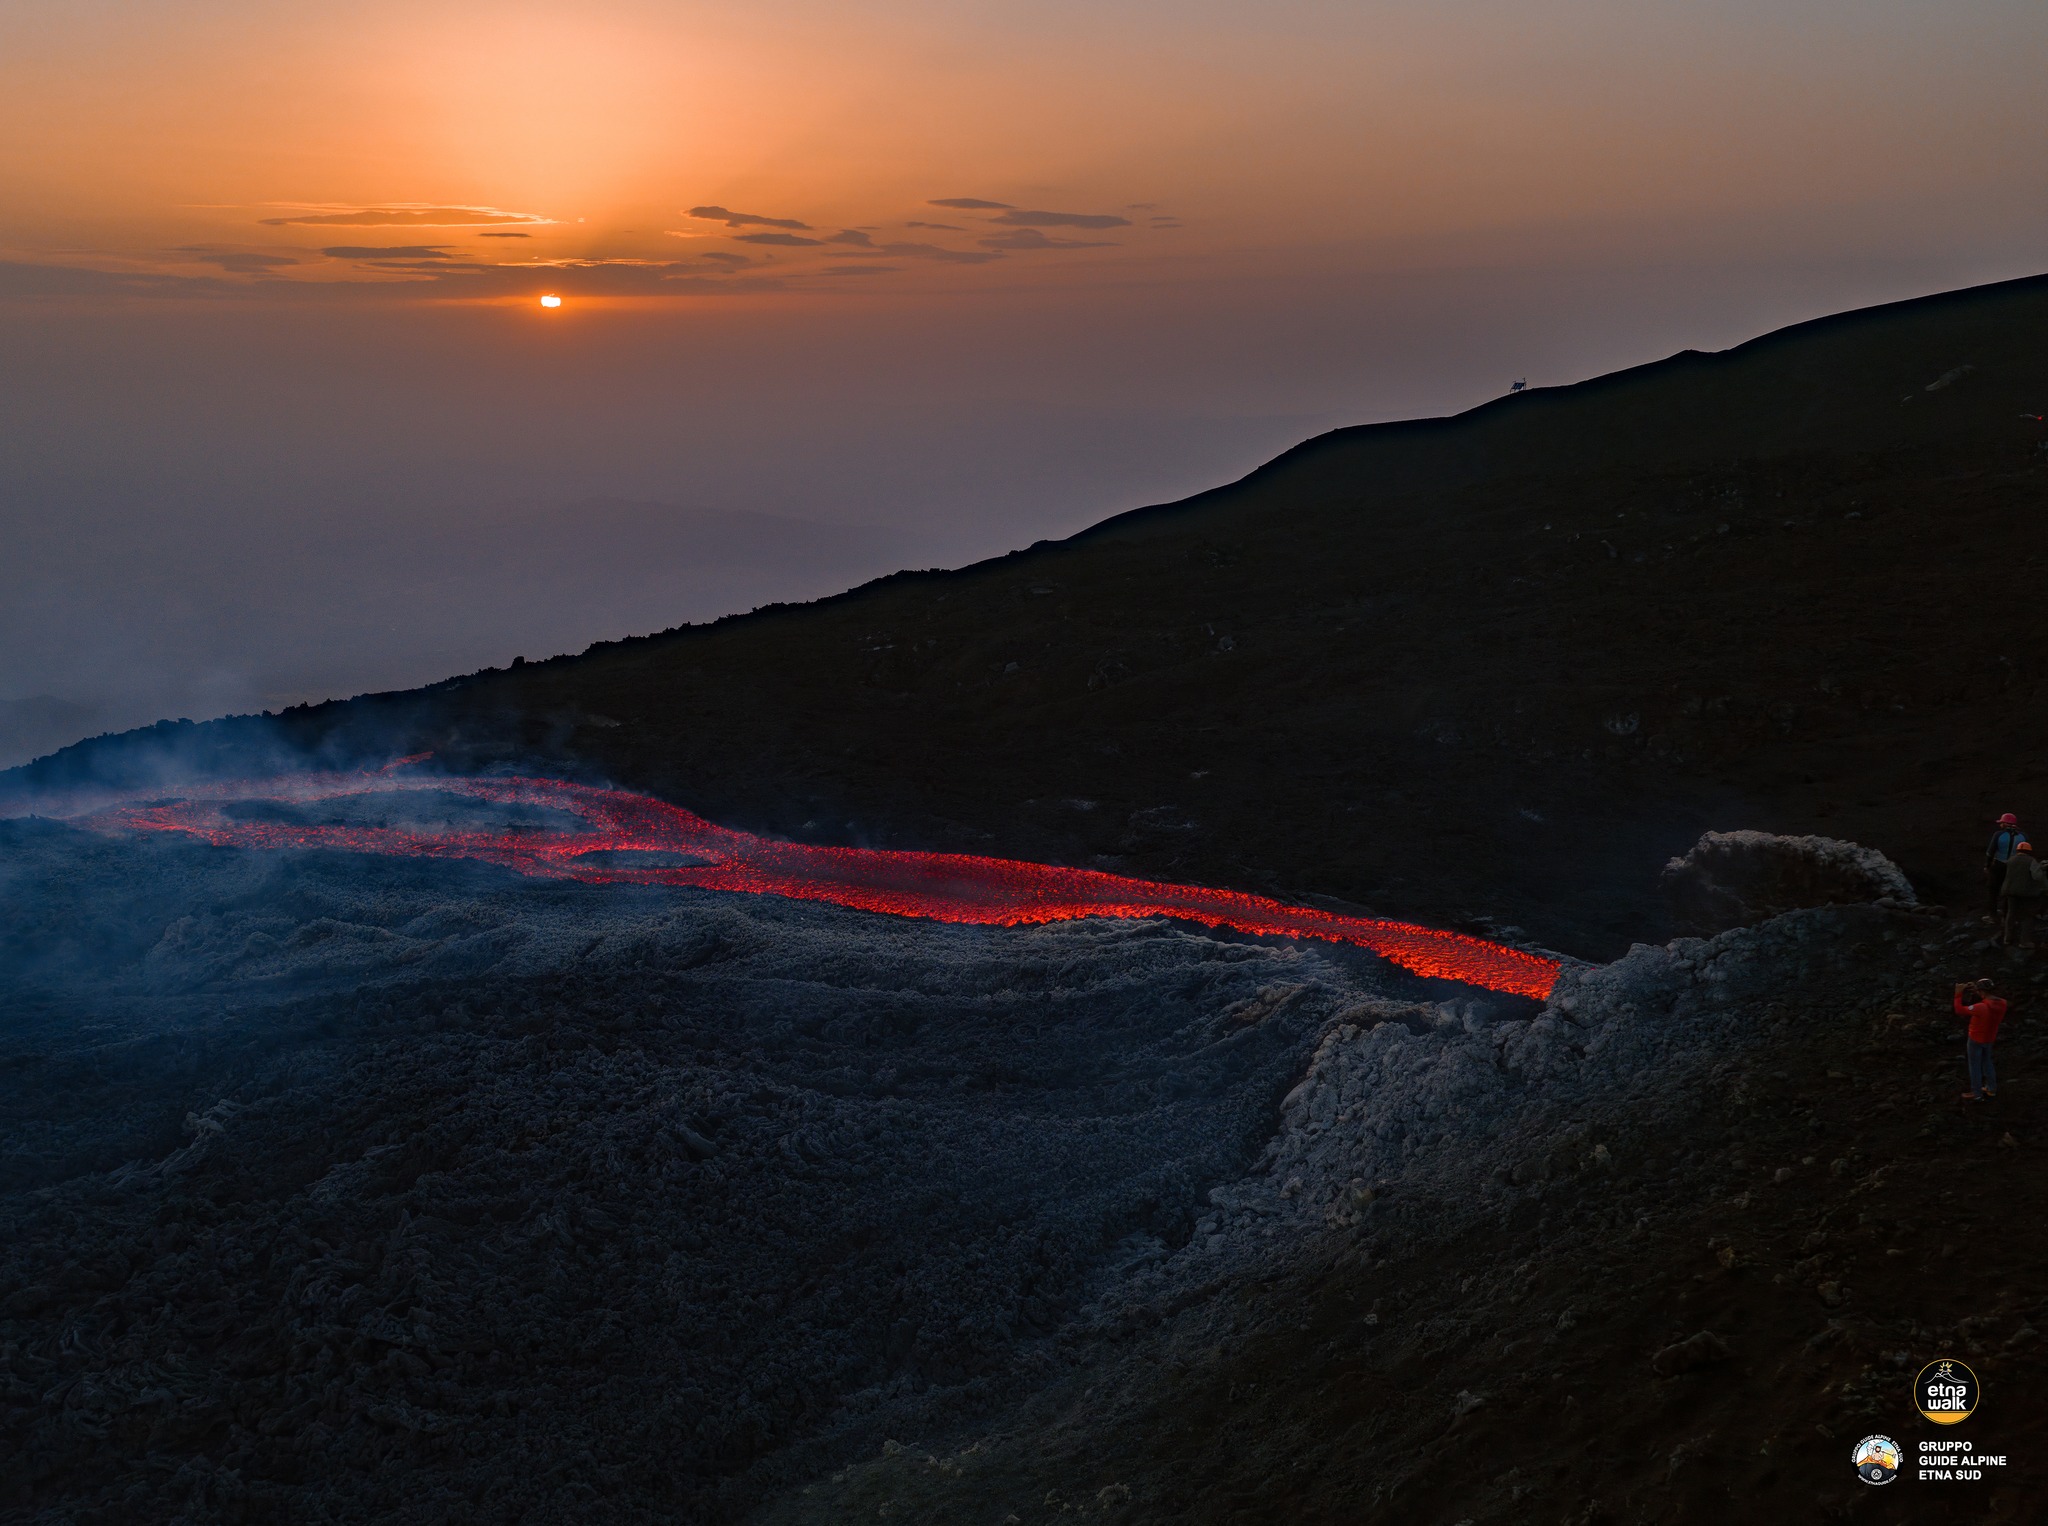
Specifically, regarding effusive activity, the active vent at 2,980 m (9,000 ft) continued to feed a complex lava field composed of several often overlapping flows, leading to the development of ephemeral tunnels and vents from which several secondary lava flows formed, thus promoting the extension of the most advanced fronts to a minimum altitude of 2,250 m (7,000 ft). Within a week, the lava field formed by this effusive vent reached a maximum extension of approximately 2 km (1.2 mi), a surface area of 5.6 × 10^5 m², and a volume of 1.7 × 10^6 m³ (9,000 ft).
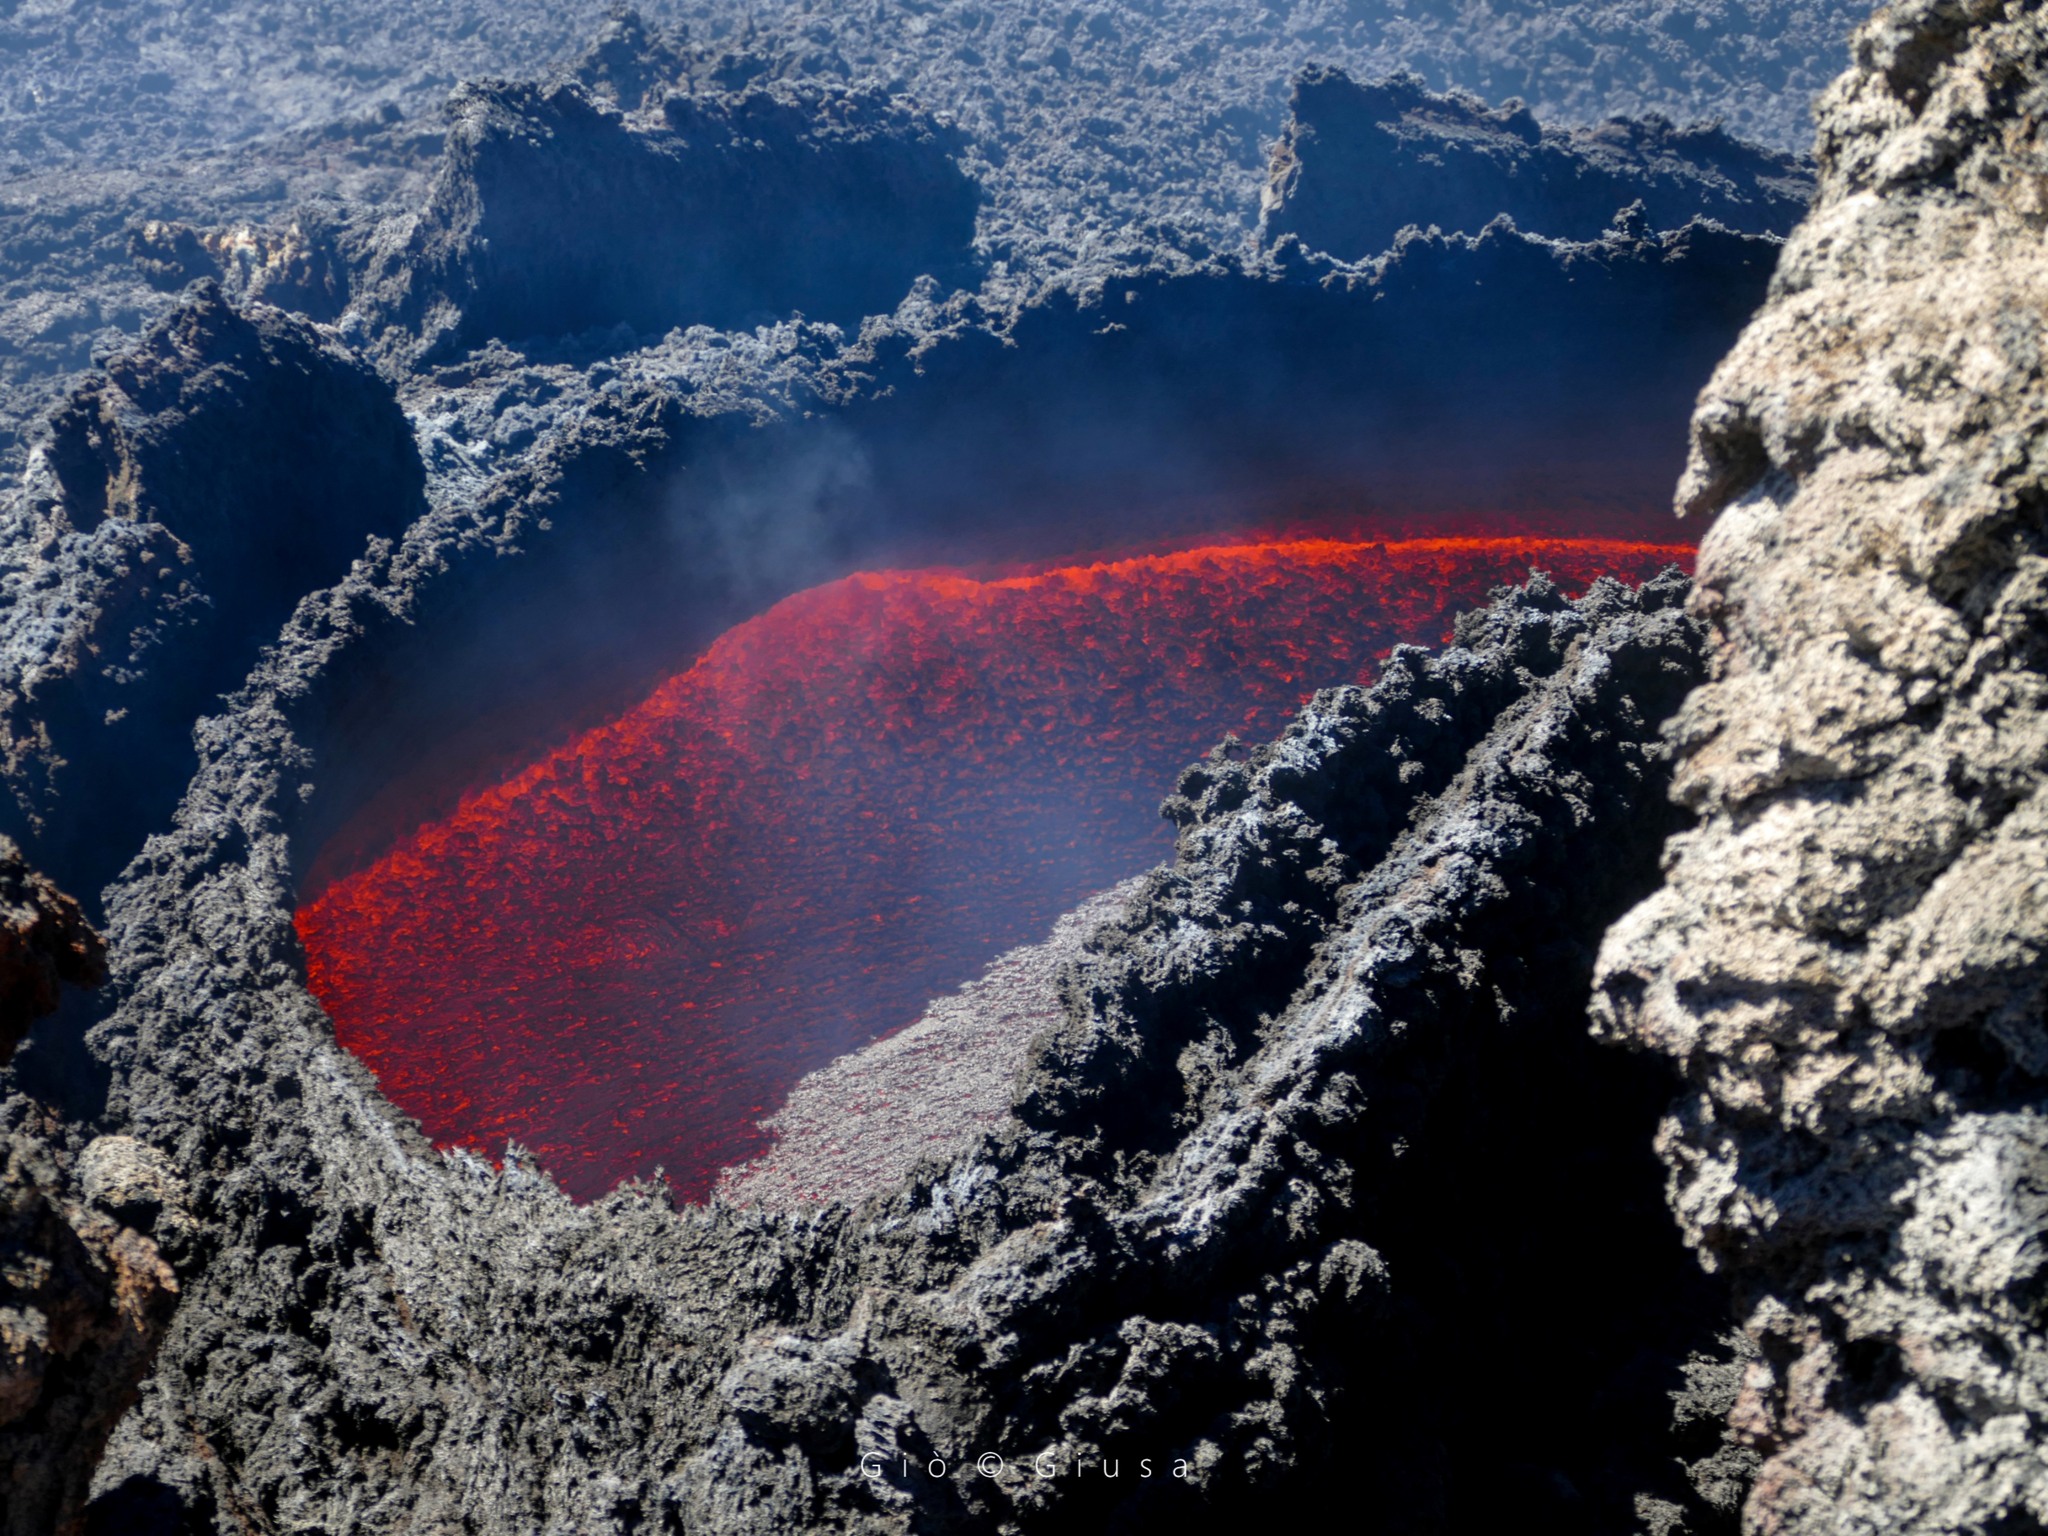
The effusive vent at 3,100 m (10,000 ft) continued to feed a lava field that developed primarily in a southwesterly direction, with the most advanced fronts reaching a minimum altitude of 2,950 m (9,000 ft). On 27 August, the lava field appeared less fed than in previous days and presented two active lava flows, which, in their distal area, appeared partially collapsed. Field surveys carried out by INGV-OE personnel and drones on the morning of 29 August observed that the effusive vent was inactive and that the lava field was cooling. The lava field formed by this vent reached an extension of 840 m, covering an area of 9.3 × 10^4 m^2, and producing a volume of 1.4 × 10^5 m^3. The vent, located at 3,200 m asl, continued to feed a lava field composed of multiple lava flows directed mainly towards the southwest and south. On 27 August, three aligned vents were active, feeding a lava flow that branched into several secondary flows in the distal area. On 29 August, the lava field continued to flow, and the most advanced front, developing toward the southeast, reached an altitude of approximately 2,870 m (9,100 ft) above sea level, the lowest level reached by lava flows fed by this effusive vent. On 31 August, the vent was inactive, and the lava field was stationary and cooling. The lava field extended over a length of 780 m, covered an area of 1.5 × 10^5 m², and reached a volume of 3.1 × 10^5 m³.
In total, on August 29, effusive activity fueled by the three vents produced a total estimated volume of approximately 2.2 × 10^6 m³. This figure is subject to a 40% uncertainty due to weather conditions that prevented optimal drone surveys. The lava fields were mapped using drone imagery analysis from August 29 and Sentinel 2 satellite imagery from August 29 and 31. In addition, processing of the images recorded during the August 29 drone survey revealed the presence of a vast, predominantly northeast-southwest-trending fracture field extending from the effusive vent at 2,980 m altitude to the Southeast Crater Rim (SCR).
Explosive activity at the Southeast Crater (SCC) was fueled by two eruptive vents and followed the same pattern as the previous week, with more energetic and less intense phases. During the more energetic phases, Strombolian activity was more vigorous, with an increase in the intensity and frequency of explosions and ballistic fallout outside the crater rim. Generally, throughout this period, Strombolian activity produced sporadic and weak ash emissions, rapidly dispersed by high-altitude winds. During the morning of August 31, Strombolian activity at the Southeast Crater (SCC) gradually decreased, although rare and weak emissions of very dilute ash were observed, rapidly dispersing into the atmosphere.
Degassing at the other summit craters was observed at varying rates and intensities.
Source : INGV
Photos : INGV , Gio Giusa , Etna Walk / Giuseppe Distefano / Marco Restivo .
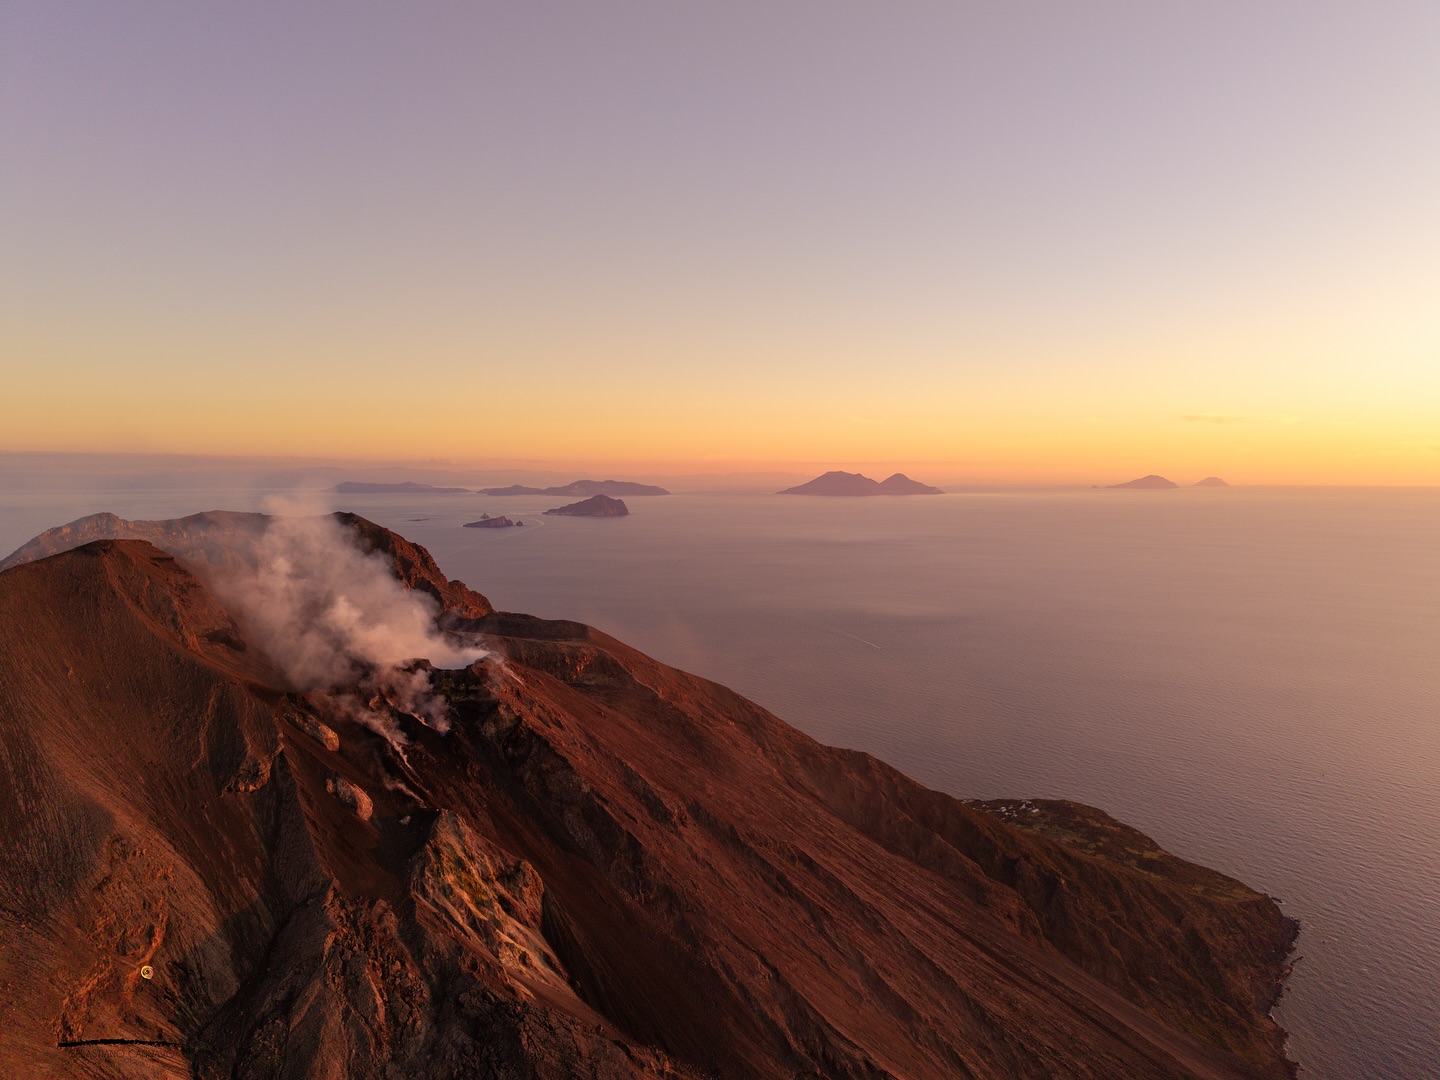
Italy , Stromboli :
WEEKLY BULLETIN, August 25-31, 2025 (Publication date: September 2, 2025)
ACTIVITY SUMMARY
Monitoring data highlights the following:
1) VOLCANOLOGICAL OBSERVATIONS: Normal Strombolian activity was observed during this period.
The total hourly frequency ranged from medium (11 events/h) to high (17 events/h).
The intensity of the explosions was low and medium in the North and South-Central crater areas.
2) SEISMOLOGY: The monitored seismic parameters show no significant variation.
3) GROUND DEFORMATION: No changes to report.
4) GEOCHEMISTRY: SO2 fluxes at an average level. Soil CO2 flux in the Pizzo area (STR02): Due to technical data transmission issues, no updates are available. The latest recorded values (August 3) are moderate to high.
The C/S ratio in the plume remains at moderate values.
Dissolved helium isotope ratio (R/Ra) in the thermal aquifer: No updates are available. The latest values (July 9) remain high.
Soil CO2 flux in the Scari area is high.
5) SATELLITE OBSERVATIONS: Thermal activity observed by satellite in the summit area was generally low, with some isolated moderate thermal anomalies.
VOLCANOLOGICAL OBSERVATIONS
During the observation period, Stromboli’s eruptive activity was characterized by analyzing images recorded by the INGV-OE surveillance cameras located at 190 m (SCT-SCV) and at Punta dei Corvi (SPCT). Explosive activity was mainly produced by four eruptive vents located in the North (N) crater area and by at least two vents located in the Central-South area.
Observations of explosive activity captured by surveillance cameras
Four active vents were observed in the North crater area, producing low-intensity explosive activity (less than 80 m in height) and occasionally medium-intensity explosive activity (less than 150 m in height). The eruptive products were mainly coarse materials (bombs and lapilli). The average explosion frequency ranged from 9 to 17 events/h. The South-Central Crater area was affected by medium to low intensity fine material explosions. The average explosion frequency ranged from 0 to 5 events/h.
Source : INGV
Photo : Stromboli stati d’animo / Sebastiano Cannavo
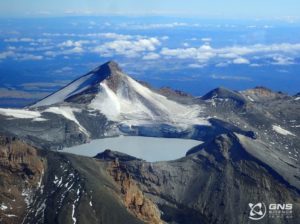
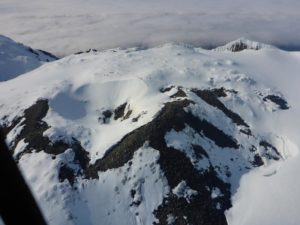
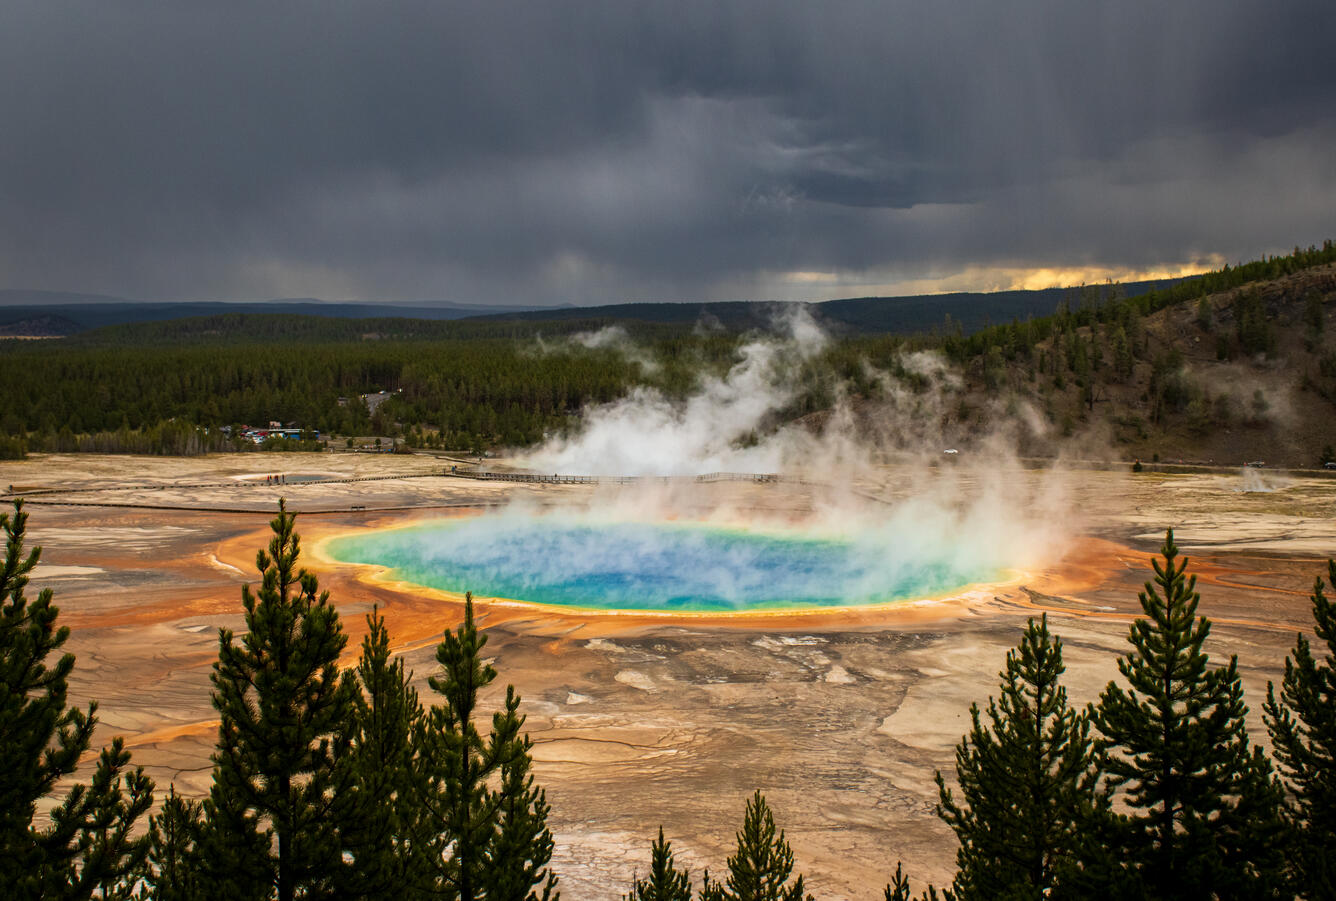
United – States , Yellowstone :
YELLOWSTONE VOLCANO OBSERVATORY MONTHLY UPDATE , U.S. Geological Survey
Tuesday, September 2, 2025, 2:08 PM MDT (Tuesday, September 2, 2025, 20:08 UTC)
44°25’48 » N 110°40’12 » W,
Summit Elevation 9203 ft (2805 m)
Current Volcano Alert Level: NORMAL
Current Aviation Color Code: GREEN
Summary
Yellowstone Caldera activity remains at background levels, with 94 located earthquakes in August (largest = M3.7). Deformation measurements indicate that the annual summertime pause in long-term caldera subsidence started in late May. A small eruption of Black Diamond Pool in Biscuit Basin was recorded by a webcam and other monitoring equipment on August 12.
Recent Work and News
Minor eruptions of Steamboat Geyser in Norris Geyser Basin remain muted, indicating that a major eruption is unlikely anytime soon. There have only been 2 major eruptions of the geyser so far during 2025, and the period of frequent activity that started in 2018 is probably ending.
The new webcam at Biscuit Basin, installed in mid-May 2025 to track activity at Black Diamond Pool (where a hydrothermal explosion occurred on July 23, 2024), continues to send static images . During August, the webcam captured a small eruption from the pool on August 12 at 8:27 p.m. MDT. The eruption only threw muddy water about 3 feet (1 meter) into the air, but it was well recorded by the new seismic and acoustic sensors that were established in the area in late July.
During the past month, field engineers from the University of Utah Seismograph Stations performed maintenance and upgrades on several seismic stations in the park. In September, additional work is planned to repair malfunctioning GPS sites, to recover temporary GPS deployments, to upgrade additional seismic stations, and to hopefully install a new webcam with a view of Yellowstone Lake.
Seismicity
During August 2025, the University of Utah Seismograph Stations, responsible for the operation and analysis of the Yellowstone Seismic Network, located 94 earthquakes in the Yellowstone National Park region. The largest event of the month was a minor earthquake of magnitude 3.7 located about 15 miles northeast of West Yellowstone, Montana, on August 19 at 11:14 a.m. MDT. This event was preceded by 4 foreshocks and followed by 31 aftershocks in August.
August seismicity in Yellowstone was marked by one swarm of 10 earthquakes that occurred August 30–31 approximately 9 miles north-northeast of Old Faithful in Yellowstone National Park. The largest earthquake in the sequence was a magnitude 2.0 on August 30 at 10:39 a.m. MDT.
Yellowstone earthquake activity remains at background levels.
Ground Deformation
Continuous GPS stations in Yellowstone Caldera continue to record the annual summertime pause in subsidence or transition to slight uplift, which is caused by seasonal changes related to snowmelt and groundwater conditions. Since late May, the caldera has risen by about 1 cm (less than half an inch), which is superimposed on the overall trend of subsidence that has been ongoing since 2015–2016. Deformation in the area of Norris Geyser Basin also recorded the seasonal uplift, but with no overall changes over the past several years.
Source et photo : YVO
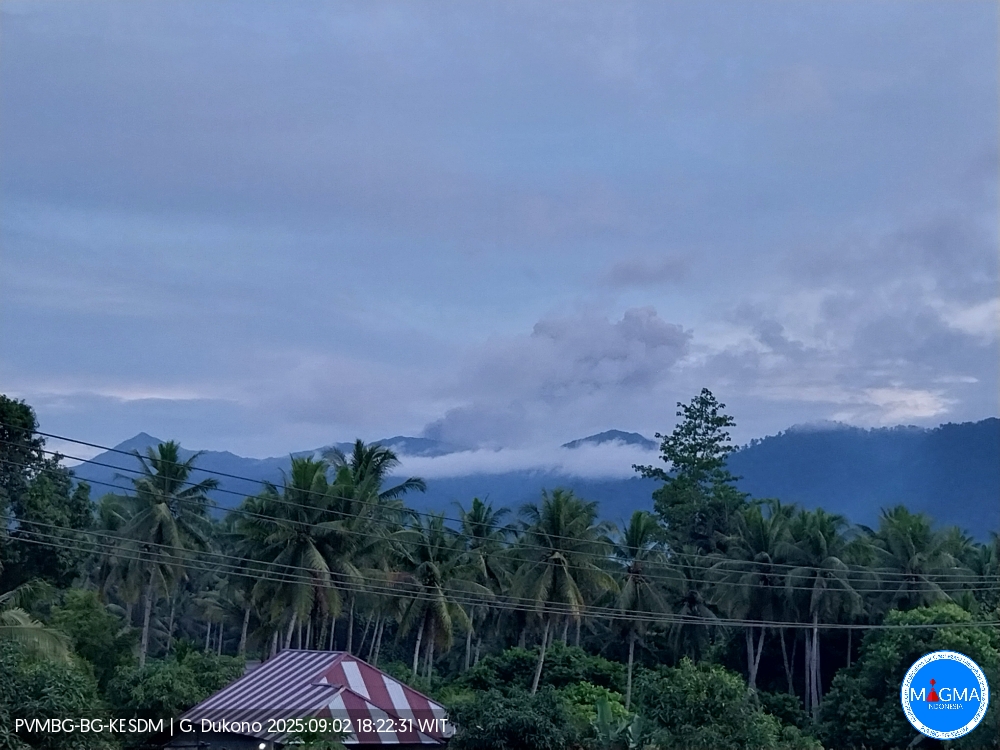
Indonesia , Dukono :
Mount Dukono erupted on Tuesday, September 2, 2025, at 6:19 PM (local time). An ash column was observed about 600 m above the summit (about 1,687 m above sea level). This thick, white to gray ash column extended northwest. At the time of writing, the eruption was still ongoing.
Seismic Observations
44 eruption earthquakes with amplitudes ranging from 6 to 14 mm and durations ranging from 32.33 to 73.14 seconds.
A distant tectonic earthquake with an amplitude of 33 mm and a duration of 84.05 seconds.
A continuous tremor-type earthquake with amplitudes ranging from 2 to 6 mm, mainly 3 mm.
Recommendations
(1) Communities living around Mount Dukono and visitors/tourists are advised to refrain from all activities, climbing, and approaching the Malupang Warirang crater within a 4 km radius.
(2) Since volcanic ash eruptions occur periodically and their distribution depends on wind direction and speed, the area of ash coverage is therefore not constant. It is therefore recommended that communities living around Mount Dukono always have masks/nose and mouth coverings available when needed to avoid the risk of volcanic ash projections on the respiratory system.
Source et photo : Magma Indonésie .