February 22 , 2025.
Hawaii , Kilauea :
Friday, February 21, 2025, 9:46 AM HST (Friday, February 21, 2025, 19:46 UTC)
19°25’16 » N 155°17’13 » W,
Summit Elevation 4091 ft (1247 m)
Current Volcano Alert Level: WATCH
Current Aviation Color Code: ORANGE
Activity Summary:
Kīlauea summit eruption paused as of 9:18 a.m HST on February 20. Preliminary estimates suggest a new eruptive episode may begin as early as Sunday, February 23 in Hawai’i Volcanoes National Park.
Episode 10 of the ongoing Halemaʻumaʻu eruption ended abruptly at 9:18 a.m. HST on February 20 after about 13 hours of eruptive activity. Kīlauea’s current eruption in Halemaʻumaʻu crater within Kaluapele (the summit caldera) began on December 23, 2024. There have been 10 episodes of lava fountaining separated by pauses in activity. All eruptive activity remains within Hawai’i Volcanoes National Park. No significant activity has been noted along Kīlauea’s East Rift Zone or Southwest Rift Zone.
Current hazards include volcanic gas emissions and windblown volcanic glass (Pele’s Hair) that may impact Hawai’i Volcanoes National Park and nearby communities.
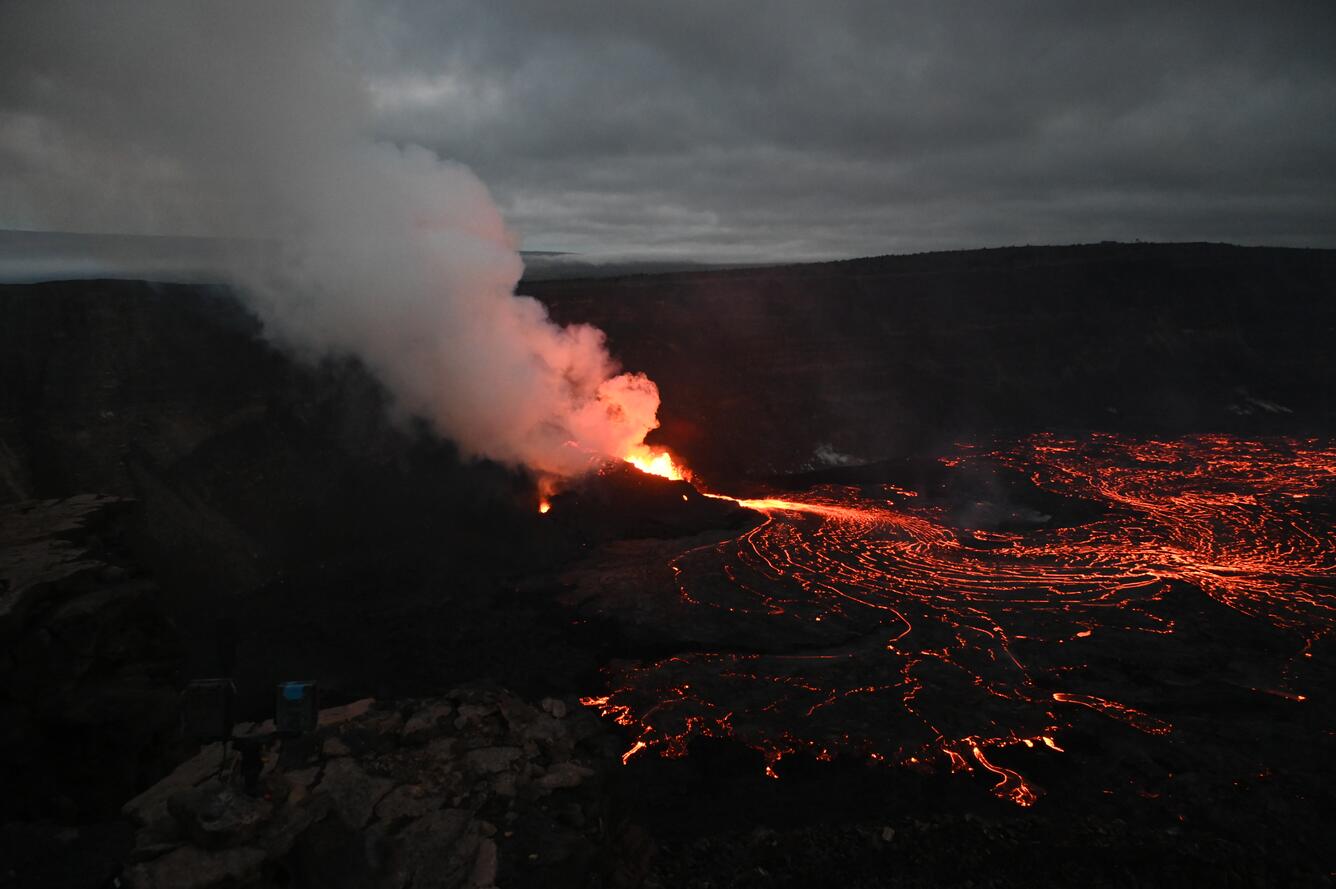
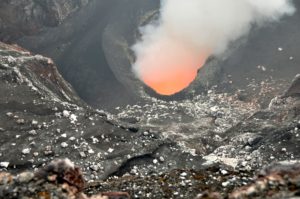
An overview of episode 10 of the ongoing Halemaʻumaʻu eruption the morning of February 20, 2025. Episode 10 ended later that morning at 9:18 a.m HST, after just under 13 hours of fountaining. This photo shows lava fountains within the north vent feeding lava flows which covered an estimated 75% of the floor of Halemaʻumaʻu within the southern part of Kaluapele (Kīlauea caldera).
Summit Observations:
Lava flows and fountains stopped erupting from the vents within Halemaʻumaʻu crater at about 9:18 a.m. HST on February 20. Lava flows from episode 10 covered approximately 75% of the Halemaʻumaʻu crater floor. Spots of orange glow can still be seen on the crater floor at night as the erupted lava continues to cool. The vents continue to degas and glow at night, indicating magma remains at shallow levels in the vent.
Summit tilt changed rapidly from deflation to inflation, and seismic tremor decreased, at about the same time that the lava fountains stopped erupting on February 20. The Uēkahuna (UWD) tiltmeter has recorded approximately 2 microradians of inflationary tilt since the end of episode 10. Seismic tremor decreased significantly at the end of episode 10 but remains above background. One small earthquake was recorded in the summit region over the past 24 hours.
Volcanic gas emissions remain elevated. Based on measurements made during earlier episodes and pauses, sulfur dioxide (SO2) emission rates are likely to be approximately 1,000 t/d during the current pause. An SO2 emission rate of 1,200 t/d was measured approximately six hours before the start of episode 10 on February 19.
Rift Zone Observations:
Rates of seismicity and ground deformation remain very low in the East Rift Zone and Southwest Rift Zone with no significant earthquake activity in the past 24 hours. Sulfur dioxide (SO2) emissions from the East Rift Zone remain below detection limit.
Source : HVO
Photo : USGS / L. Gallant.
Alaska / Aleutian Islands , Atka :
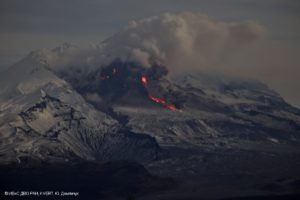
A small and brief explosion occurred at the Atka volcanic complex at 7:26 pm AKST on February 20 (4:26 UTC on February 21) and in response the Aviation Color Code and Volcano Alert Level were increased to ORANGE/WATCH yesterday evening. Seismicity remained very low after this event and no further explosions were detected. As a result, the Aviation Color Code and Volcano Alert Level was decreased to YELLOW/ADVISORY this morning.
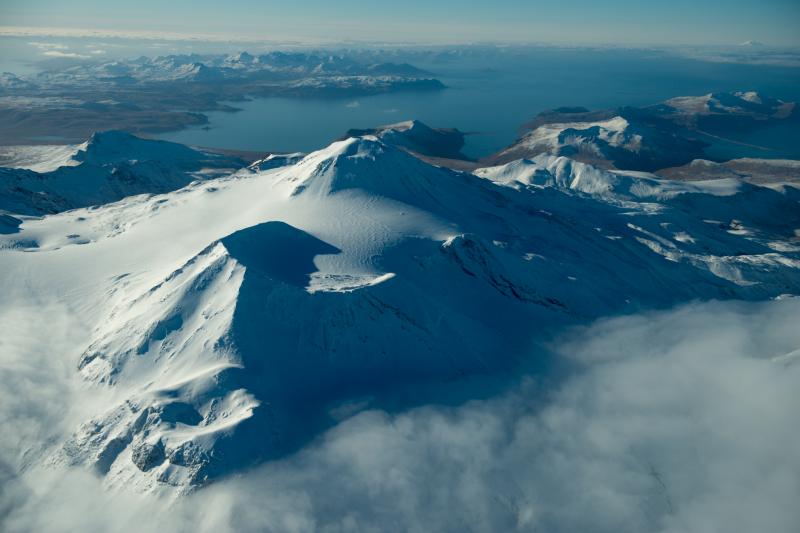
Further analysis of geophysical data confirms the source of the explosion as the summit lake region of Korovin Volcano, one of the volcanoes in the Atka volcanic complex, and satellite data from last evening show no evidence of hot material at the surface. Our interpretation is that this was a steam-driven explosion, caused by overpressure of the subsurface cap beneath the lake. This type of singular explosion is common at Korovin Volcano. Minor amounts of ash were likely erupted in the immediate vicinity of the vent but have not been confirmed. Additional explosions are possible in the near future, but unlikely.
Local seismic and infrasound sensors, and web cameras are used to monitor the Atka volcanic complex. The local sensor network is supplemented with regional infrasound and lightning networks, and satellite data.
Source : AVO
Photo : Clifford, Roger
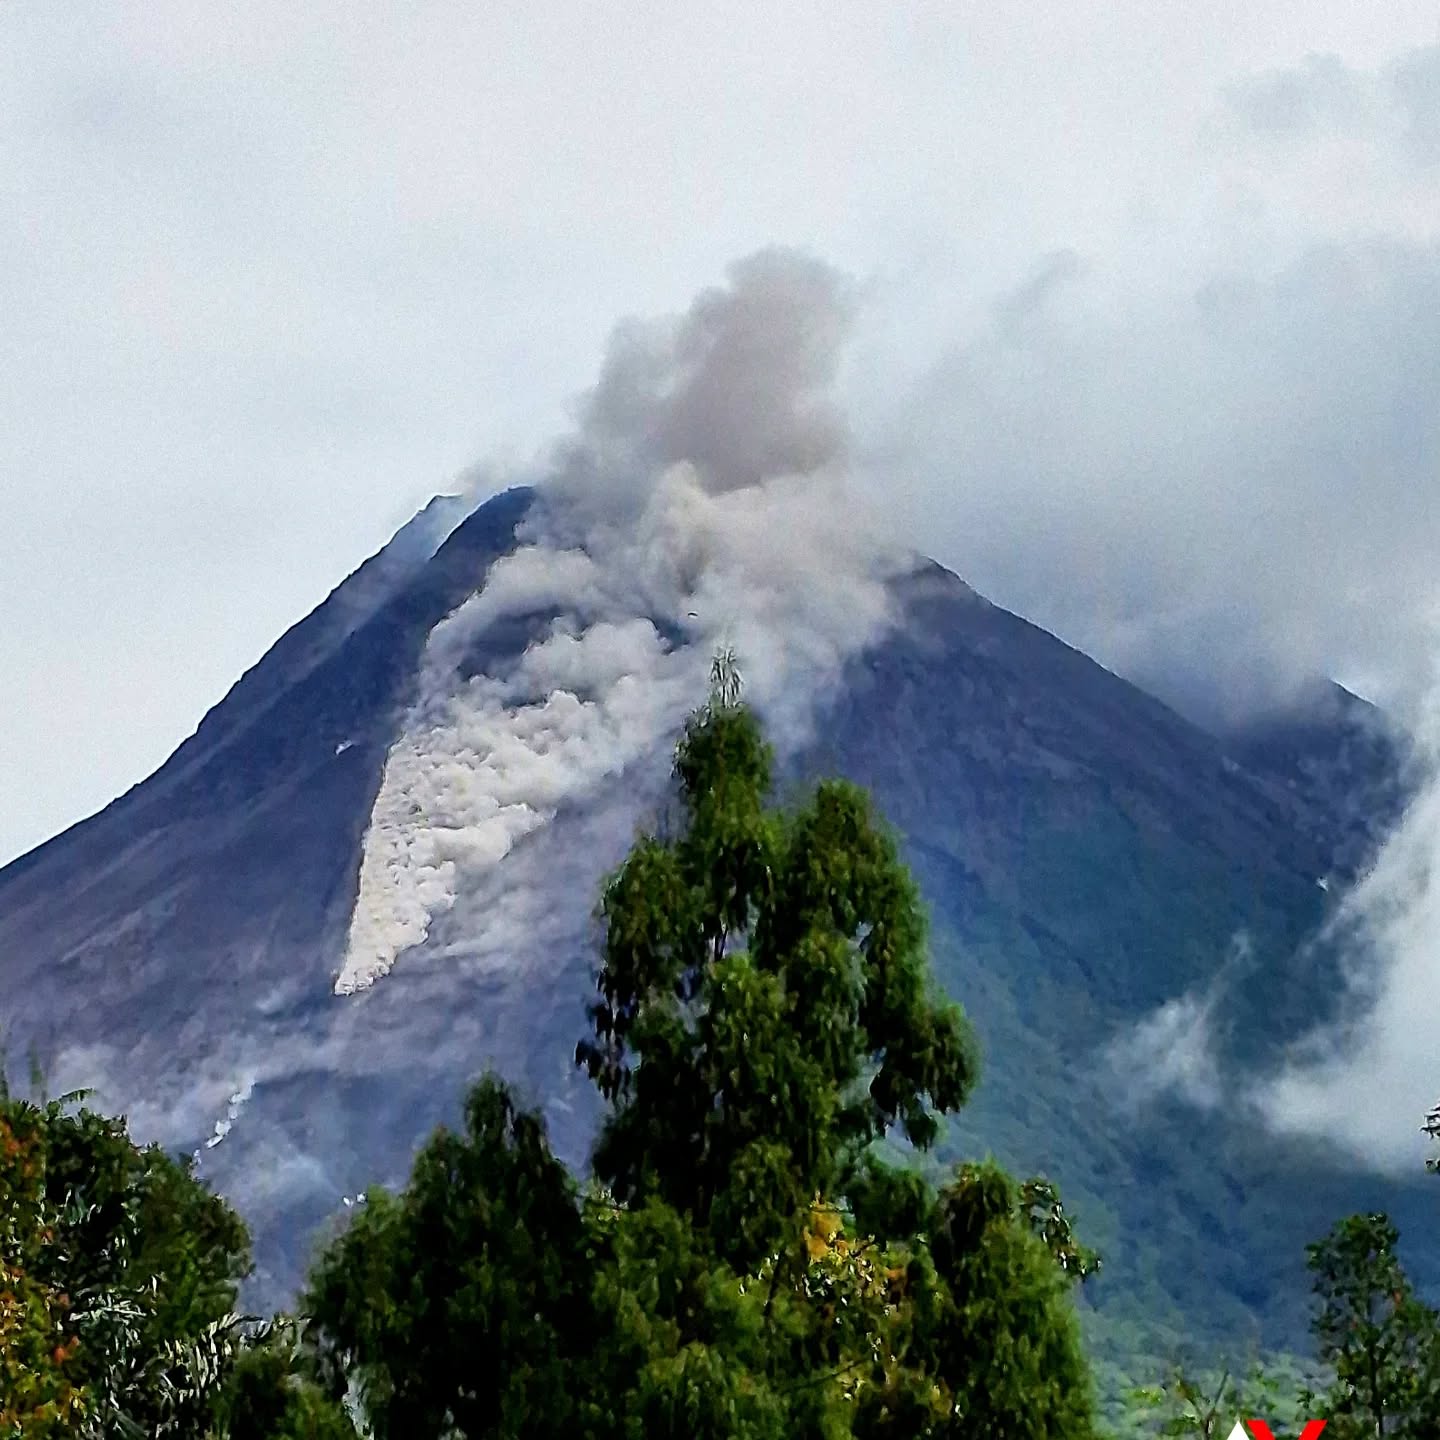
Indonesia , Merapi :
MOUNT MERAPI ACTIVITY REPORT, February 14-20, 2025
OBSERVATION RESULT
Visual
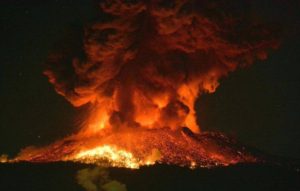
The weather around Mount Merapi is generally sunny in the morning and evening, while during the day it is hazy. White smoke, thin to thick thickness, low to moderate pressure, with a smoke height of 150 m was observed from the Babadan Mount Merapi observation post on February 19, 2025 at 07:30 WIB. This week, lava avalanches were observed 64 times in the Southwest (upstream of Kali Bebeng) up to a maximum of 1,900 m, 17 times upstream of Kali Krasak up to a maximum of 1,700 m, and 57 times in the West (upstream of Kali Sat/Putih) up to a maximum of 1,900 m. The highest hot spot of the Southwest dome was measured at 247.4 oC, higher than the previous measurement. The morphology of the Southwest dome was observed to have changed due to lava flow activity. For the central dome, no significant morphological changes were observed. In the central dome, the measured hot spot was 228.8 oC, relatively the same as the previous measurement. According to the analysis of aerial photos, the Southwest dome has seen an increase in volume to 3,546,200 m3. Meanwhile, the measured volume of the central dome remains at 2,360,700 m3.
Seismicity
This week, the seismicity of Mount Merapi recorded:
167 Multi-phase earthquakes (MP),
803 Avalanche earthquakes (RF),
2 Tremors,
6 Tectonic earthquakes (TT).
The intensity of earthquakes this week is still quite high.
Deformation
The deformation of Mount Merapi monitored using EDM and GPS this week showed no significant changes.
Rainfall and Lahars
This week, it rained at Mount Merapi observation post with the highest rainfall intensity of 39 mm/hour for 40 minutes at Babadan post on 15 February 2025 and there was a report of increased discharge in Kali Kuning and Kali Gendol.
Conclusion
Based on the results of visual and instrumental observations, it is concluded that:
The volcanic activity of Mount Merapi is still quite high in the form of effusive eruptions. The activity status is defined at the « SIAGA » level.
Source : BPPTKG
Photo : Andi volcanist via Margrethe Bonde / FB
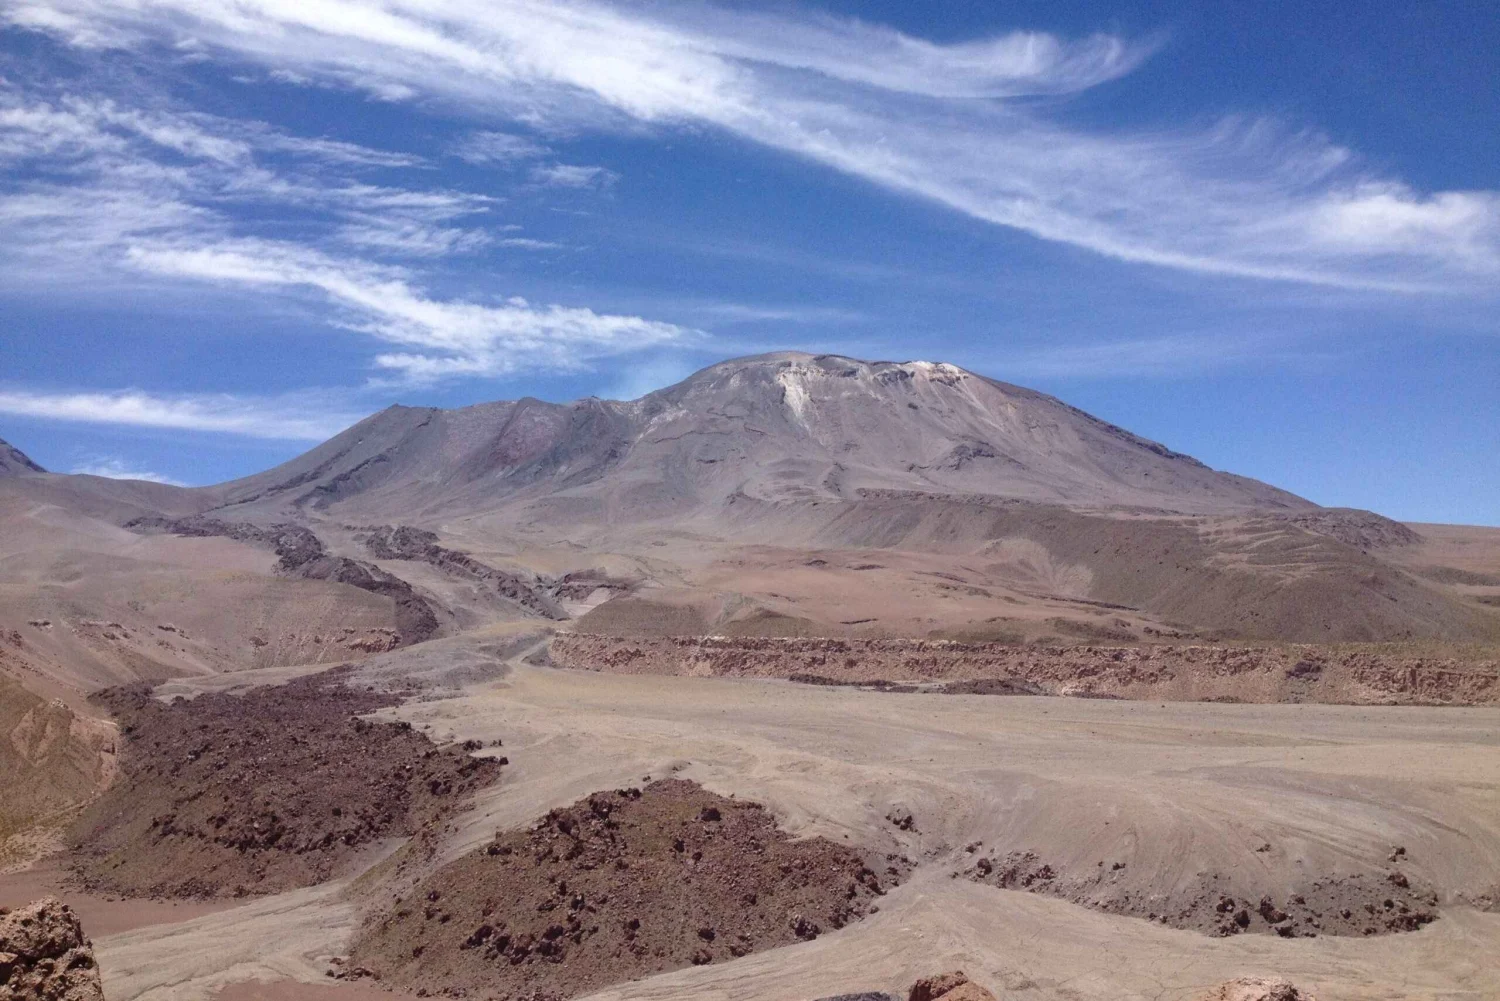
Chile , Lascar :
Seismology
The seismological activity of the period was characterized by the recording of:
33 VT-type seismic events, associated with rock fracturing (Volcano-Tectonic). The most energetic earthquake had a local magnitude (ML) value equal to 2.2, located 1.2 km south-southeast of the volcanic building, at a depth of 4.4 km from the crater.
43 LP-type seismic events, associated with fluid dynamics within the volcanic system (Long Period). The size of the largest earthquake estimated from the reduced displacement parameter (DR) was equal to 10 cm2.
Fluid Geochemistry
Sulfur dioxide (SO2) emission data obtained using the Differential Optical Absorption Spectroscopy (DOAS) equipment, corresponding to the Emú station, located 6 km east-southeast (ESE) of the active crater, showed an average SO2 flux value of 340 t/d, with a maximum daily value of 342 t/d on February 8.
Since February 6, 9 anomalies have been detected in satellite images obtained by the Tropospheric Monitoring Instrument (TROPOMI), in sulfur dioxide (SO2) emissions into the atmosphere in areas near the volcano. On February 12, the maximum emission value was recorded, reaching 1,091 tons of mass of SO2. It should be noted that subsequently, outside the reference period, the high values continued. These data were published by the Mounts Project and Global Sulfur Dioxide Monitoring.
Geodesy
The data obtained by the geodetic network, composed of three GNSS stations and which allows to detect the deformations of the volcanic system, indicate that:
– The rates of horizontal and vertical deformation are estimated to be low and do not exceed 0.3 cm/month. – Increase in the distance between the stations crossing the volcanic system, at a rate of 0.2 cm/month.
Regarding the radar and InSAR images, available on the mounts-project . com platform, there is no evidence of any signal that could indicate a deformation of the volcanic edifice.
Thermal anomalies by satellites
During the period, thermal alerts were recorded in the area associated with the volcano, according to the analytical processing of Sentinel 2-L2A satellite images, in combination with false color bands, a radiance anomaly is observed on February 6, in Landsat on February 8 and the MIROVA platform, records 1 Mw in VIIRS on February 10.
Surveillance cameras
Images from surveillance cameras installed near the volcano recorded a significant variation in the degassing column starting from 6 February, with heights reaching 2,040 m above the crater level on 6 February and a maximum during the assessed period of 2,080 m on 9 February. As of 13 February, weather conditions did not allow the volcano to be observed. Outside the period reported in this report, degassing continues at a lower altitude, with a white color and snow cover in the crater area.
Satellite geomorphological analysis
According to the Planet Scope Scene satellite images (spatial resolution of 3 m), no morphological changes are identified in the volcanic system. It should be noted that the change in the degassing pattern observed through the surveillance cameras can be observed, which began on 6 February and continued until the date of publication of this report.
During the period assessed, a change in volcanic activity was identified, recording an increase in various monitoring parameters. These changes are linked to notable increases in the recording of SO2 emissions into the atmosphere, reaching a maximum value of 1 MW on 10 February in thermal anomalies (although before this period anomalies of lower power were recorded), the appearance of bursts in the active crater of the volcano and degassing columns exceeding 2,000 m above the crater level. This situation led to a change in the technical volcanic alert on 12 February, see REAV of 12 February 2025_16:00 HL . It should be noted that, during the last days of the fortnight, the aforementioned increase in SO2 emissions into the atmosphere continued, without significant variations in the other monitoring indicators. The seismicity record remains low, but some features of the seismic waveforms show similarities with those that occurred during the 2022-2023 crisis. The above indicates that the system remains above its baseline activity threshold, therefore its technical alert remains at:
YELLOW TECHNICAL ALERT: Changes in the behavior of volcanic activity
Observation:
A potential impact zone of 1 km from the center of the active crater is envisaged, without excluding possible pyroclastic materials extending beyond this zone.
Source : Sernageomin
Photo : Myguidechile . com
Iceland , Reykjanes Peninsula :
Increased likelihood of an eruption on the Sundhnúkur crater row.Anticipate a potentially short warning prior to an eruption
Updated 21. February at 14:15 UTC
Updated models show that the amount of magma under Svartsengi has reached the same volume as had accumulated prior to the last eruption
It is anticipated that an eruption may start with very short warning
The most likely scenario is a fissure opening in the area between Sundhnúkur and Stóra-Skógafell
The area impacted by a volcanic eruption is determined by whether the eruptive fissures extend towards north or south.
The hazard assessment has been updated and the hazard level has been raised in three regions
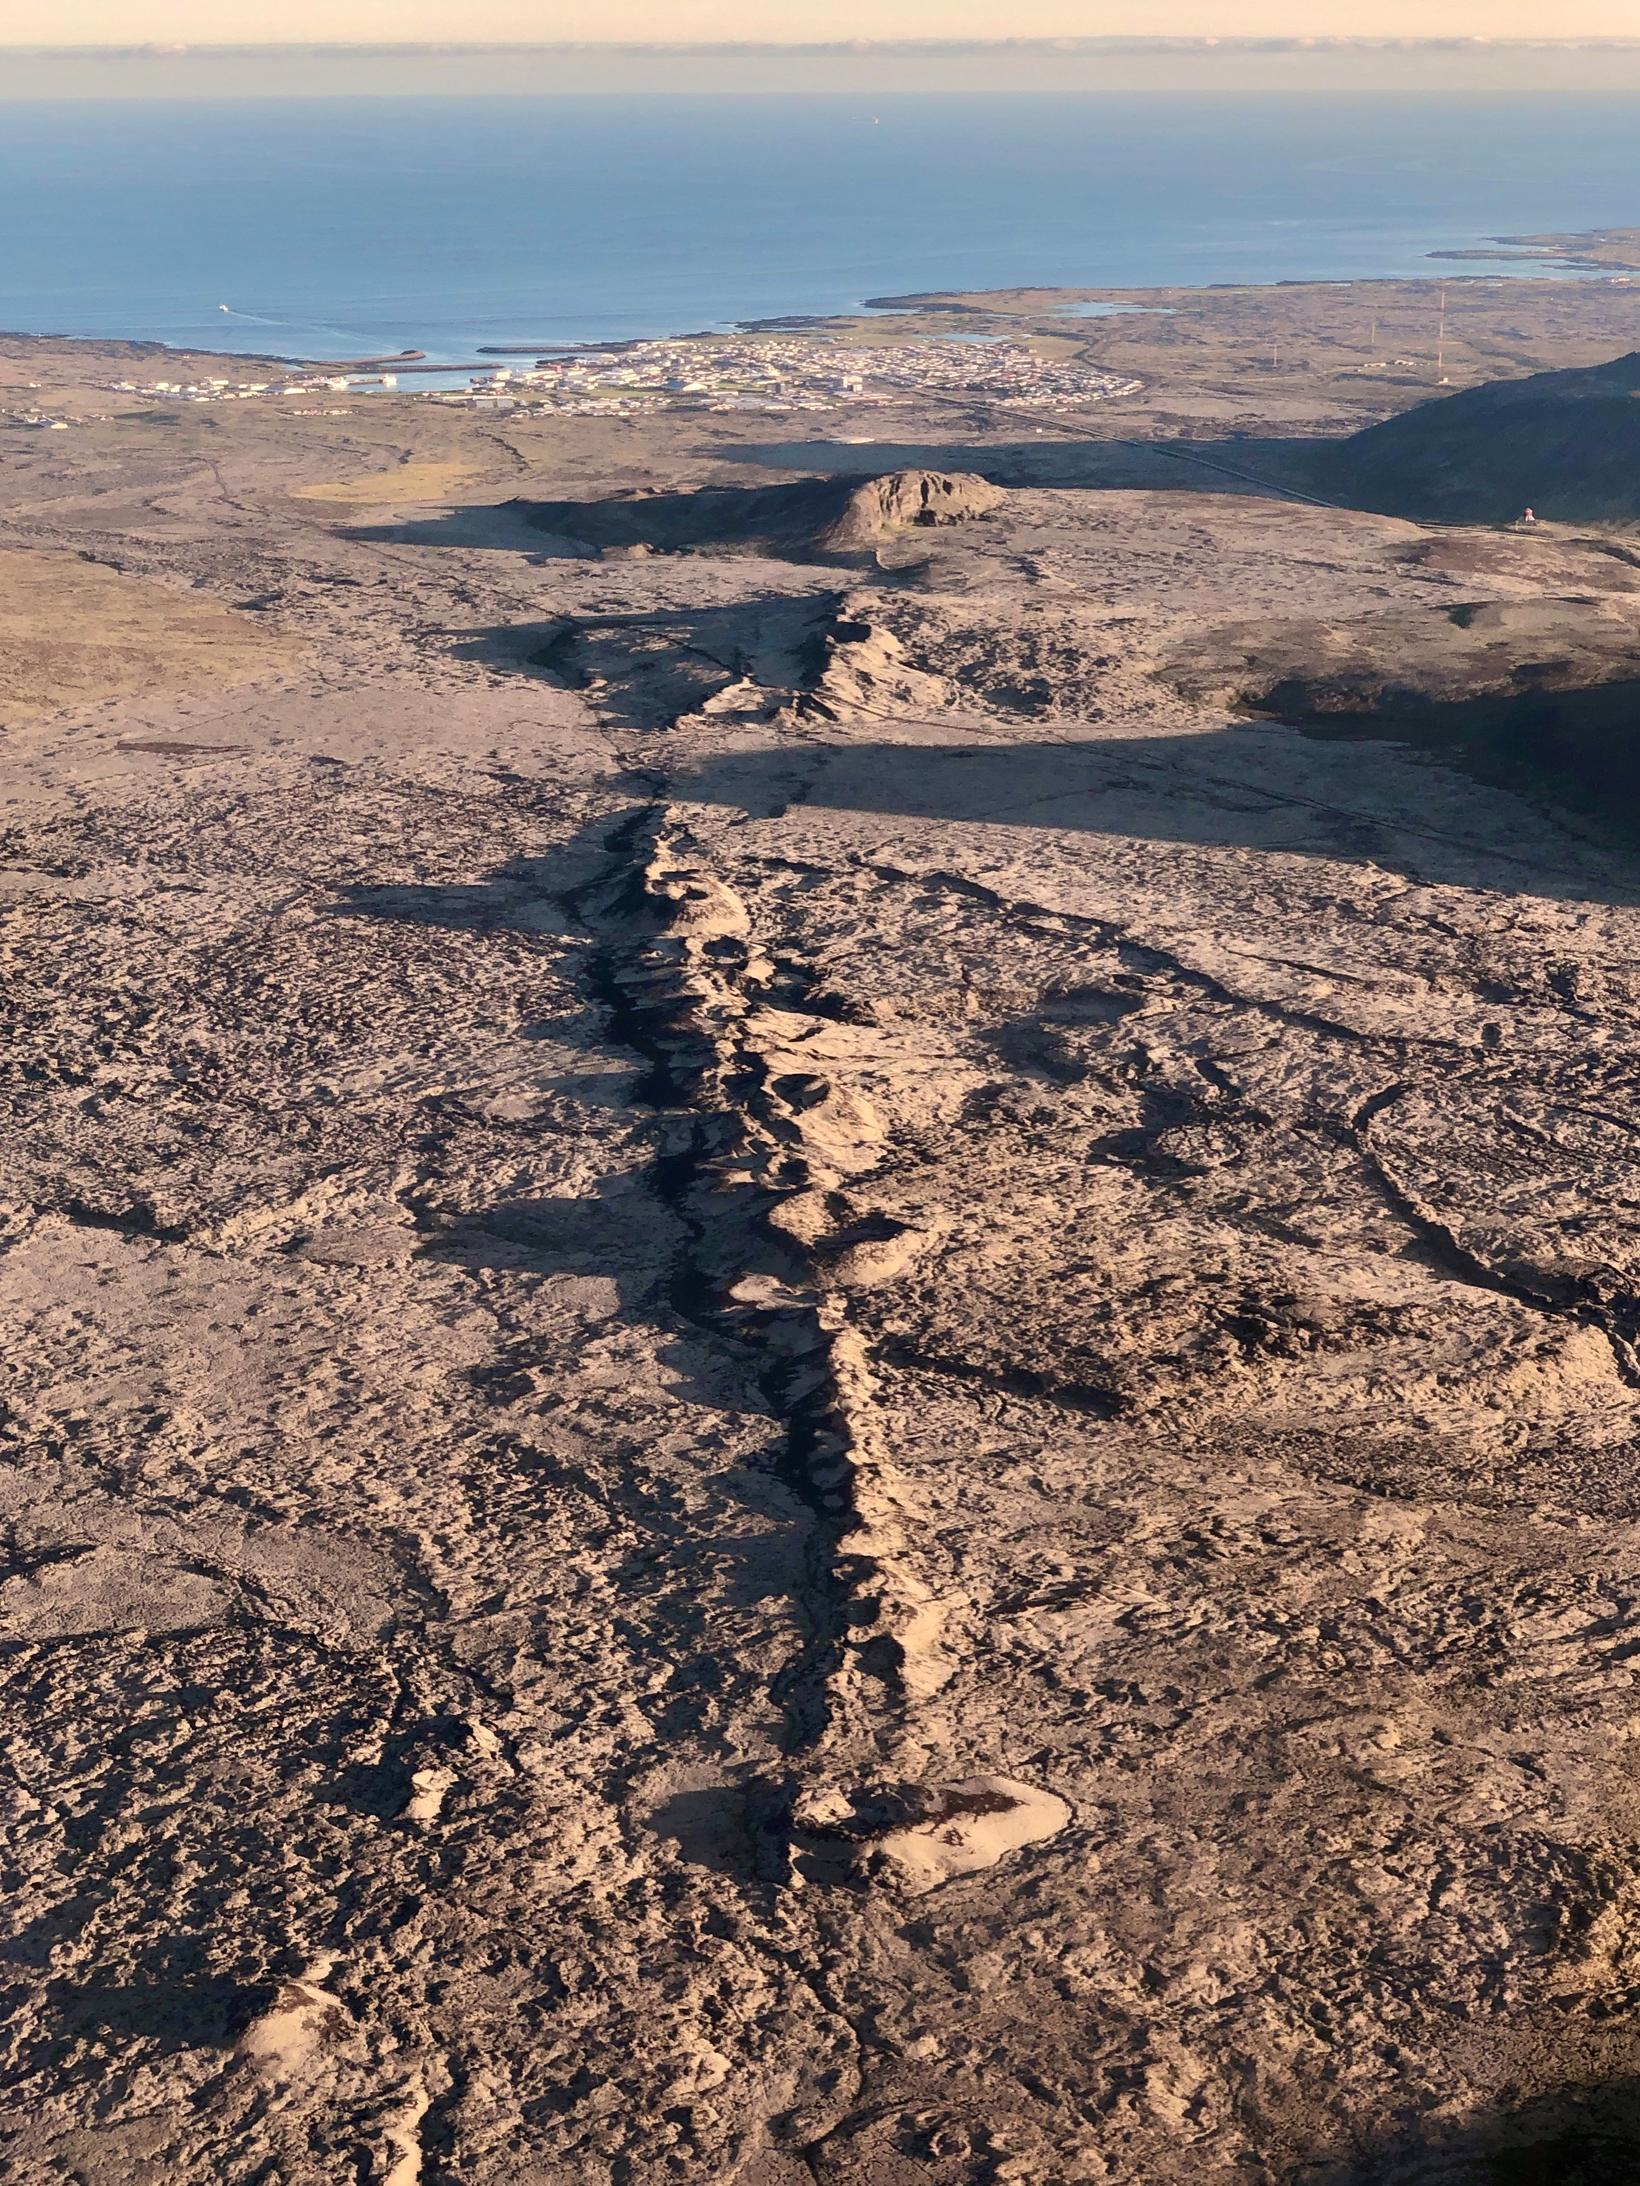
Updated models show that the amount of magma under Svartsengi has reached the same volume as had accumulated prior to the previous eruption that began on November 20, 2024.
Based on previous eruptive events in the Sundhnúkur crater row, it is therefore assumed that there is an increasing probability that the next event will occur within a few days or weeks.
If an eruption occurs, it will be the eighth one in this area since December 2023. Stress in the crust has diminished with each dyke intrusion and eruption that has occurred. This means that fewer and smaller earthquakes may occur in the weeks and days before an eruption now as compared with when the activity first started.
A shorter notice is can thus be anticipated before the next potential eruption, and the warning might be as short as half an hour, depending on where the magma reaches the surface. The signals that have been seen when magma starts to move towards the surface are: a cluster of small earthquakes on the Sundhnúkur crater row, changes in the pressure in boreholes from the Svartsengi power plant and changes in the crust´s deformation seen by a fiber optic cable and the real-time GPS data.
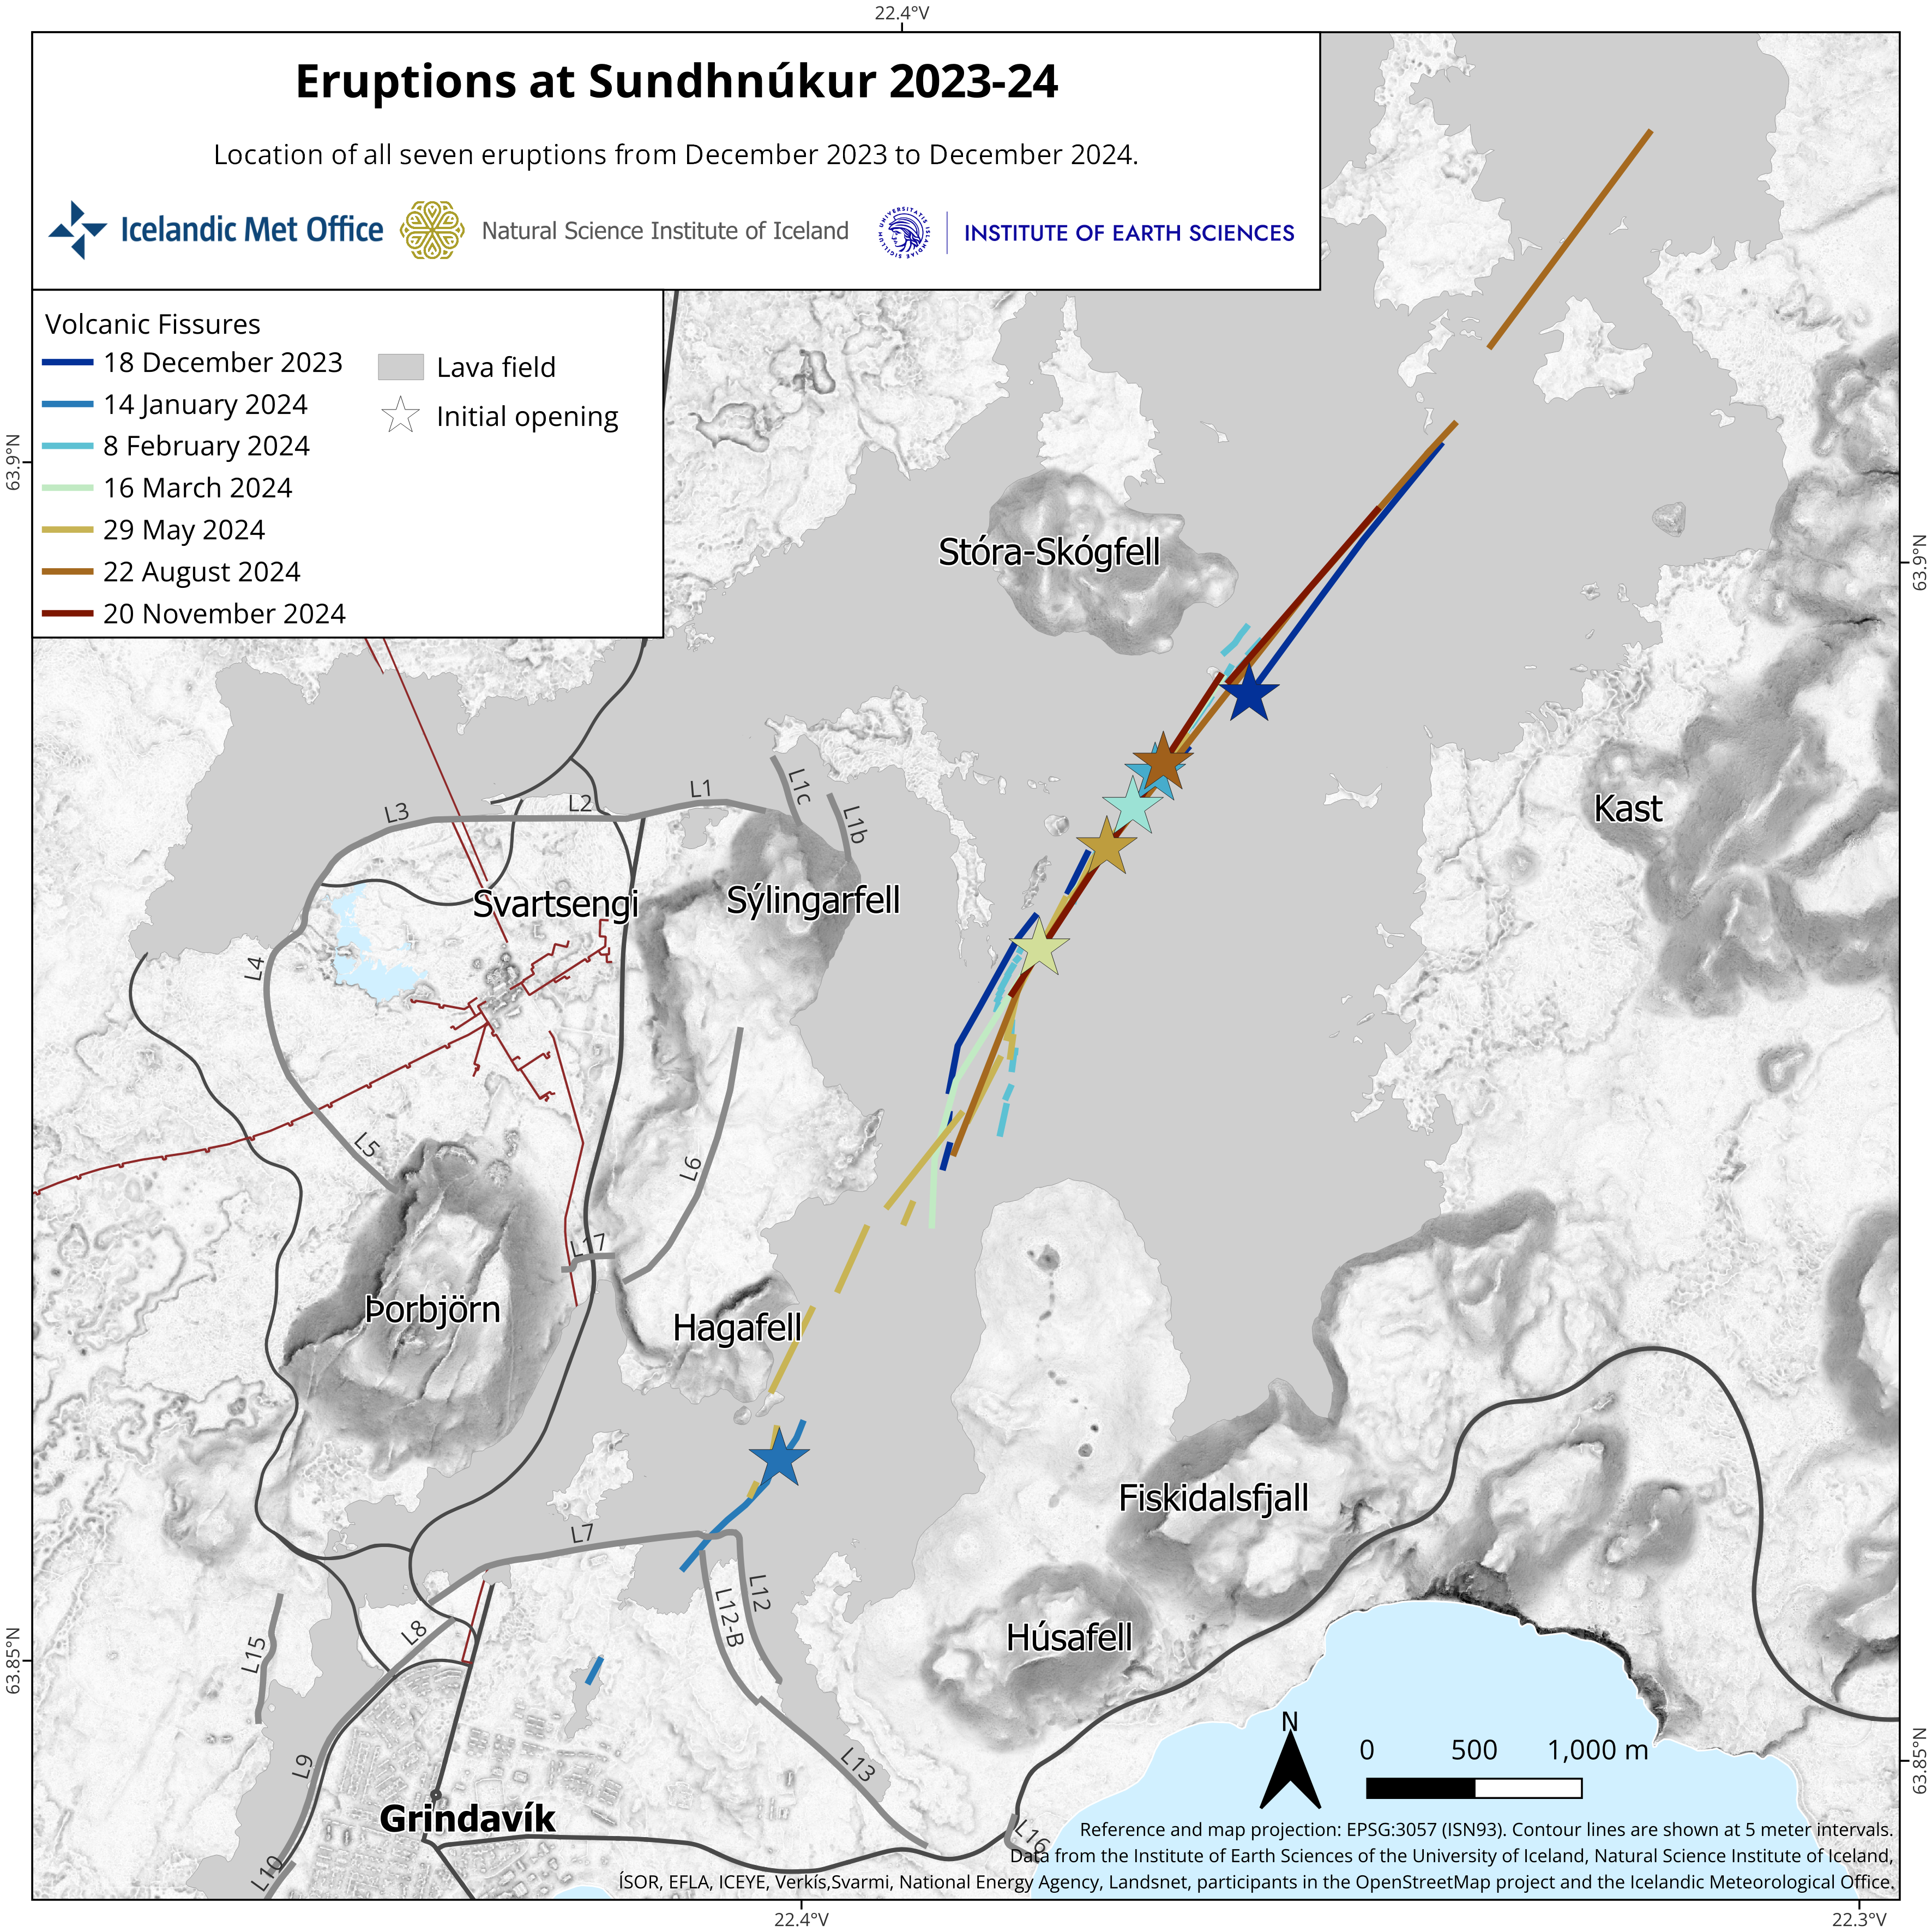
The map shows the location of the first fissure opening (star) and the length of the volcanic fissures in the seven eruptions that have occurred in the Sundhnúkur crater row since December 2023.
Series of earthquakes occurred in the Sundhnúkur crater row last night
At around 19:50 last night, several earthquakes were detected in a few minutes in the area between Sundhnúkur and Stóra-Skógfell, which could indicate the onset of a magma propagation. The monitoring staff on duty saw no other signs from other types of instruments.
Similar seismic activity was observed in the area on 4 November last year, but an eruption started on 20 of November.
Source : IMO
Photos : Siggi Anton , IMO.