February 2 , 2025.
United States , Yellowstone :
Saturday, February 1, 2025, 5:06 AM MST (Saturday, February 1, 2025, 12:06 UTC)
44°25’48 » N 110°40’12 » W,
Summit Elevation 9203 ft (2805 m)
Current Volcano Alert Level: NORMAL
Current Aviation Color Code: GREEN
Summary
Yellowstone Caldera activity remains at background levels, with 56 located earthquakes in January (maximum = M3.7). Deformation measurements indicate a small amount of caldera subsidence since early October.
Recent Work and News
Minor eruptions at Steamboat Geyser continued throughout January, indicating the possibility of the geyser’s first major eruption of the year in the coming days to weeks.
Seismicity
During January 2025, the University of Utah Seismograph Stations, responsible for the operation and analysis of the Yellowstone Seismic Network, located 56 earthquakes in the Yellowstone National Park region. The largest event of the month was a minor earthquake of magnitude 3.7 located about 15 miles south-southwest of Mammoth Hot Springs in Yellowstone National Park on January 28 at 5:59 PM MST. This event was felt in the surrounding area and is the mainshock of a sequence of 25 located earthquakes. The sequence includes two foreshocks and 22 aftershocks, with aftershock activity ongoing.
There were no swarms identified during the month of January.
Yellowstone earthquake activity is currently at background levels.
Ground Deformation
Continuous GPS stations in Yellowstone Caldera recorded a small amount (about 1 centimeter, or a fraction of an inch) of subsidence since October. This pattern and rate of subsidence continues a trend that started in 2015–2016. Minor subsidence (less than 1 centimeter) was also measured by a continuous GPS station near Norris Geyser Basin over the past 2–3 months.
Source : YVO
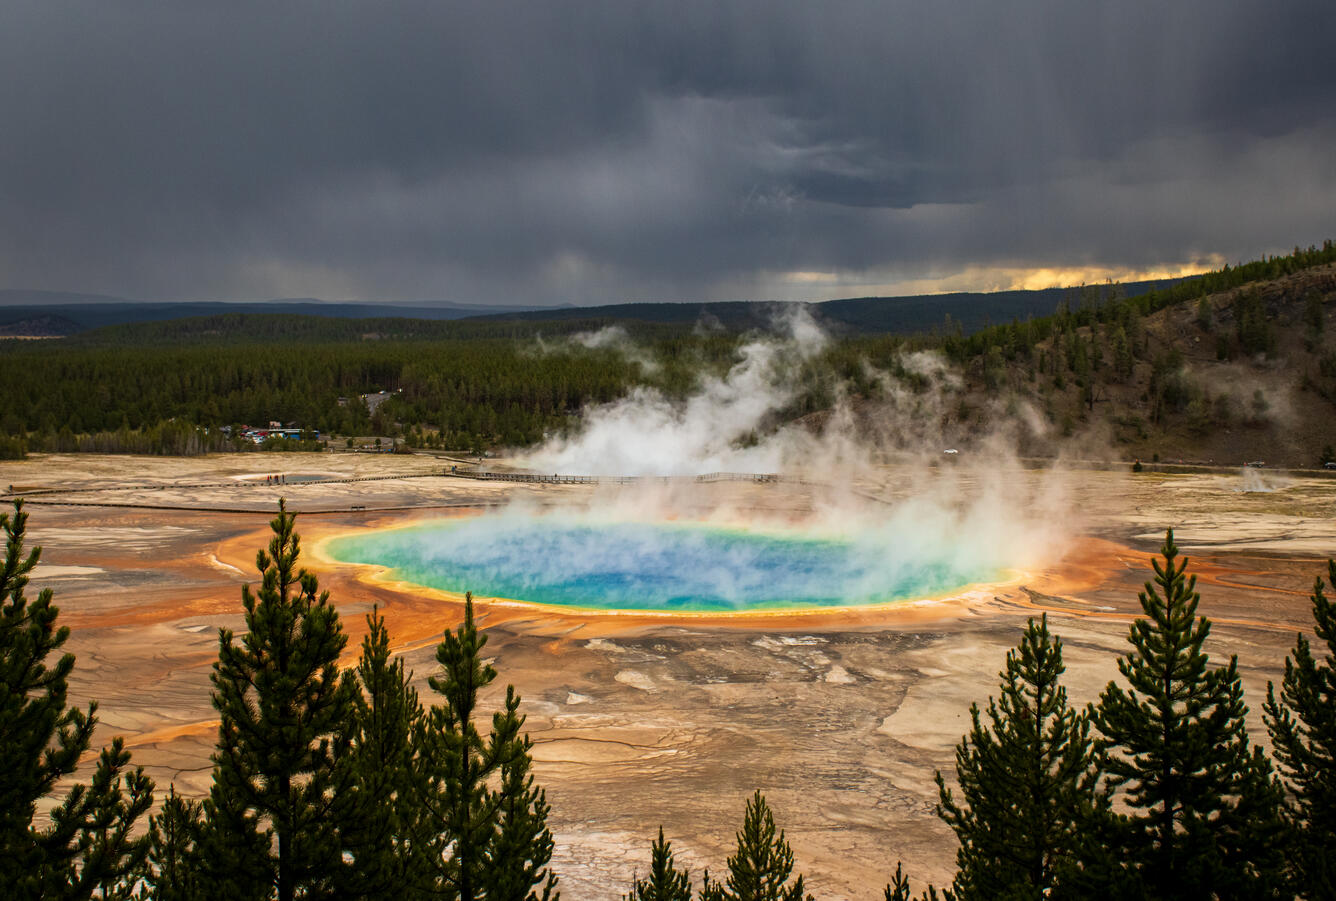
Photo : USGS , 10/2023 /Grand Prismatic Spring
Indonesia , Awu :
Awu Volcano Activity Level Decrease from Level III (SIAGA) to Level II (WASPADA) on February 2, 2025 at 06:00 WITA
Geographically, G. Awu is located at coordinates 3.6828460o N and 125.455980o E with a maximum height of 1320 meters above sea level. Administratively, Mount Awu is located on Sangihe Island in North Sulawesi Province. Awu Volcano was observed visually and instrumentally from the volcano observation post located on Jl. Radar, Kel.
On April 16, 2024, the activity level of Mount Awu was upgraded from Level II (Waspada) to Level III (Siaga) due to an increase in shallow volcanic (VB) and deep volcanic (VA) seismic activity. The latest developments in Mount Awu activity up to 31 January 2025 are as follows:
Current visual observations show that surface activity is still in the form of smoke from the crater rising approximately 10 to 200 meters (mostly 20 meters) above the peak. This condition has not changed significantly since July 2024, indicating that the smoke emission activity from the crater is still fluctuating and there has been no significant continuous increase.
A series of deep and shallow volcanic earthquakes (spasmodic tremors) are still occurring, but the number of events is decreasing. The latest sequence of volcanic earthquakes occurred on 31 January 2025 between 18:07 and 18:17 WITA and recorded 9 shallow volcanic earthquakes. With the decrease in the frequency of shallow volcanic earthquakes, the process of pressure release and cracking of rocks under the lava dome has decreased.
Monitoring the deformation of Mount Awu using a tiltmeter at the Kolongan station still shows pressure buildup caused by magmatic activity. Similarly, the summit tiltmeter station also shows that there is still pressure buildup.
Visual and instrumental observations show a decrease in seismic activity that is still accompanied by pressure buildup. Sudden changes are still possible. However, with the presence of the 2004 lava dome in the crater, it would take enormous energy to produce an eruption on Awu. Assessments will continue to be conducted to monitor future activities of the volcano.
Potential hazards from Mount Awu that may occur include phreatic or magmatic eruptions that can produce ejections of incandescent material and/or pyroclastic flows. The risk of volcanic earthquake swarms or lava dome collapses may occur if the pressure within the magmatic system experiences a sudden and significant increase. Another potential hazard is volcanic gas emissions, which can be life-threatening if the inhaled concentration exceeds the safety threshold value.
Based on the results of visual and instrumental monitoring up to 31 January 2025, the activity level of Mount Awu has been lowered from Level III (SIAGA) to Level II (WASPADA) as of 2 February 2025 at 06:00 WITA.
Source et photo : PVMBG .
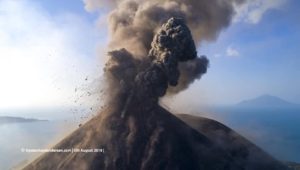
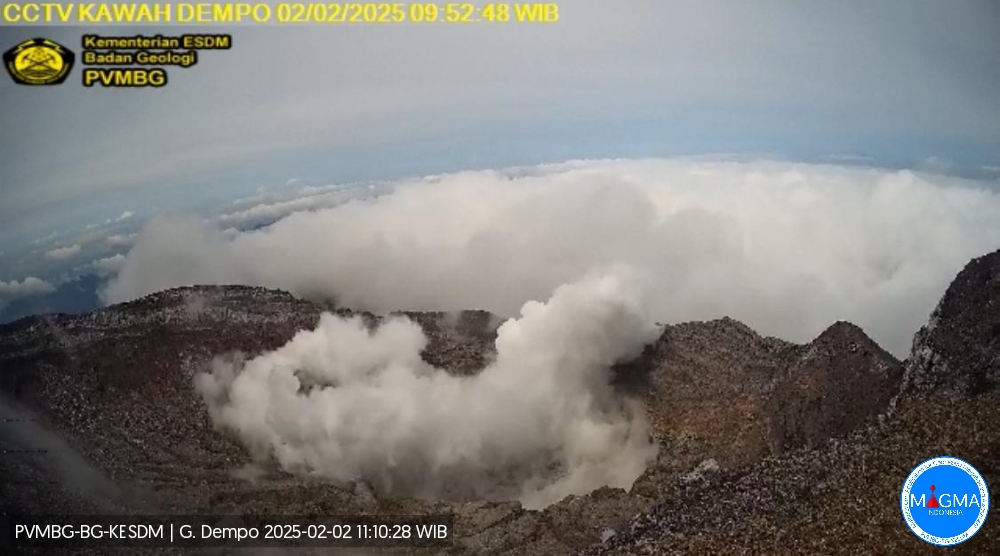
Indonesia , Dempo :
An eruption of Mount Dempo occurred on Sunday, February 2, 2025, at 09:52 WIB with an observed ash column height of ± 50 m above the peak (± 3223 m above sea level). The observed ash column was white with moderate intensity, oriented towards the North. This eruption was recorded on a seismograph with a maximum amplitude of 24 mm and a duration of 27 seconds.
VOLCANO OBSERVATORY NOTICE FOR AVIATION – VONA
Issued : February 02 , 2025
Volcano : Dempo (261230)
Current Aviation Colour Code : ORANGE
Previous Aviation Colour Code : orange
Source : Dempo Volcano Observatory
Notice Number : 2025DEM002
Volcano Location : S 04 deg 01 min 48 sec E 103 deg 07 min 48 sec
Area : South Sumatra, Indonesia
Summit Elevation : 10154 FT (3173 M)
Volcanic Activity Summary :
Eruption with volcanic ash cloud at 02h52 UTC (09h52 local).
Volcanic Cloud Height :
Best estimate of ash-cloud top is around 10314 FT (3223 M) above sea level or 160 FT (50 M) above summit. May be higher than what can be observed clearly. Source of height data: ground observer.
Other Volcanic Cloud Information :
Ash cloud moving to north. Volcanic ash is observed to be white. The intensity of volcanic ash is observed to be medium.
Remarks :
Eruption recorded on seismogram with maximum amplitude 24 mm and maximum duration 27 second. Tremor recorded on seismogram with maximum amplitude 1 mm.
Source et photo : Magma Indonésie .
Greece , Santorini :
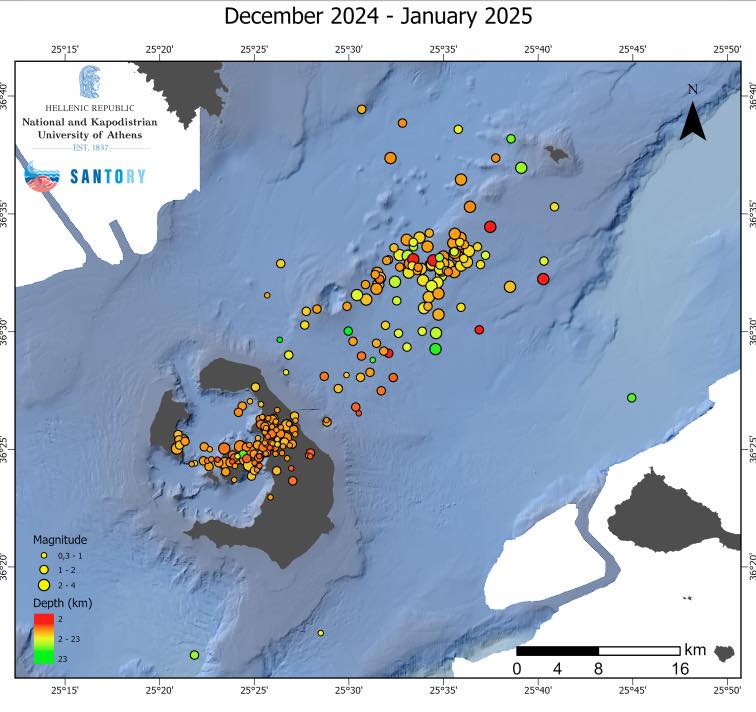
It is worth noting that, mainly in the last two months, weak seismic vibrations with a small focal depth have been observed in the area of the two volcanic centers of Santorini: in Nea Kameni and in Koloumpos.
The seismic vibrations within the Santorini caldera are located on the Kameni fault (Kameni line) (seismic and volcanic unrest similar to those of 2011-12 without causing an eruption) and in the North-East of Santorini, near Kolumbo, on the Anydros fault.
In recent days, there has been a continuous weak seismic activity that has also worried the inhabitants of our island, in the North-East of Santorini, in the area of Koloumpos.
We all know that BOTH of our volcanoes are active and have experienced volcanic eruptions in the past. However, volcanoes warn us, and now, thanks to the use of high-tech equipment, we can predict a volcanic eruption.
However, to the northeast of Santorini, the Kolumpos volcano is adjacent to active tectonic zones that produce tectonic earthquakes! As happened in the last few days!
Scientists monitor seismic activity as we always do, writing, analyzing and combining geodynamic phenomena and providing information.
Both volcanoes must be continuously monitored with instruments and, especially in the underwater area, oceanographic missions must be conducted and marine geohazards must be studied.
Underwater seismographs have already been placed in the North-Eastern area of Santorini during the oceanographic mission of the RV Maria Merian.
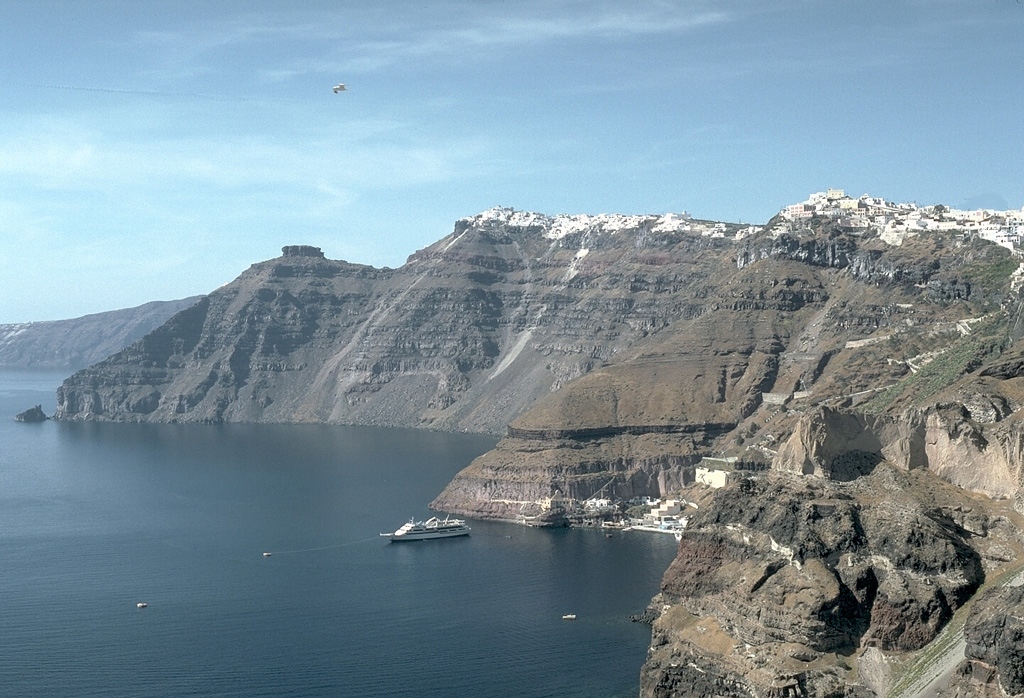
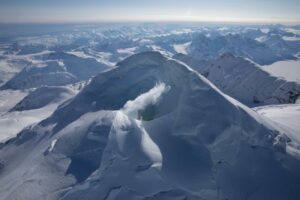
The steep inner walls of Santorini drop steeply into the caldera bay. Pyroclastic flow deposits from four caldera-forming eruptions dating back to 100,000 years ago are exposed in the caldera walls in this N-looking view. The youngest caldera was formed about 3,500 years ago during the Minoan eruption of Santorini. The flat-topped peak on the left skyline is Skaros, a remnant of a shield volcano constructed within a previous caldera.
Santorini (Thera), in the Aegean Sea, has steep-walled caldera rim with villages that overlook an active volcanic island in the center of a caldera bay. The circular island group is composed of overlapping shield volcanoes cut by at least four partially overlapping calderas. The oldest southern caldera was formed about 180,000 years before present (BP), followed by the Skaros caldera about 70,000 BP, and then the Cape Riva caldera about 21,000 BP. The youngest caldera formed about 3,600 BP (around 1600 BCE) during the Late-Bronze-Age Minoan eruption that forced abandonment of the island. Post-Minoan eruptions beginning in 197 BCE constructed a series of lava domes and flows that form two islands near the center of the caldera. A submarine eruption took place in 1650 CE at Kolumbo, about 6.5 km NE of Thera. The latest eruption produced a small lava dome and flow in 1950, accompanied by explosive activity.
Source : Evi Nomikou via Bernard Duyck / FB , GVP.
Photos : National et kapodistrian universié d’Athenes , Lee Siebert, 1994 (Smithsonian Institution).
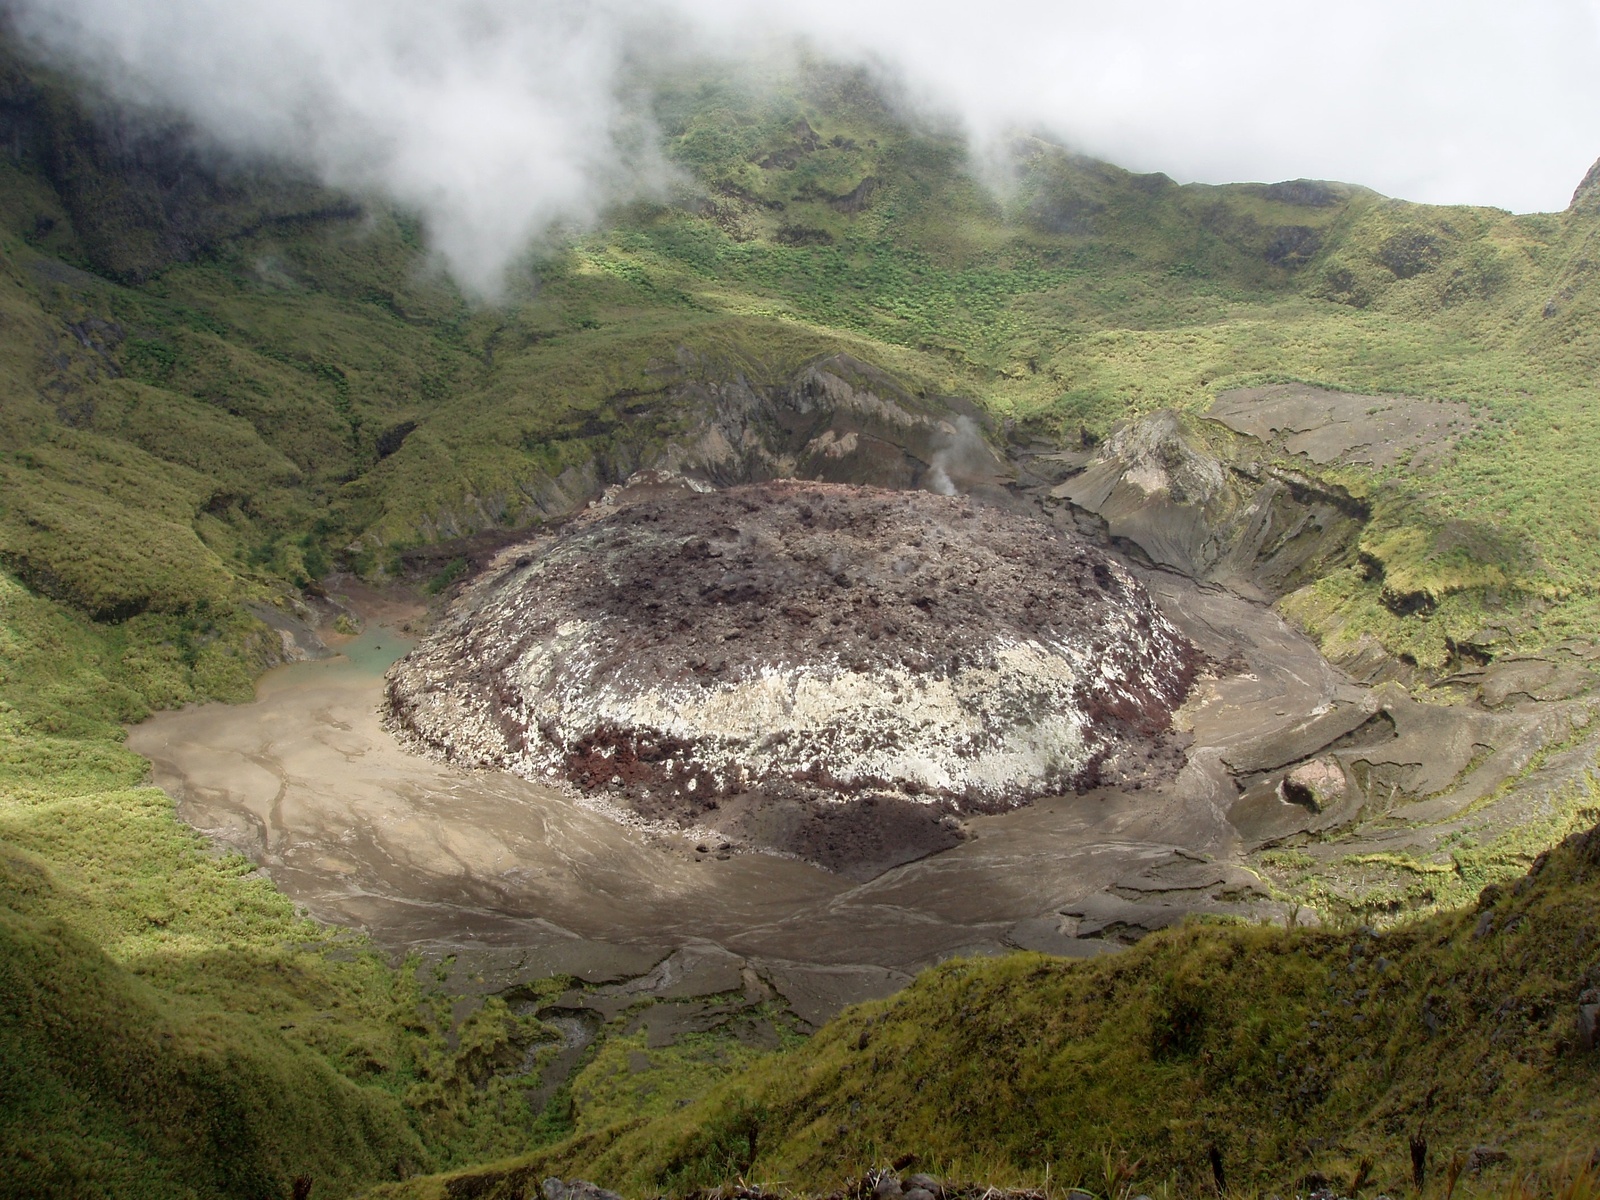
Costa Rica , Poas :
Latitude: 10.20°N;
Longitude: 84.23°W;
Altitude: 2687 m
Current Activity Level: Warning
A significant change in seismic patterns is noted this week. On the evening of the 24th, a spasmodic tremor began to occur and lasted until the next day. After that, the amplitude of the tremor remained very stable compared to the last weeks. Similarly, a significant change in the magnitude and duration of the eruptions was observed. This week, they were less energetic and shorter. Starting from the 30th, a change in long-period events is observed, with a more impulsive and energetic waveform. In addition, high-frequency events were recorded again this week, after decreasing last week. Finally, in the last hours, an increase in the number of proximal volcano-tectonic events has been observed, which could suggest the rupture of rock beneath the active crater.
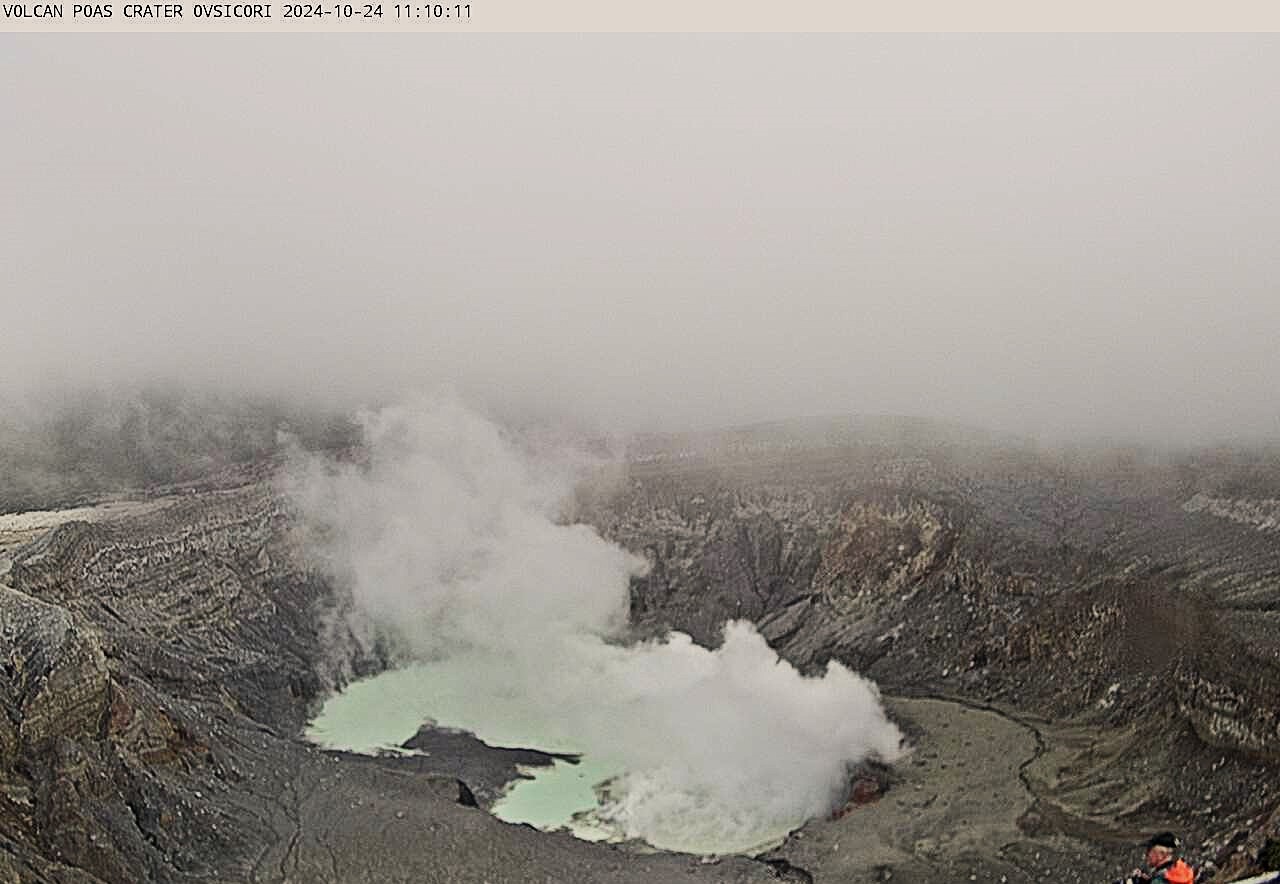
Geodetic monitoring detected a period of crustal inflation in the northern sector of the crater between late November and early December 2024, followed by an even larger episode of volcanic inflation from late December to date. Over the past two weeks, the station located north of the crater has recorded a displacement of two centimeters, although with a stabilizing trend. In contrast, stations located south of the crater also show uplift, but to a lesser extent. For the period between December 2024 and January 2025, analytical models suggest the presence of an inflation source located 1 km below sea level, with an estimated volume change of 1 million m³. However, these models should be interpreted with caution as they are subject to a high degree of inaccuracy.
This week there is a slight decrease in the SO2 flux (321 ± 78 t/d) compared to the previous week (403 ± 94 t/d), however, this flux remains significantly high. The MultiGAS station recorded high SO2 concentrations (weekly average of 13 ppm, similar to the previous week). The SO2/CO2 ratio remains relatively stable with an average of 1.2 ± 0.5 this week. The H2S/SO2 ratio remains low with values close to 0. SO2 concentrations recorded at Mirador reached a maximum of 4.8 ppm. The OMI instruments of the SENTINEL satellite detected SO2 in the atmosphere only on January 24 with a low value of 3 tons.
The lake level has decreased by about 0.4 m in 1 week, a trend that is accelerating. The temperature of the lake has been measured remotely at over 55°C. Convective activity was observed at both mouths A and C.
Source et photo : Ovsicori .