January 10 , 2024.
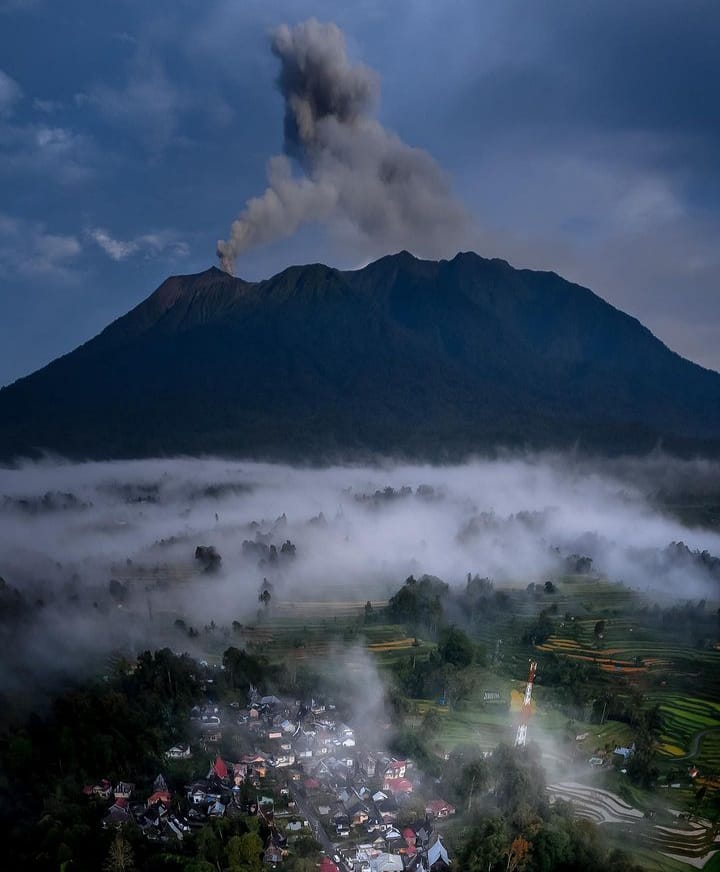
Indonesia , Marapi :
Increased activity level of Mount Marapi, West Sumatra from level II (WASPADA) to level III (SIAGA).
Assessment of the activity level of Mount Marapi, West Sumatra province:
Introduction
Marapi Volcano (2,891 meters above sea level) is administratively located in Agam Regency and Tanah Datar Regency, West Sumatra Province. The summit of this volcano is located at coordinates 0o 22′ 47.72″ South latitude – 100o 28′ 16.71″ East longitude.
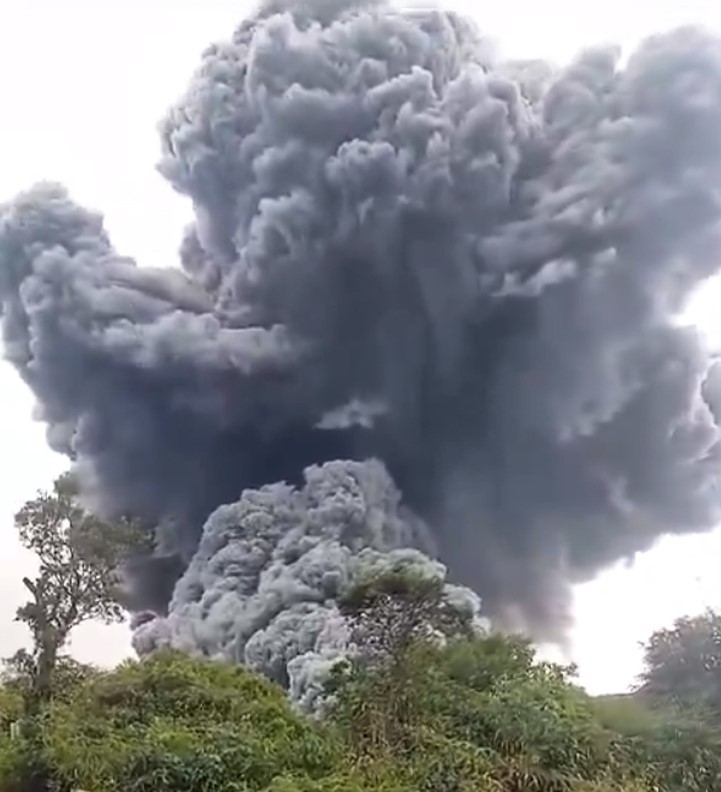
The current eruption period begins on December 3, 2023 at 2:54 p.m. WIB. The eruption occurred explosively with an eruptive column height of approximately 3,000 meters above the summit (5,891 meters above sea level) and was recorded on a seismograph with an amplitude maximum of 30 mm and a duration of 4 minutes 41 seconds. The eruption column was gray in color with a thick east-oriented intensity. The eruption was also accompanied by pyroclastic flows towards the North with a sliding distance of 3 km from the summit. So far, eruption and emission activity is still ongoing.
Visual observation
From January 1 to 8, 2024, Mount Marapi is visually clear until covered by fog. White to gray smoke was observed coming from the main crater of medium to thick intensity at a height of approximately 150 to 700 meters above the summit. An eruption was observed with a column height of 700 meters above the summit with a gray eruption column.
Instrumental observation
Seismicity data for the period January 1-8, 2024 are dominated by emission earthquakes. The complete seismicity recorded was 8 explosion/eruption earthquakes, 65 emissions earthquakes, 2 low frequency earthquakes, 1 shallow volcanic earthquake, 11 deep volcanic earthquakes, 8 local tectonic earth, 18 distant tectonic earthquakes and continuous tremors of amplitude 0.5-2 mm (dominant value 1 mm).
Deformation data from Batupalano station after the main eruption on December 3, 2023 shows a horizontal trend on the tangential and radial axes. Meanwhile, Puncak Station is still suffering damage from material from the December 3 eruption.
Assessment
Mount Marapi’s volcanic activity in early 2023 was dominated by explosive eruptions that lasted from January 7, 2023 to February 20, 2023, with eruptive column heights ranging from 75 to 1,000 meters above the summit. Subsequently, the eruption stopped and seismic activity was dominated by local tectonic and distant tectonic earthquakes. However, volcanic earthquakes are still recorded, although in relatively small numbers, indicating that magma/fluid is still being pushed up from depths.
On December 3, 2023 at 2:54 p.m. WIB, another eruption occurred, which was not preceded by a significant increase in volcanic earthquakes. Deep volcanic earthquakes (VA) were only recorded 3 times between November 16 and December 2, 2023 with a relatively flat RSAM (Real Seismic Amplitude Measurement) baseline. The inclinometer data also shows flattening on the radial axis and slight swelling on the tangential axis.
After the eruption of December 3, 2023, other eruptions are still underway today. The number of daily eruptions tends to decrease, but on the other hand, the number of low-frequency earthquakes and deep volcanic earthquakes (VA) tends to increase, indicating that the supply of magma in depth always occurs and tends to increase. This can also be seen on the RSAM base chart which is always above normal and the inclinometer data which tends to be flat.
The presence of eruptive activity that was observed visually and still recorded earthquakes and eruptive emissions accompanied by continuous shaking shows that the activity of Mount Marapi is still relatively high. Data from the Sentinel satellite also show that the emission rate (flux) of SO2 gas resulting from the activity of Mount Marapi is currently relatively high. The presence of magma in/at the crater floor, which has been reported since the observation of incandescence at the summit of Mount Marapi on the night of December 6, 2023 and the observation of ejections of incandescent material during subsequent eruptions, shows that there was a change in the type of eruption from phreatic to magmatic type.
The conditions mentioned above can potentially cause a build-up of pressure inside the volcanic body, which can cause an eruption with increased energy and a range of ejection of glowing material further from the center of the eruption. Therefore, the potential/threat of danger from Mount Marapi may also expand, namely:
If the supply of magma from the depths continues and tends to increase, then the eruption may occur with greater energy with the potential/threat of danger due to ejections of rock-sized volcanic material (bombs), of lapilli or ash estimated to reach a radius of 4.5. km from the center of the eruption. /Verbeek crater. During this time, the potential/threat of eruption ash may spread more widely/far depending on wind direction and speed.
Eruptive materials that fall and settle on the summit and slopes of Mount Marapi can turn into lahars when mixed with rainwater. Therefore, there is a potential danger from lava flows/floods in the valleys/streams of the rivers that originate at the top of Mount Marapi.
There is a potential danger from toxic volcanic gases such as CO2, CO, SO2 and H2S gases in the crater/summit area of Mount Marapi.
Conclusions:
Based on the results of a comprehensive analysis and assessment, the level of activity
Mount Marapi was upgraded from Level II (WASPADA) to Level III (SIAGA) from January 9, 2024 at 6:00 p.m. WIB, with recommendations adapted to the latest potential/threats of danger.
Source : PVMBG
Photos : Sumatera Barat Indonesia , auteur inconnu via objectif volcans.
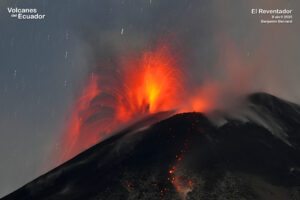
Iceland , Reykjanes Peninsula :
Increased Risk of an Eruption in the Coming Days . Model calculations indicate that the intrusion beneath Svartsengi has accumulated a similar volume of magma as it had when the December 18th eruption began
Updated 9 January at 13:00 UTC
Seismic activity continues to exhibit a pattern similar to that of recent days. The earthquake activity remains relatively low, primarily centered between Hagafell and Stóra Skógfell, where the center of the intrusion is situated. Additionally, there is ongoing seismic activity in Fagradalsfjall, persisting since December 18th.
Land uplift is still being measured in the Svartsengi area, exhibiting a relatively stable trend since the eruption on December 18th. The accompanying image, marked with red dots representing data from the GPS station SENG in Svartsengi, illustrates this trajectory The recent rate of uplift is approximately 5 mm per day, resulting in a current elevation that is about 5 cm higher than before the eruptions on November 10th and December 18th last year.
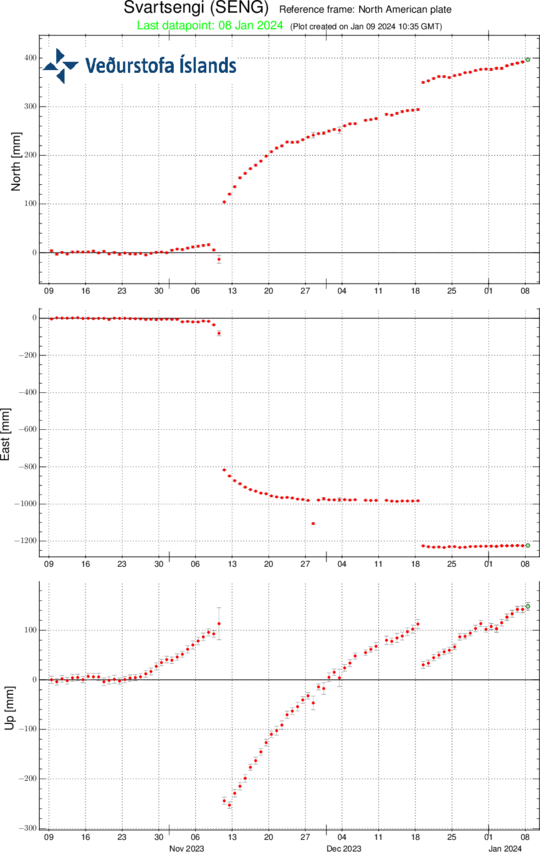
Relative measurements from the GPS station SENG in Svartsengi from the beginning of October 2023 to present, displaying north, east, and vertical components (top, middle, bottom). The bottom curve shows land uplift in millimeters, with today’s measurement indicated by a green dot
Calculations from models relying on deformation measurements (GPS and satellite images) indicate that the amount of magma accumulated in the reservoir beneath Svartsengi has reached a level comparable to the volume that led to the formation of the magma conduit and the subsequent eruption on December 18th last year. This suggests that there is an increased risk of an eruption in the coming days.
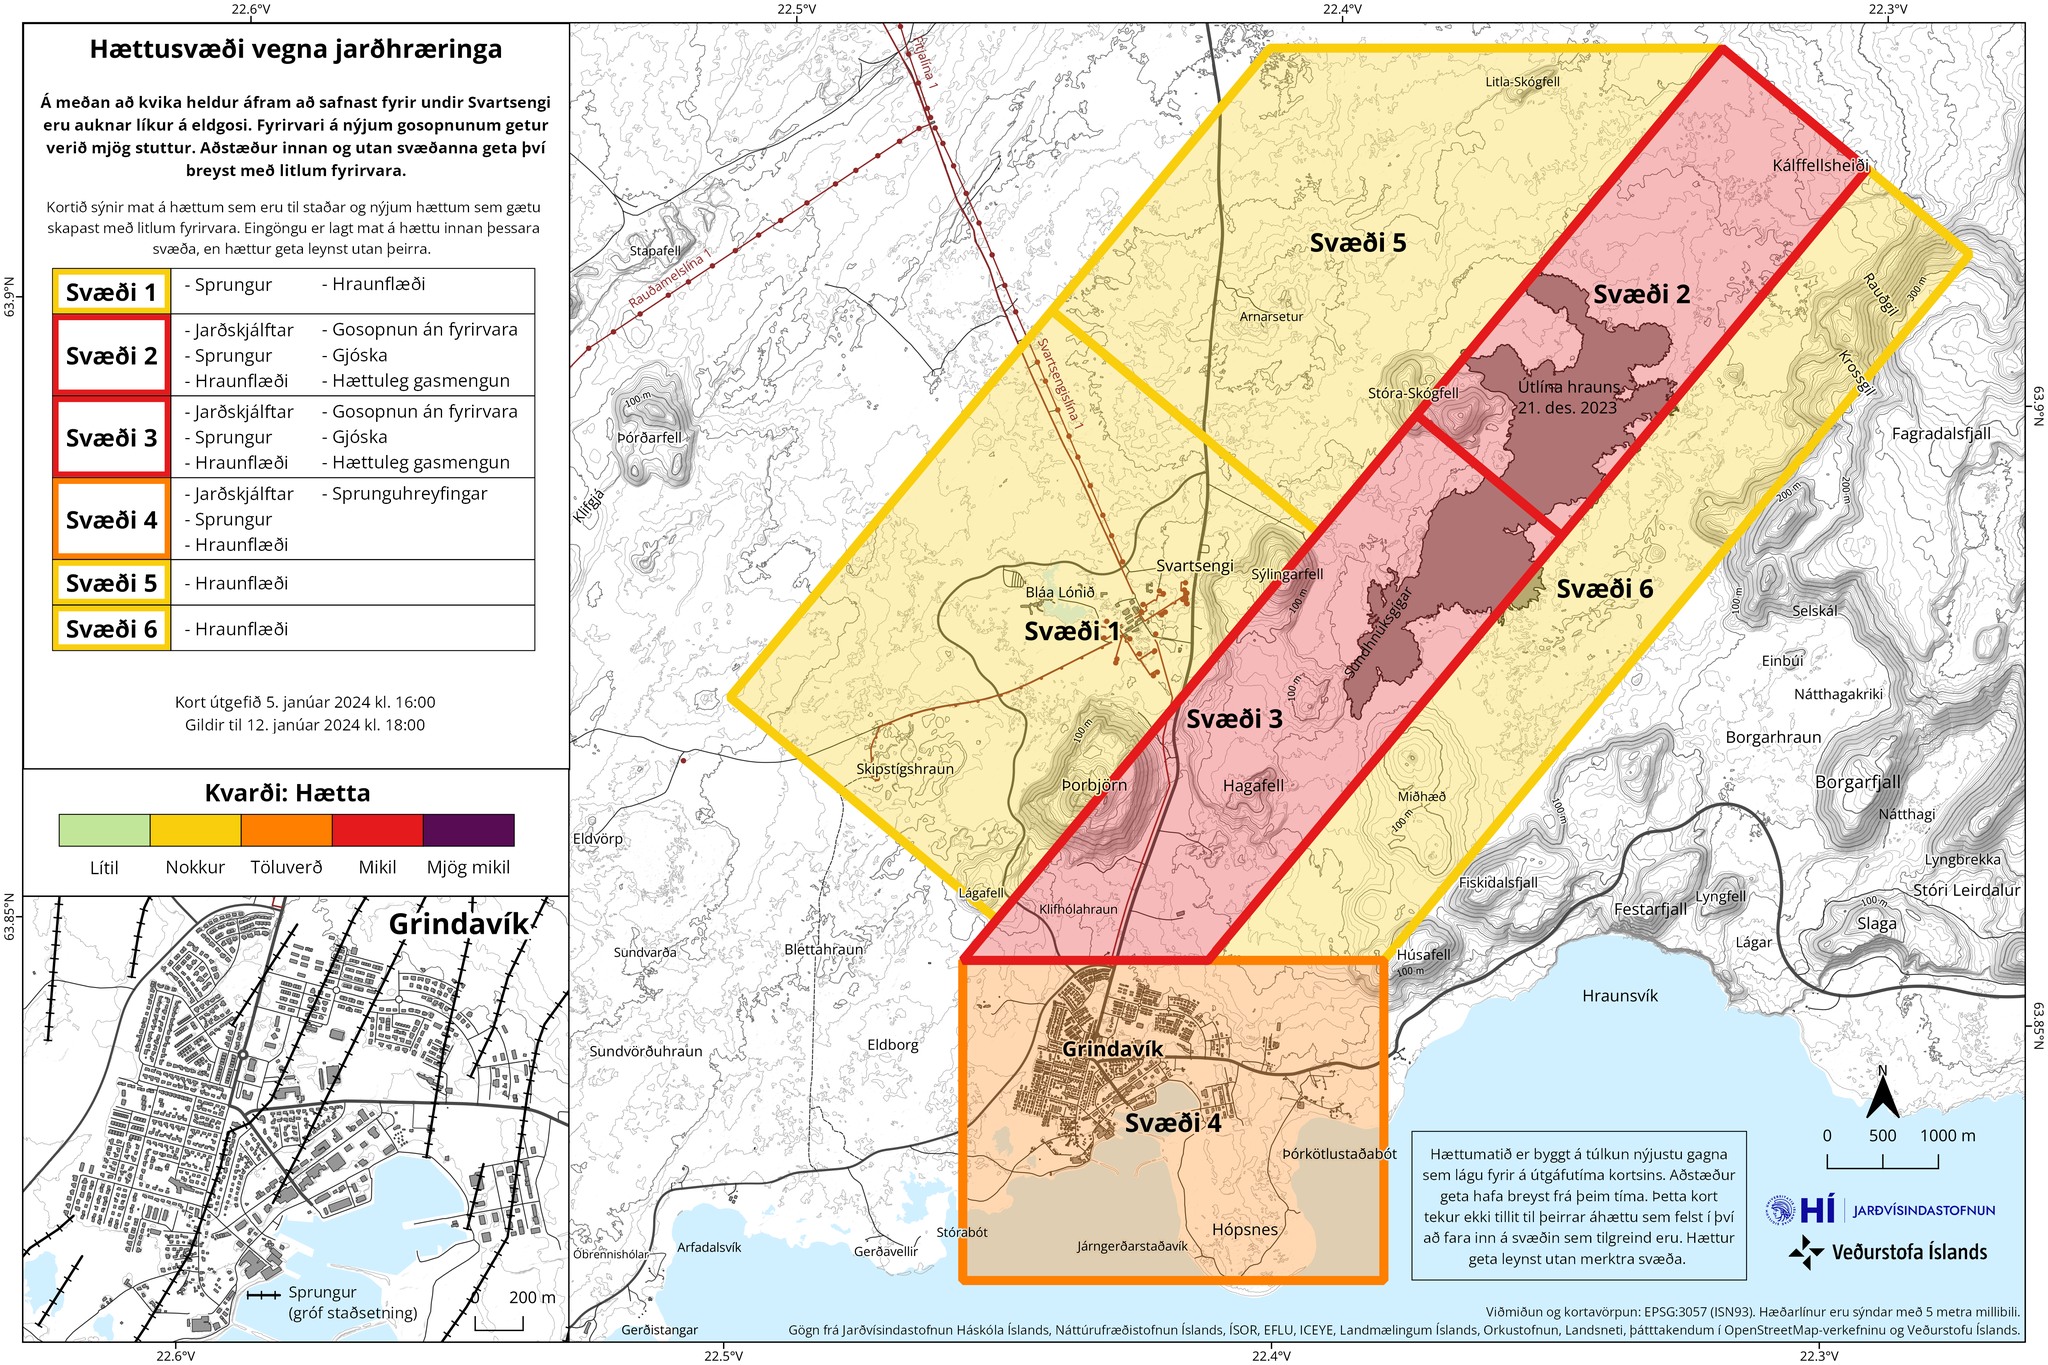
The Icelandic Meteorological Office issued an updated hazard map on January 5th, and it will be reassessed on January 12th.
Source et photos : IMO.
Italy , Stromboli :
WEEKLY NEWSLETTER. from January 1, 2024 to January 7, 2024. (issue date January 9, 2024)
SUMMARY STATEMENT OF ACTIVITY
In light of the monitoring data, it appears:
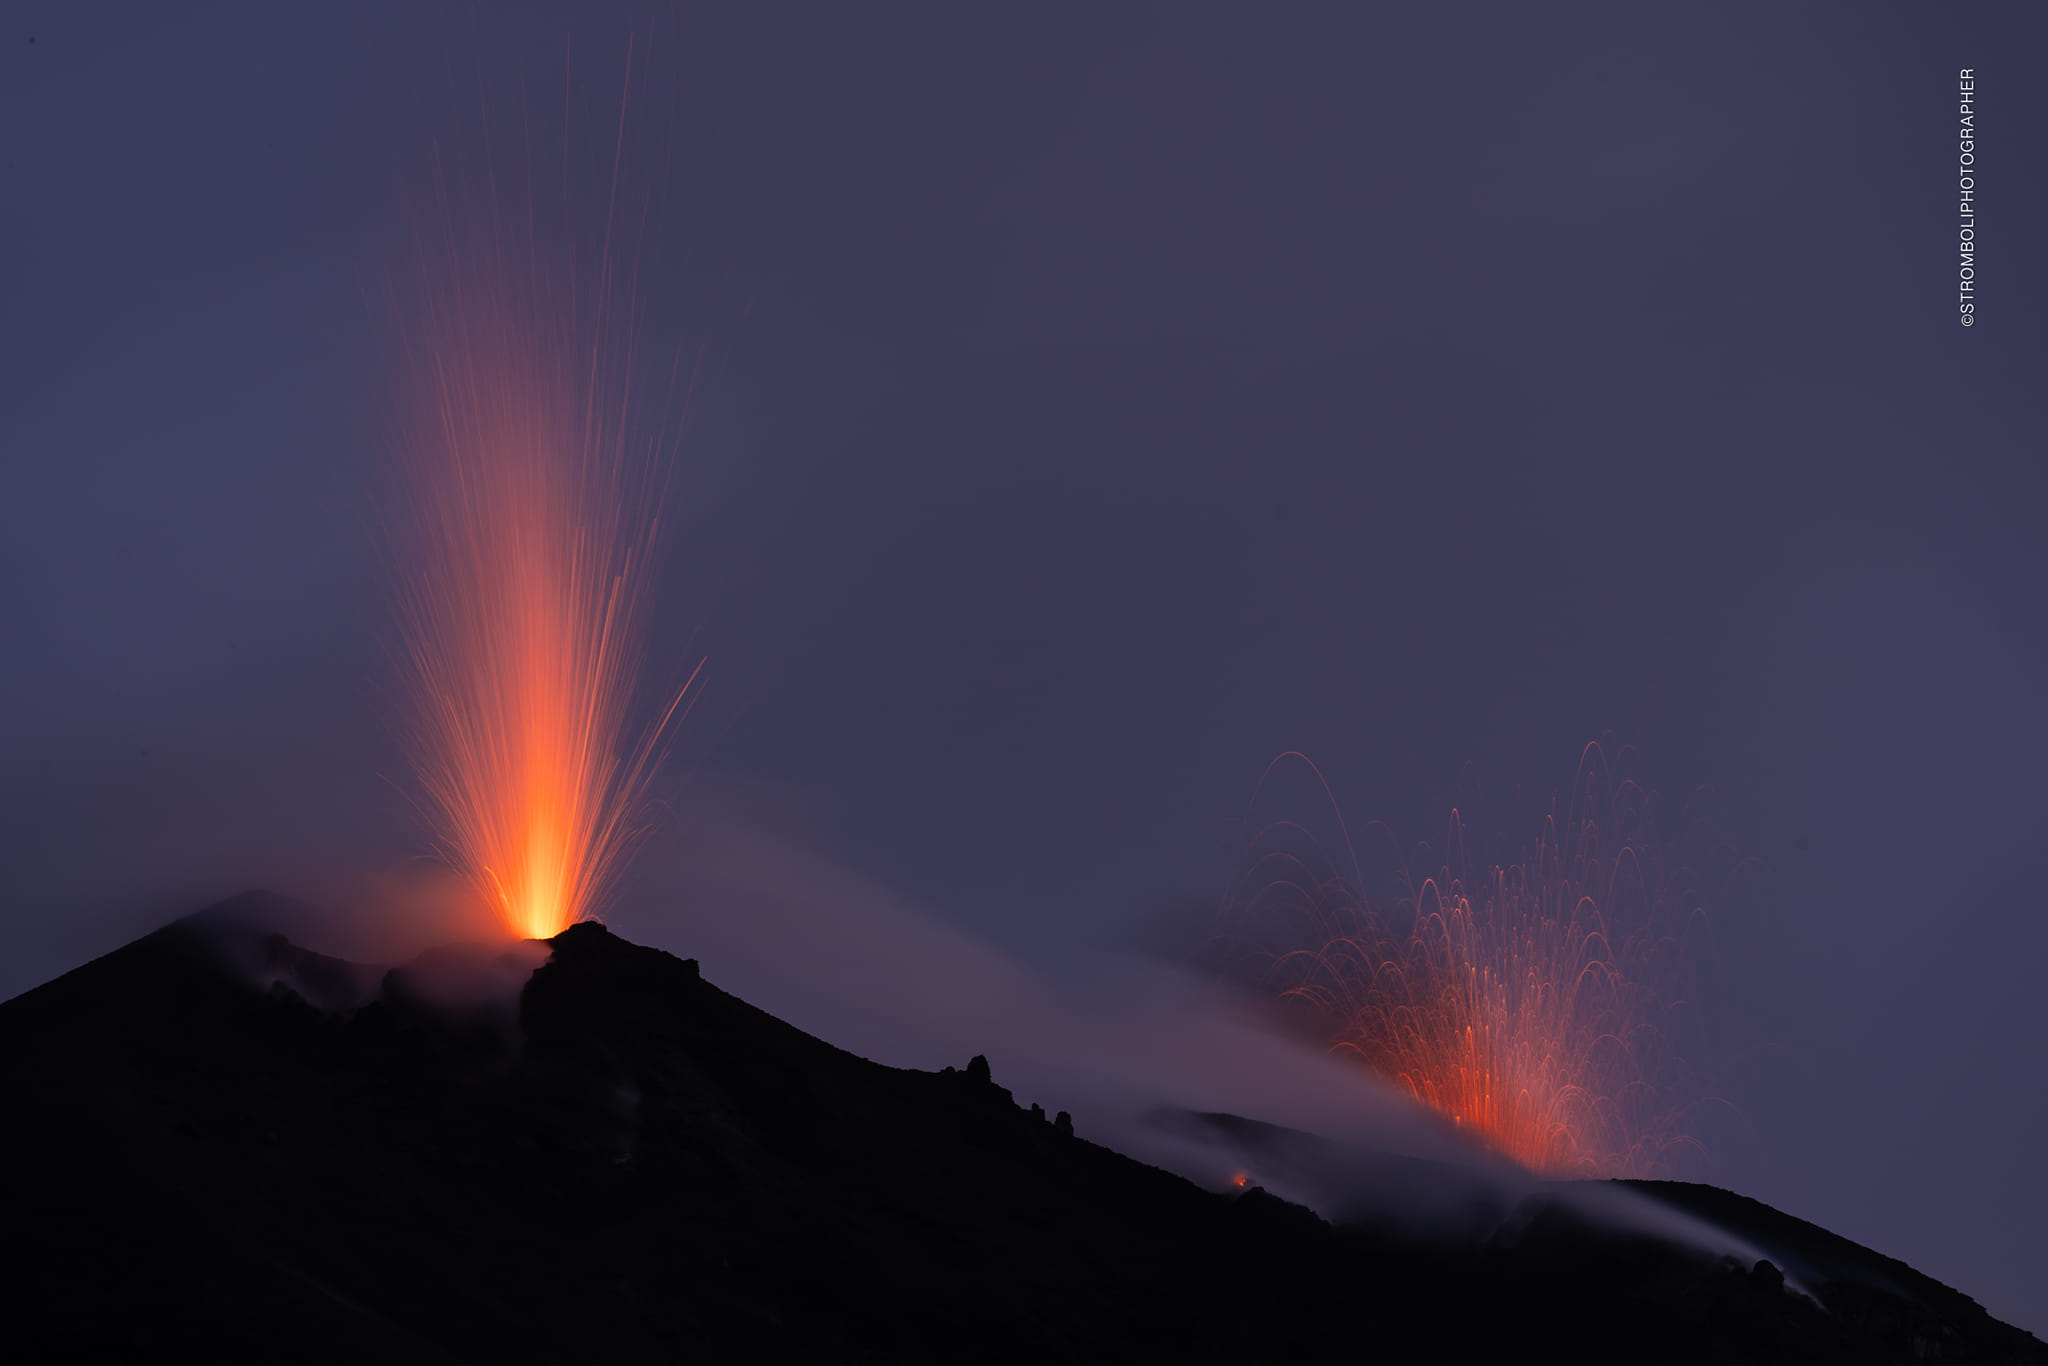
1) VOLCANOLOGICAL OBSERVATIONS: Normal Strombolian activity was observed during this period. The total hourly frequency fluctuated between medium (11 events/h) and high (18 events/h) values.
The intensity of the explosions was low in the North Crater area and variable from low to high in the South Central area.
2) SISMOLOGY: The monitored seismological parameters do not show significant variations.
3) GROUND DEFORMATIONS: The island’s ground deformation monitoring networks showed no significant changes to report for the period under review.
4) GEOCHEMISTRY: SO2 flux at medium level
CO2 flux in the summit zone: reached very high values at the start of last week, but quickly returned to average values in recent days.
C/S ratio in the plume: there are no updates.
Helium Isotope Ratio in Thermal Aquifer: There are no updates.
CO2 flux in Scari: stable data at average values.
5) SATELLITE OBSERVATIONS: Thermal activity observed by satellite was generally low level with rare and isolated anomalies of moderate level.
VOLCANOLOGICAL OBSERVATIONS
During the observed period, the eruptive activity of Stromboli was characterized through the analysis of images recorded by the INGV-OE surveillance cameras at 190 m (SCT-SCV) and
Point dei Corvi (SPCT). The explosive activity was mainly produced by 2 (two) eruptive vents located in the North zone of the crater and by 1 (one) vent located in the South Central zone.
It should be noted that as of 12:59:41 UTC on January 6, the SCT and SCV cameras stopped taking images and the only camera that was functioning was the SPCT.
Observations of explosive activity captured by surveillance cameras
In the area of the North crater (N), with a mouth located in sector N1 and a mouth located in sector N2, low intensity explosive activity (less than 80 m in height) was observed. The products emitted in the eruption were mainly coarse materials (bombs and lapilli). The average frequency of explosions fluctuated between 9 and 15 events/h.
In the Central-South (CS) zone, sectors S1 and C did not show significant activity while in sector S2 the explosions showed variable intensity from low to high (more than 150 m in height) with emission of coarse materials mixed with fine materials. The average frequency of explosions varied from minus 1 to 4 events/h.
Source : INGV.
Photo : Stromboli stati d’animo / Sebastiano Cannavo.
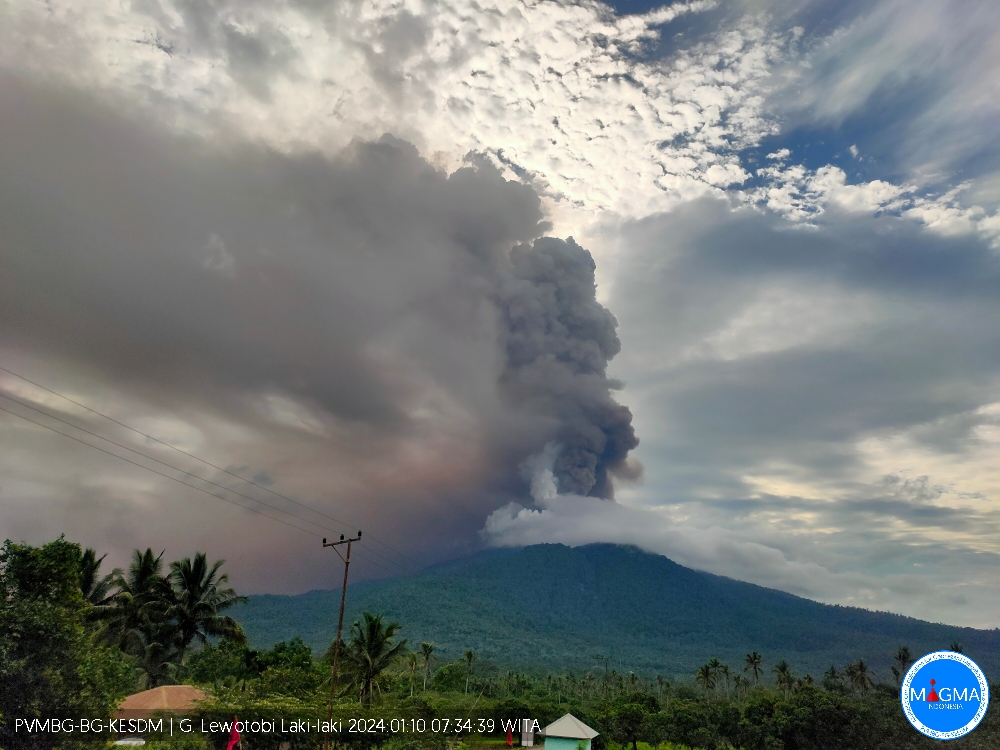
Indonesia , Lewotobi Laki-Laki :
Increased activity level of G. Lewotobi Laki Laki from level III (SIAGA) to level IV (AWAS).
The results of the evaluation of the activities of G. Lewotobi Male for the period January 1 to 9, 2024 are presented below as follows:
I. Visual observation
The volcano is clearly visible until it is covered in fog. White, gray and brown smoke is observed coming from the main crater, of medium to thick intensity at a height of approximately 300 to 1,500 meters from the summit. An eruption occurred at 1000-1500 meters altitude above the summit, the ash column from the eruption was gray in color. an avalanche was observed with a sliding distance of 300 meters from the summit, and the sliding direction was from north to northwest.
II. Instrumental observation
Seismicity recorded between January 1 and 9, 2024:
1 avalanche earthquake
90 emissions earthquake.
1 Low frequency earthquake.
45 Shallow volcanic earthquakes.
150 deep volcanic earthquakes.
4 local tectonic earthquakes.
14 distant tectonic earthquakes.
5 continuous tremors.
III. Assessment and recommendations
Visually, from January 1 to 9, 2024, shows that the volcanic activity of Mount Lewotobi Laki presents an increase in the maximum height of the eruptive column of 1,500 m from the center of the eruption which is located in the North- West crater of Mount Lewotobi Laki. Incandescences were observed as well as ejections of incandescent material at the summit as well as lava flows in the West – North – West oriented fractures of the summit.
The continued eruption of G Lewotobi indicates that activity is still high.
Continuous tremors tend to increase in amplitude, indicating an increase in the energy of the eruption.
Based on the results of visual and instrumental monitoring, it shows that there has been an increase in volcanic activity on the G Lewotobi Laki Laki, so that the level of activity has been elevated from level III (SIAGA ) at level IV (AWAS). ), from January 9, 2024 at 11:00 p.m. WITA:
– Communities around Mount Lewotobi Laki and visitors/tourists do not carry out any activities within a radius of 4 km around the center of the eruption of Mount Lewotobi Laki and in the sector of 5 km in the West – North – West direction .
– Communities around Mount Lewotobi Laki are wary of the risk of lahar flooding in the rivers that originate at the summit of G Lewotobi in the event of heavy rains.
G. Lewotobi’s activity level will be reassessed periodically or if there is a significant change in his activity. The activity level is considered constant if the next assessment has not been issued.
Source et photo : PVMBG.
Colombia , Purace :
Weekly bulletin of the activity of the Puracé volcano – Los Coconucos volcanic chain
Monitoring the activity of the PURACE VOLCANO – LOS COCONUCOS VOLCANIC CHAIN, the MINISTRY OF MINES AND ENERGY, through the COLOMBIAN GEOLOGICAL SERVICE (SGC)
reports:
During the week of January 2 to 8, 2024, the occurrence values of seismic events increased. On January 5, an increase was recorded mainly associated with the movement of fluids in volcanic conduits, earthquakes located less than 2 km deep under the crater of the Puracé volcano, of low magnitudes. For this reason, variations above the historical average in seismic activity have persisted.
Likewise, localized deformations continued to be recorded between the Puracé and Curiquinga volcanoes. Momentary increases in degassing from the crater area were evident. Measured carbon dioxide (CO2) values showed significant increases throughout the period. On the other hand, stable values were recorded in the sulfur dioxide (SO2) flux.
The images obtained using the installed cameras show that high degassing of the volcanic system is maintained, both inside the crater and in the external lateral fumarole (northwest flank of the volcanic edifice).
The other parameters measured and used for the diagnosis of volcanic activity showed no notable changes during the period evaluated.
The alert status for volcanic activity remains at: YELLOW ALERT: ACTIVE VOLCANO WITH CHANGES IN THE BEHAVIOR OF THE BASE LEVEL OF MONITORED PARAMETERS AND OTHER MANIFESTATIONS.
Source : SGC