February 21 , 2020 .
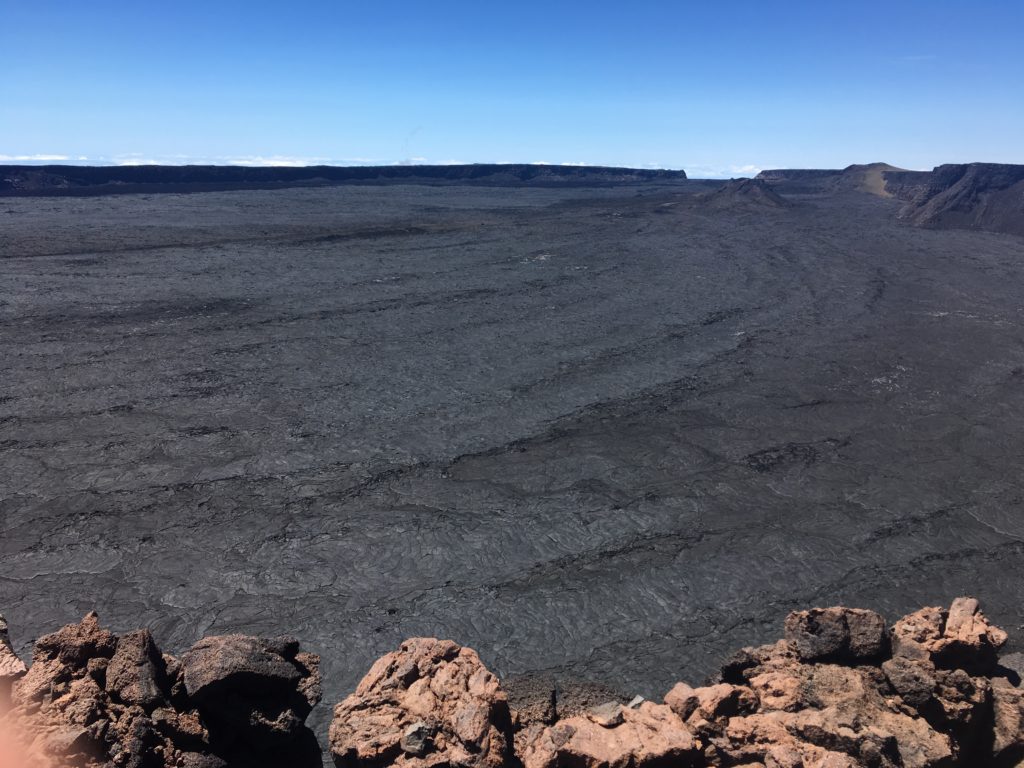
Hawaii , Mauna Loa :
19°28’30 » N 155°36’29 » W,
Summit Elevation 13681 ft (4170 m)
Current Volcano Alert Level: ADVISORY
Current Aviation Color Code: YELLOW
Activity Summary:
Mauna Loa Volcano is not erupting. Rates of deformation and seismicity have not changed significantly over the past week and remain above long-term background levels.
Data from the European Space Agency (ESA) Sentinel-1A and Sentinel-1B satellites on March 31, 2019, and January 31, 2020, produced this interferogram. Each fringe, or band of colors, represents 2.83 cm (1.1 inches) of range change—the distance between the satellite and the ground. Counting fringes gives the total range change between two satellite passes. At point (A) the ground moved closer to the satellite by 7 cm (2.75 in) between the two passes due to inflation of the shallow magma chamber beneath Mauna Loa’s summit. The angle at which the satellites viewed the ground shifted the signal slightly east of the summit. Fringes near point (B) at the summit of Kīlauea reflect inflation of the shallow Halema‘uma‘u magma chamber. This inflation has been observed since mid-March 2019, with a total range change of approximately 40 cm (15.7 in). Point (C) is on the middle East Rift Zone near Pu‘u ‘Ō‘ō. Interferograms and GPS data show that inflation has slowly shifted toward Pu‘u ‘Ō‘ō in recent months, during which the range change has been about 17 cm (6.7 in). Speckled areas with no visible fringes are covered by dense vegetation that prevents radar from reaching the ground. Atmospheric water vapor can also affect the radar and is responsible for the circular fringes around Mauna Kea and mottled or linear patterns elsewhere. These signals show that magma is entering the shallow storage system. However these data, together with seismicity and SO2 emission rates do not suggest an imminent eruption.
Observations:
During the past week, HVO seismometers recorded 44 small-magnitude earthquakes beneath the volcano’s upper elevations. The strongest was a magnitude-2.2 event on 16 February, at approximately 7 kilometers (~4 miles) below the surface. Most events occurred at shallow depths of less than 5 kilometers (~3 miles) beneath the surface of the volcano.
Global Positioning System (GPS) measurements show continued slow summit inflation, consistent with magma supply to the volcano’s shallow storage system.
Gas concentrations at the Sulphur Cone monitoring site on the Southwest Rift Zone remain stable. Fumarole temperatures as measured at both Sulphur Cone and the summit have not changed significantly.
Source : HVO.
Photos : HVO.
Italy , Campi Flegrei :
Weekly bulletin 11/02/2020 – 18/02/2020. (Updated February 18, 2020 at 12:00 p.m. local time)
SUMMARY STATEMENT OF ACTIVITY.
In light of the data:
1) Seismology: During the last week, in the Campi Flegrei were recorded 4 earthquakes of low amplitude (Mdmax = 0.1).
2) Deformation: The average value of the uplift of about 0.7 cm / month since July 2017 in the zone of maximum deformation showed an increase in the weeks between the end of November and the beginning of December, then returned to the usual average values after the swarm of December 6. The lift recorded at the RITE GPS station has been approximately 60 cm since January 2011.
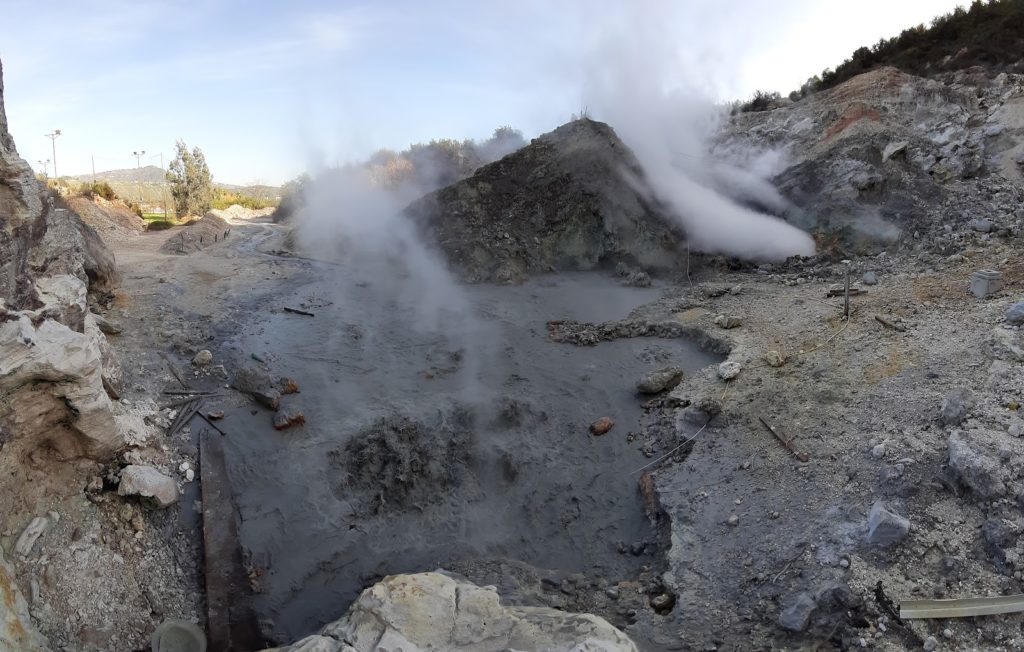
3) Geochemistry: The flow of CO2 from the ground measured last week did not show any significant change compared to the previous period, which confirms the persistence of the long-term trend; last week, the temperature of the main fumarole of Pisciarelli showed an average value of around 115 ° C.
Seismology:
During the past seven days in Campi Flegrei, 4 small earthquakes (Md ≤ -0.5 ≤ 0.1) have been recorded. It was only possible to determine the hypocenter parameters for one of the recorded events.
Source : INGV Vulcani .
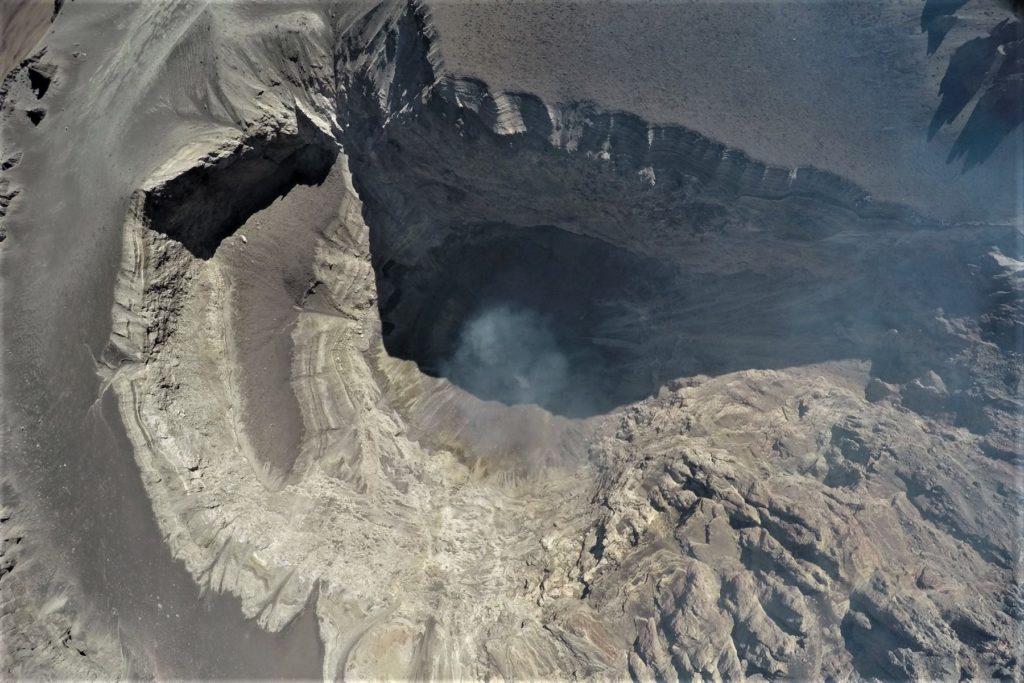
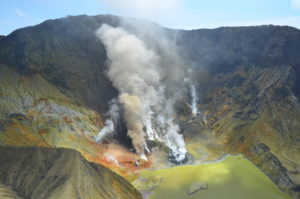
Photo : Pisciarelli , Tullio Ricci, décembre 2019.
Read the entire article: http://www.ov.ingv.it/ov/bollettini-campi-flegrei/Bollettino_Flegrei_2020_02_18.pdf
Chile , Nevados de Chillan :
Volcanic Activity Report (RAV) Volcanological Observatory of the South Andes – Ovdas
Ñuble Region, Nevados de Chillán Volcanic Complex
Seismic activity:
Over the past 24 hours, the instrumental surveillance network of the Nevados de Chillán Volcanic Complex has continued to record volcano-tectonic (VT) seismicity, episodes of long period type events (LP) and tremors ( TR).
Observations:
The highest energy earthquake VT was located 2.3 km south-south-east of the active crater, at an approximate depth of 4 km.
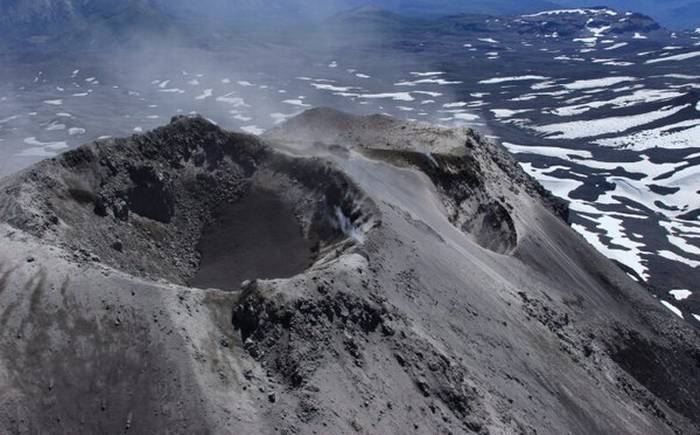
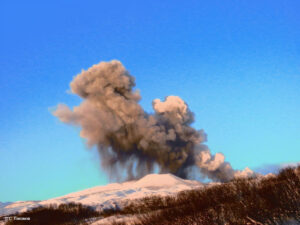
During the day, episodes of pulsatile emission with whitish and greyish gases were observed, probably influenced by the presence of fine to very fine particles. An explosion was highlighted at 7:24 p.m. local time on February 19, with a column height close to 2 km and a low seismic energy which did not exceed 15 cm2.
Other remarks:
– The infrasound sensors did not record acoustic signals of volcanic origin.
– The MIROVA group has not reported any thermal anomalies.
– The network of GNSS stations which makes it possible to measure the deformation of the Nevados Volcanic Complex of Chillán, continues to register an inflationary process, evidenced by the lengthening of the control lines which cross the active crater and the elevation of the 5 monitoring stations . The highest vertical rise is recorded at stations located southwest of the active crater, whose vertical deformation rates have averaged 1.8 ± 0.3 cm / month over the past 30 days. The highest vertical offset recorded is 12.9 ± 0.5 cm. Control line elongation rates have a maximum value of 1.1 ± 0.05 cm / month for the past 30 days.
– Radar interferometry data (InSAR) also shows the deformation recorded by the GNSS network, showing an area of greater elongated deformation, in the same direction of alignment as the volcanic complex, on the southwest flank of the active center , in accordance with the highest vertical elevation area.
Source : Sernageomin .
Photo : Radio universidad de chile.
Iceland , Thorbjorn / Grindavík :
Seismic activity by Grindavík:
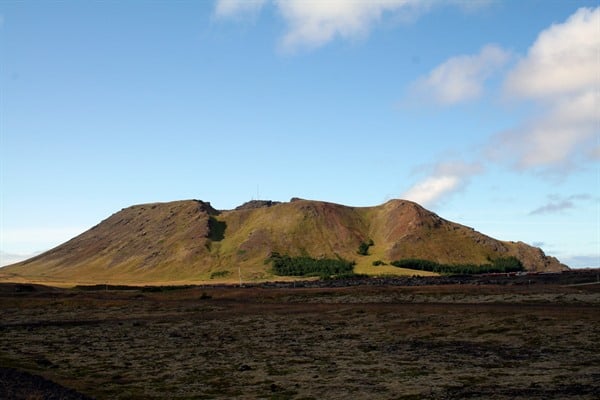
The earthquake activity in the area north of Grindavík is still above average, but less than when it peaked in the end of January.
Indications are that the crustal deformation has decreased but is still ongoing. The next meeting of the scientific council of Civil Protection will be on Tuesday February 25th
Ongoing earthquake activity is measured near Grindavik, around 260 earthquakes were located last week and the largest earthquakes measured M3.2 and M3.1 and were felt nearby. An earthquake swarm started the morning of 15th of February on the southwestern tip of the Reykjanes peninsula, where around 70 earthquakes were detected.
The earthquake swarm on Reykjanes peninsula is ongoing. All the earthquakes are below M3.0.
Yesterday morning (20. 2.20) at 7:20 an earthquake swarm started 10 km N of Gjögurtá (N-Iceland). Over 150 earthquakes have been measured since then, all below M3.0. No reports have been received that the earthquakes have been felt. Earthquakes swarms are not unusual in the area.
Source : Vedur Is.
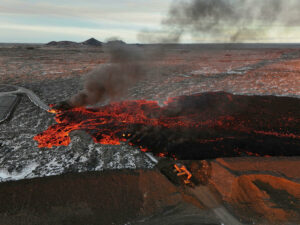
Photo : Visit Reykjanes.
Peru , Ubinas :
Analysis period: February 10-16, 2020. Arequipa, February 17, 2020.
Alert level: ORANGE
The Geophysical Institute of Peru (IGP) reports that the eruptive activity of the Ubinas volcano remains at low levels. To date, the recording of earthquakes associated with the rise of magma to the surface is rare. There are weak and sporadic emissions of bluish gases (of magmatic origin) and water vapor. According to this scenario, the possibility of volcanic explosions and / or ash emissions is low.
During the period from February 10 to 16, 2020, the IGP recorded and analyzed a total of 124 seismic events associated with the dynamic behavior of the Ubinas volcano, with the predominance of seismic signals of the Volcano-Tectonic (VT) type, related to the fracturing of rocks inside the volcano. On average, 12 earthquakes were recorded per day with magnitudes below M2.3. The seismic activity linked to the rise of magma (hybrid type) decreased both in number of events (1 earthquake per day) and in energy.
Visual surveillance, although limited by cloud cover at this time of the year, records slight emissions of volcanic gases and water vapor that have reached maximum heights of 300 m. Monitoring the deformation of the volcanic structure, using GNSS data (processed with fast orbits), does not record any anomalies. MIROVA satellite surveillance did not record any thermal anomalies.
Source et Photo : IGP.


