December 03 , 2019.
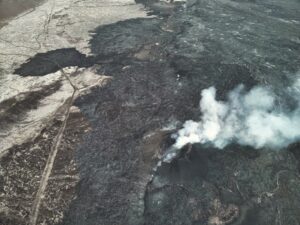
La Réunion , Piton de la Fournaise :
Seismicity:
In November 2019, the OVPF recorded at Piton de La Fournaise: • 27 shallow volcano-tectonic earthquakes (0 to 2 km depth) below the summit craters; • 2 deep earthquakes (>2 km depth); • 269 rockfalls (inside the Cratère Dolomieu or along the cliff of the Enclos Fouqué caldera).
The seismic activity at Piton de la Fournaise in November 2019 was low with a mean of one shallow volcano-tectonic earthquake per day . Two deep earthquakes were also recorded below the eastern flank
Deformation:
The edifice inflation, which had re-started after the end of the October 25-27, 2019 eruption, stopped in mid-November

Gas geochemistry :
CO 2 concentration in the soil
In the far field (Plaine des Cafres and Plaine des Palmistes sectors) : the last year has witnessed the largest soil CO2 flux anomaly detected on distal stations since the network became operational . The period following the eruption on September 15, 2018 was characterized by broadly low to intermediate soil CO2 flux . Since the beginning of September 2019, a new increase of soil CO2 flux has started. After the October 25-27, 2019 eruptive phase, soil CO2 flux keeps increasing, reaching low-intermediate values.
Summit fumaroles composition obtained by the MultiGas method :
Flux close to or below the detection threshold. Since November 11, the MultiGas station is out of service.
Summary :
The month of November 2019 was marked by low seismic activity below the summit craters and no significant summit deformation since mid-November. This indicates no or minor magma influx from deeper zones into the shallow magma feeding system.
Source : OVPF.
Read the article : http://www.ipgp.fr/sites/default/files/ovpf_20191202_bullmensu.pdf
Photo : G Vitton.
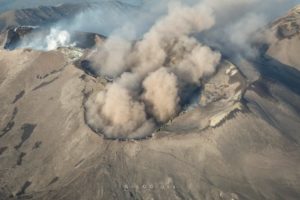
Peru , Ubinas :
Period of analysis: November 25 to December 1, 2019, Arequipa, December 2, 2019.
Alert level: ORANGE.
The Geophysical Institute of Peru (IGP) reports that the eruptive activity of the Ubinas volcano remains low. To date, earthquake energy associated with rising magma at the surface has decreased. There are low and sporadic bluish gas (magmatic) and water vapor emissions observed in the atmosphere. surveillance cameras. Under this scenario, volcanic explosions and / or ash emissions are unlikely to occur.
During the period from 25 November to 1 December, the IGP recorded and analyzed 289 seismic events associated with the eruptive process of the Ubinas volcano, with predominant seismicity of the volcano-tectonic (VT) type related to the fracturing of the rock. inside the volcano. On average, 24 events were recorded per day, all with magnitudes less than M2.2. The seismic signals related to the rise of the magma (hybrid type) have decreased both in number of events (13 earthquakes daily) and energy they generate. It should be noted that no volcanic explosion has been recorded since September 12th.
Surveillance cameras recorded light and sporadic emissions of blue (magmatic) gas and water vapor less than 1,000 m above the top of the volcano. The monitoring of the deformation of the volcanic structure, using GNSS data (processed with fast orbits), does not record anomalies. The MIROVA satellite monitoring also did not record a thermal anomaly on the volcano.
Source et photo : IGP
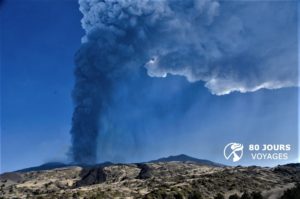
Peru , Sabancaya :
Period of analysis: from November 25 to December 1, 2019. Arequipa, November 2, 2019.
Alert level: ORANGE.
The Geophysical Institute of Peru (IGP) reports that the eruptive activity of the Sabancaya volcano has remained at moderate levels; that is, recording continuous moderate explosions and resulting ash emissions. Therefore, for the following days, no significant change in activity is expected.
The analysis of the recordings obtained from the seismic network of the Sabancaya volcano between 25 November and 1 December 2019 identified the occurrence of about 1320 earthquakes of volcanic origin, the highest percentage being associated with the movements of magmatic fluids. During this period, there was an average of 17 explosions per day of moderate to low intensity.
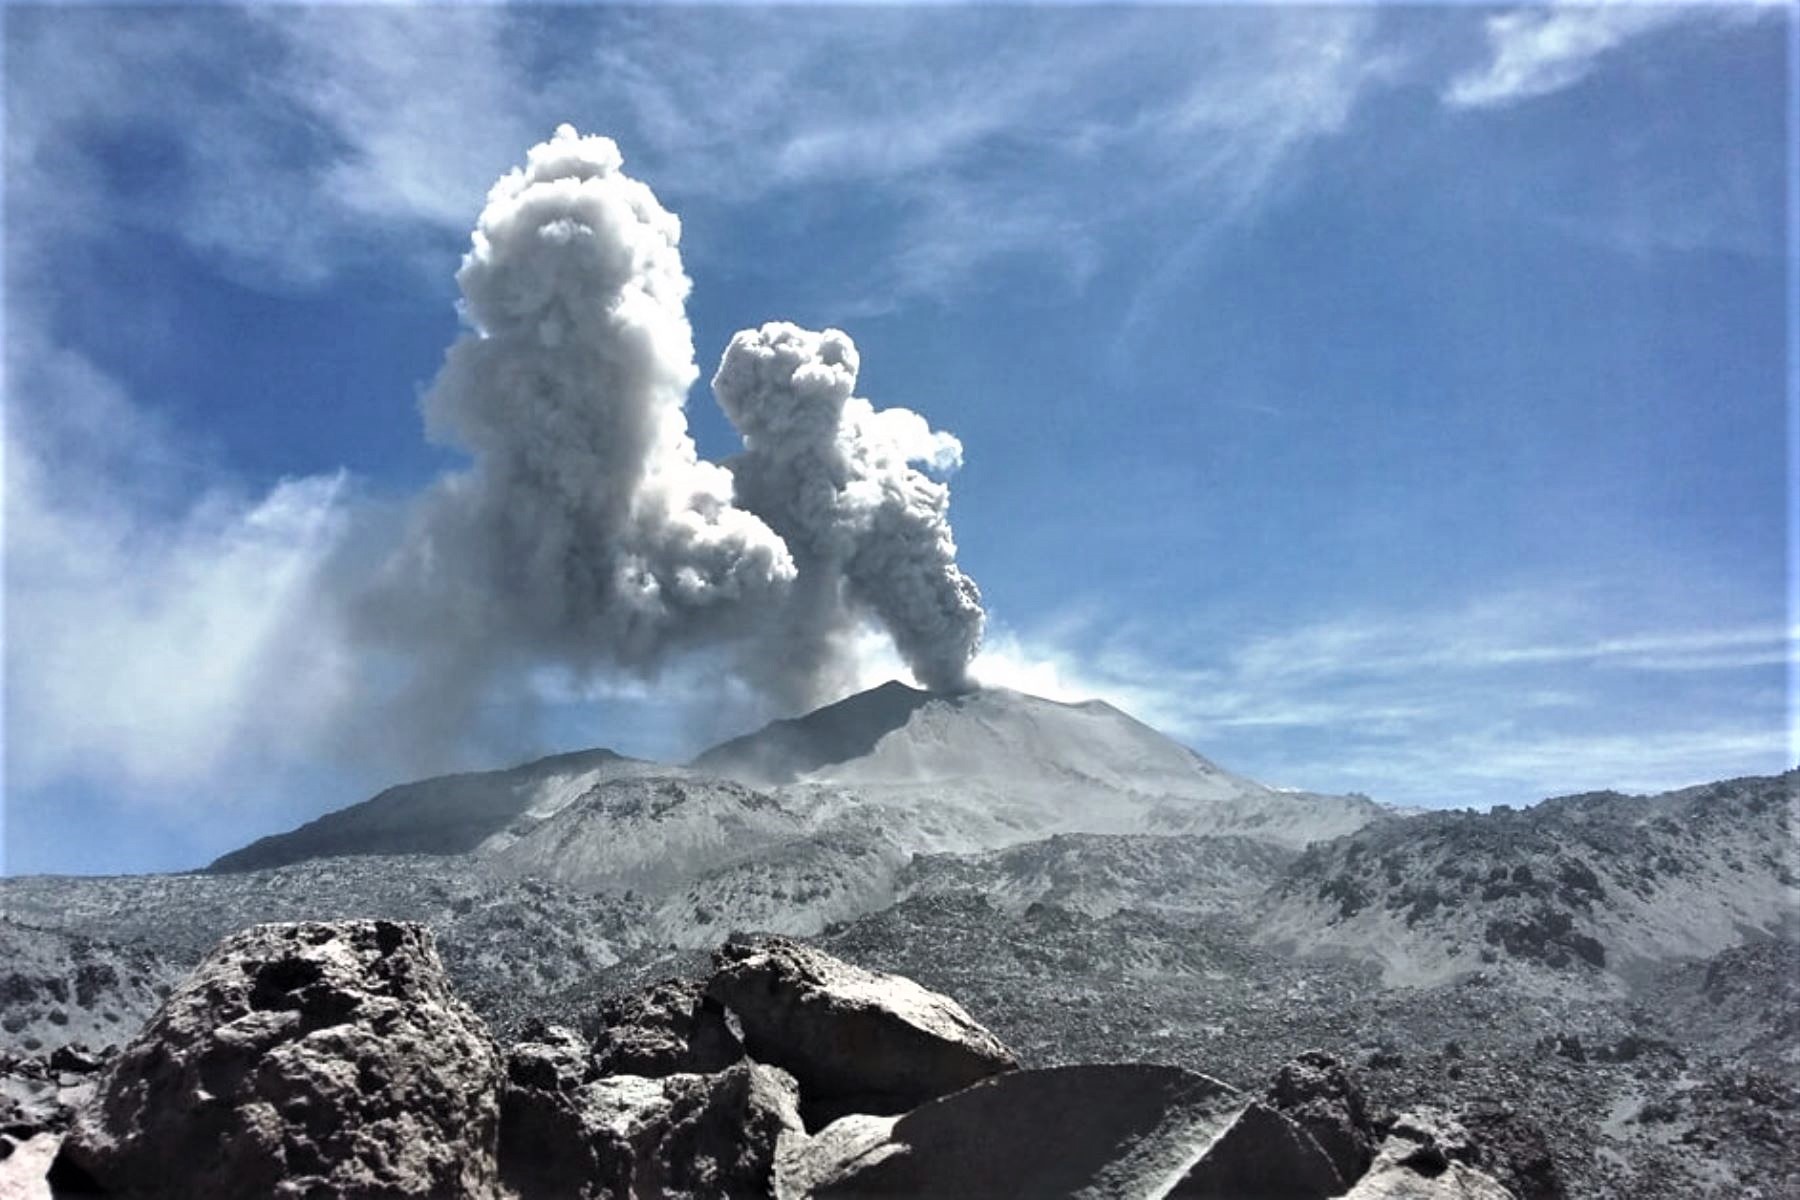
The monitoring of the deformation of the volcanic structure, using GNSS data (processed with fast orbits), does not present significant anomalies. Visual surveillance, using surveillance cameras, allowed us to identify the appearance of columns of gas and ash up to 4 km high above the top of the volcano, which dispersed to the northeast , East and South of Sabancaya. Satellite monitoring has identified 5 volcanic anomalies on the volcano with a value between 6 and 12 MW, associated with the presence of a lava dome in the volcano crater of about 240 m of diameter.
Source : IGP.
Photo : ingemmet.
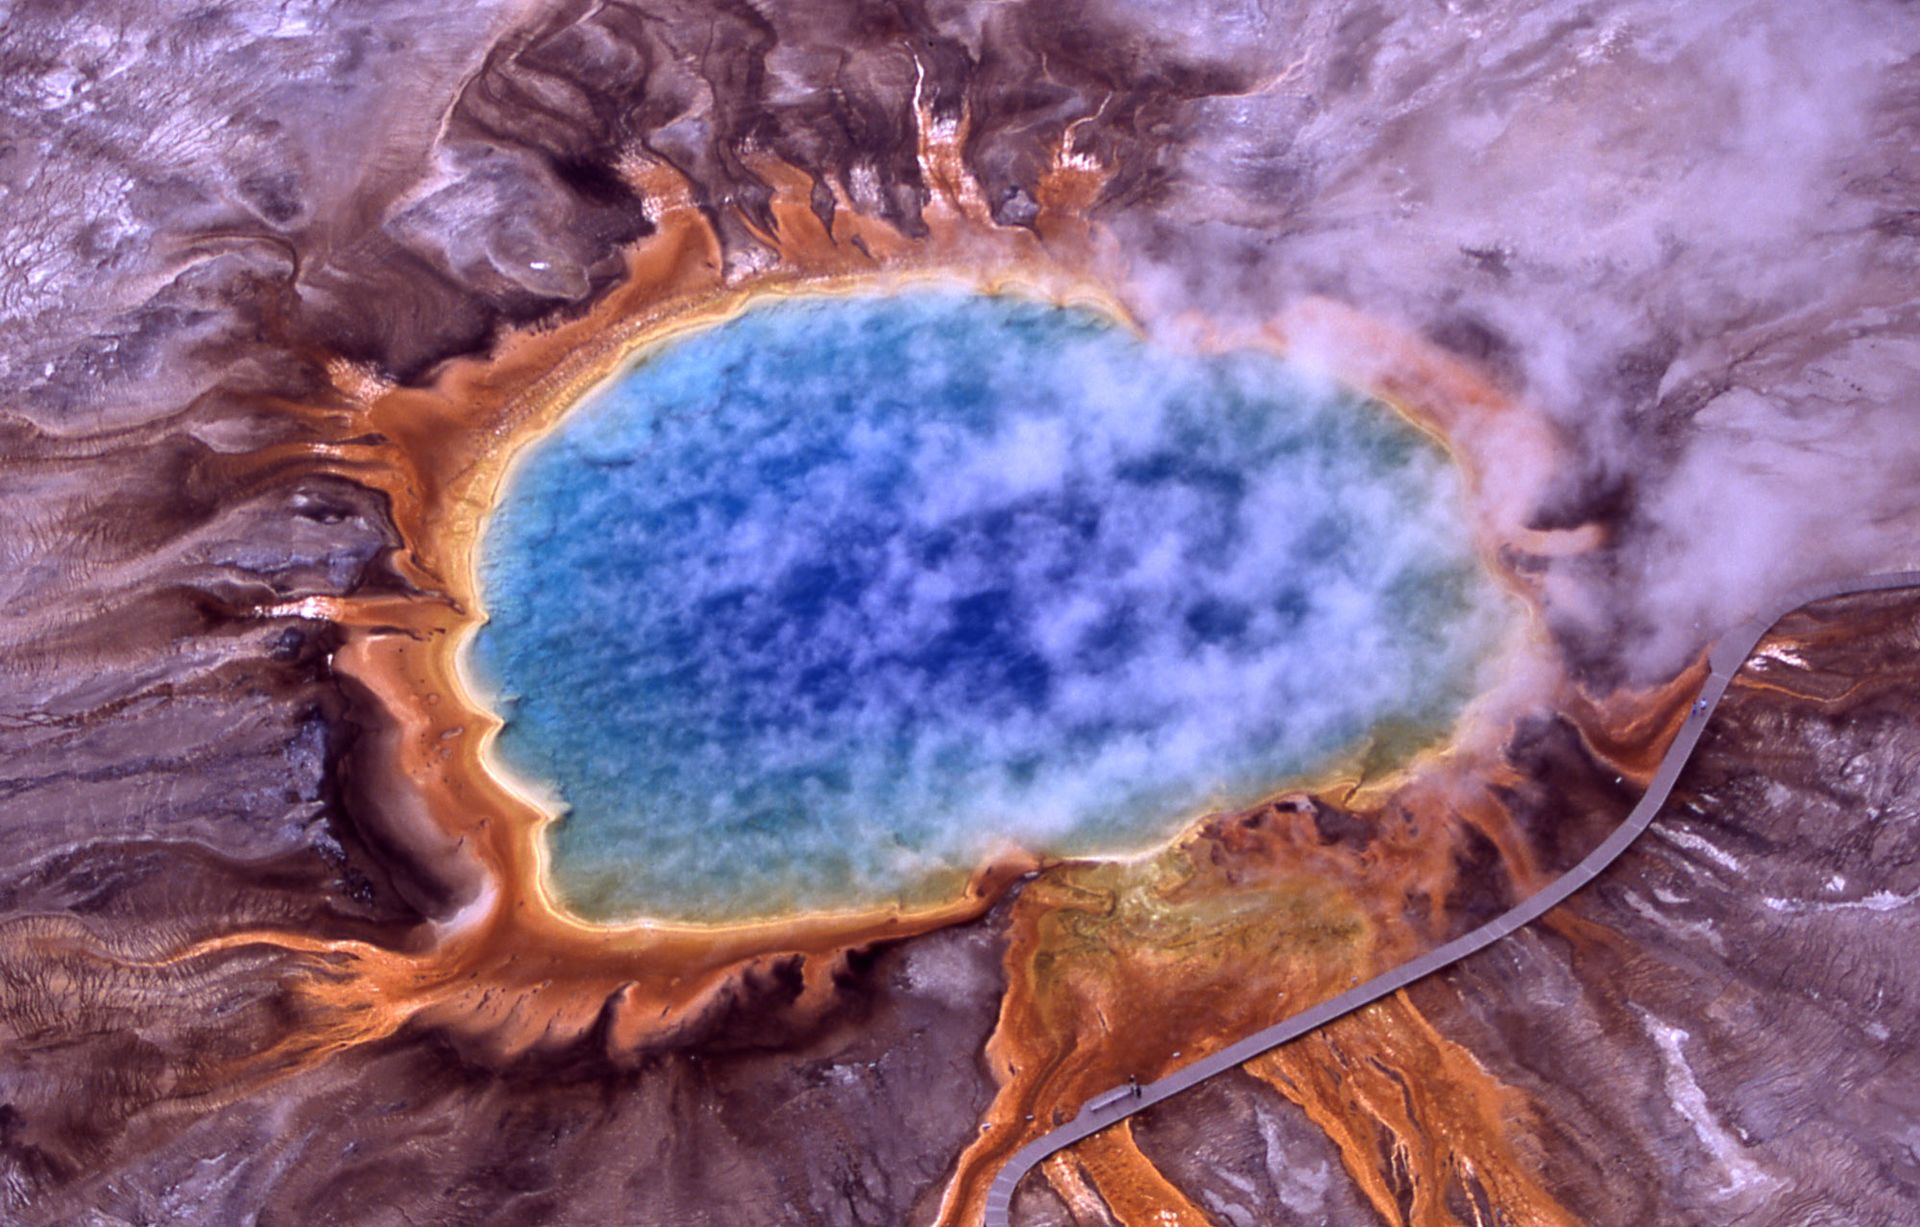
United – States , Yellowstone :
44°25’48 » N 110°40’12 » W,
Summit Elevation 9203 ft (2805 m)
Current Volcano Alert Level: NORMAL
Current Aviation Color Code: GREEN
Recent work and news
There were 3 water eruptions of Steamboat geyser during the month, on November 8, 17, and 27. This brings the total number of eruptions in 2019 to 45.
The Yellowstone Volcano Observatory is pleased to announce the publication of a new information product—an annual report! The report covers calendar year 2017, summarizing activity, including earthquakes and ground deformation, as well as efforts to monitor water and gas chemistry, growth of hot spring terraces as mapped with aerial imagery, research into hydrothermal vents at the bottom of Yellowstone Lake, investigations of past lava flow eruptions, and geyser eruptions.
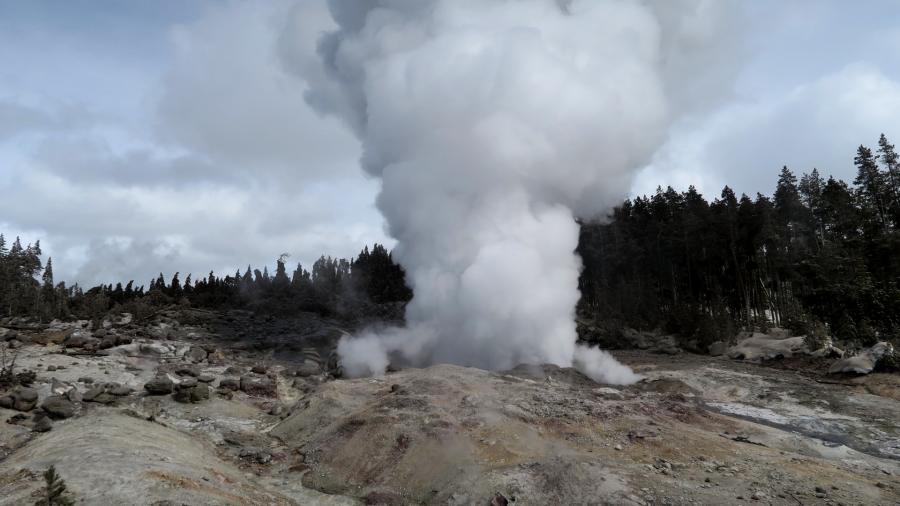
Steamboat geyser in the steam phase of eruption on March 16, 2018. the steam phase usually follows a few- to tens-of-minutes water phase and can last for hours to days. National Park Service photograph by Behnaz Hosseini.
Seismicity
During November 2019, the University of Utah Seismograph Stations, responsible for the operation and analysis of the Yellowstone Seismic Network, located 107 earthquakes in the Yellowstone National Park region. The largest event was a minor earthquake of magnitude 3.1 located 19 miles northwest of West Yellowstone, MT, on November 9 at 6:28 PM MST.
The monthly seismicity in Yellowstone was capped off by the onset of a swarm of earthquakes 2 miles west-northwest of West Thumb, in Yellowstone National Park, on November 30 and continuing into December. The largest November swarm event, a minor earthquake of magnitude 2.1, occurred on November 30 at 1:14 AM (MST).
Earthquake sequences like these are common and account for roughly 50% of the total seismicity in the Yellowstone region.
Yellowstone earthquake activity remains at background levels.
Ground deformation :
Ground deformation in the Yellowstone area has been variable but minor over the last few months. Overall subsidence of Yellowstone caldera is indicated at stations on both the Sour Creek and Mallard Lake resurgent domes, although minor deviations are superimposed on the general trend, perhaps due to seasonal variations from inclement weather. In the area of Norris Geyser Basin, GPS data show subsidence of about 2 cm (less than 1 in) since September, but there was little net motion during the month of November.
Source : YVO.
Photos : Behnaz Hosseini. Jim Peaco, National Park Service .
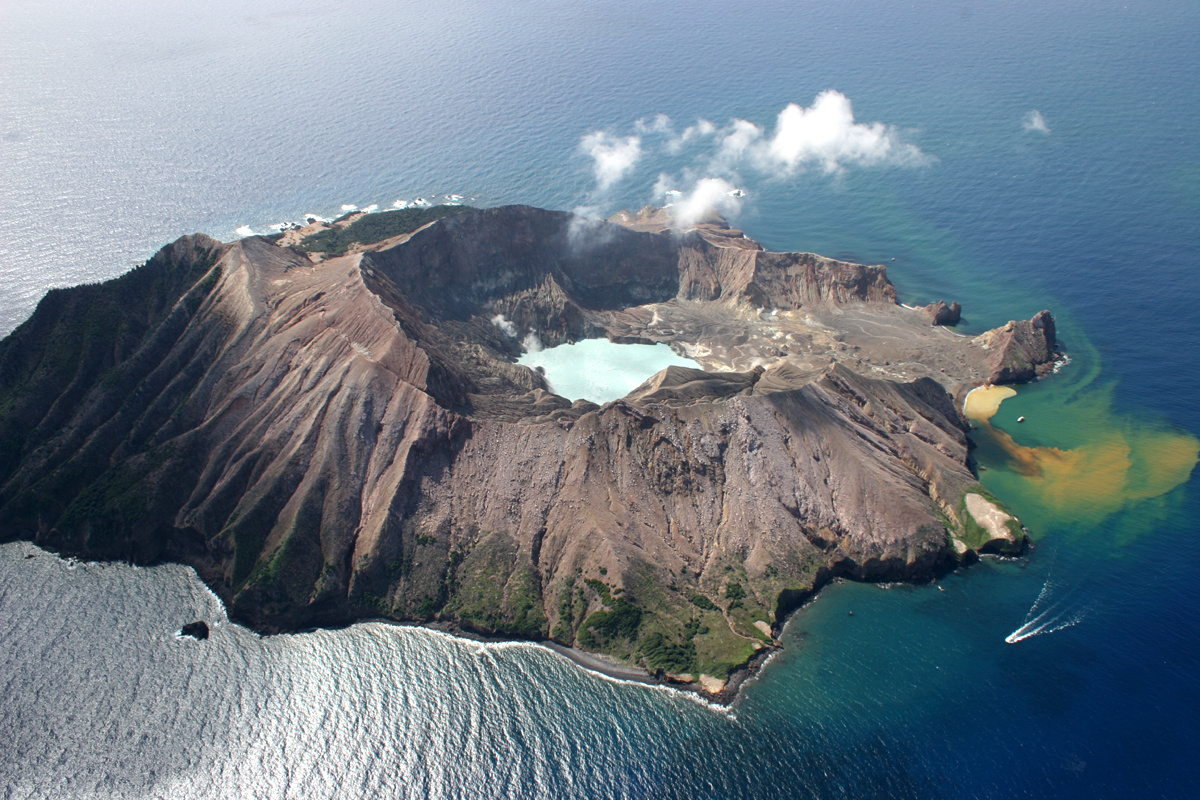
New Zealand , White Island :
Volcanic Alert BulletinWI – 2019/11
Tue Dec 3 2019 1:00 PM; White Island Volcano
Volcanic Alert Level remains at 2
Aviation Colour Code remains at Yellow
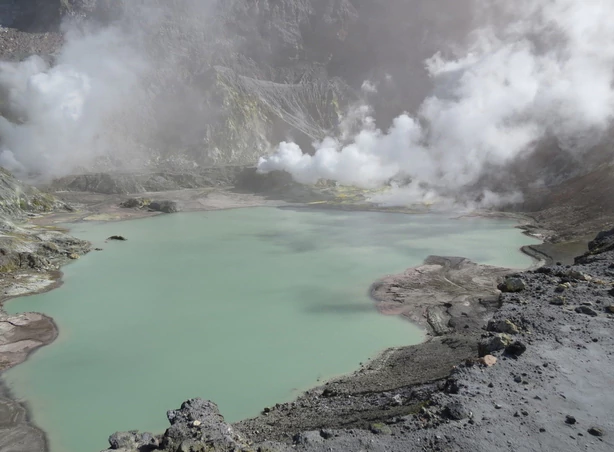
Moderate volcanic unrest continues at Whakaari/White Island, with substantial gas, steam and mud bursts observed at the vent located at the back of the crater lake. Other monitoring parameters remain elevated and the Volcanic Alert Level stays at Level 2.
Explosive gas and steam-driven mud jetting continues from the active vent area at the back of the crater lake on Whakaari/White Island. The level of activity at the vent is variable and when in a stronger phase, some material is being deposited about the vent area. This style of activity has been present since late September, although it is occurring more frequently now. No volcanic ash is being produced.
Volcanic gas emission and seismic activity continue to remain elevated. Occasional gas smell may have been noted on the North Island mainland, pending on the dominant wind direction. Volcanic tremor also remains at moderate levels in the last week, with some periodic variations, matched with episodes of increased gas-steam jetting and fountaining.
The water level of the crater lake has not changed for the last week, and gas/steam-driven mud fountaining activity continues to be observed from the active vent area on the west side of the 1978/90 Crater Complex, near the 2012 lava dome, at the back of the crater lake.
This fountaining is regularly throwing mud and debris 20-30 metres into the air above the vent. The level of activity is variable and remains within the range expected for moderate volcanic unrest. While the activity is contained to the far side of the lake, the current level of activity does not pose a direct hazard to visitors.
Overall, the monitored parameters continue to be in the expected range for moderate volcanic unrest and associated hazards exist. The monitoring observations bear some similarities with those seen during the 2011-2016 period when Whakaari/White Island was more active and stronger volcanic activity occurred. Observations and data to date suggest that the volcano may be entering a period where eruptive activity is more likely than normal.
The Volcanic Alert Level remains at Level 2.
The Aviation Colour Code remains at Yellow.
GNS Science and the National Geohazards Monitoring Centre continues to closely monitor Whakaari/White Island for further signs of activity. Volcanic Alert Level 2 is mostly associated with unrest hazards on the volcano and could include eruptions of steam, gas, mud and rocks. These eruptions can occur with little or no warning.
Source : Geonet / Brad Scott , Duty Volcanologist.
Photos : R Fleming , Geonet .