July 11 , 2025.
United States, Mount Rainier :
CASCADES VOLCANO OBSERVATORY STATUS REPORT , U.S. Geological Survey
Thursday, July 10, 2025, 9:25 AM PDT (Thursday, July 10, 2025, 16:25 UTC)
46°51’11 » N 121°45’36 » W,
Summit Elevation 14409 ft (4392 m)
Current Volcano Alert Level: NORMAL
Current Aviation Color Code: GREEN
This is an update on the ongoing seismic swarm at Mount Rainier that began at 1:29 AM PDT (8:29 UTC) on July 8th.
Seismicity is continuing at low rates. As of 9 AM PDT (16:00 UTC) on July 10th, the Cascades Volcano Observatory (CVO) and the Pacific Northwest Seismic Network (PNSN) have located 334 events since the start of the swarm, although many more have occurred but cannot be located. The largest event of the swarm so far was a magnitude 2.3 on July 8th at 2:56 PM PDT (21:56 UTC). Seismicity has decreased from 26 located events per hour at the swarm’s peak on Tuesday morning to a few events per hour as of Thursday morning. The earthquakes are mainly spread between 1.5-4 miles (2-6 km) beneath the summit. There have been no changes in ground deformation or other monitoring data.
This swarm now surpasses the 2009 swarm in terms of magnitude, total events, event rate, and energy release. The cause of the swarm remains consist with the circulation of fluids along preexisting faults beneath the volcano, which is considered background activity at Mount Rainier. There is currently no indication that the swarm is associated with magmatic unrest.
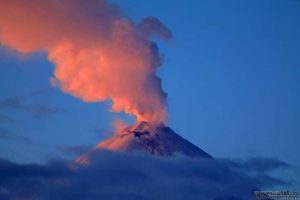
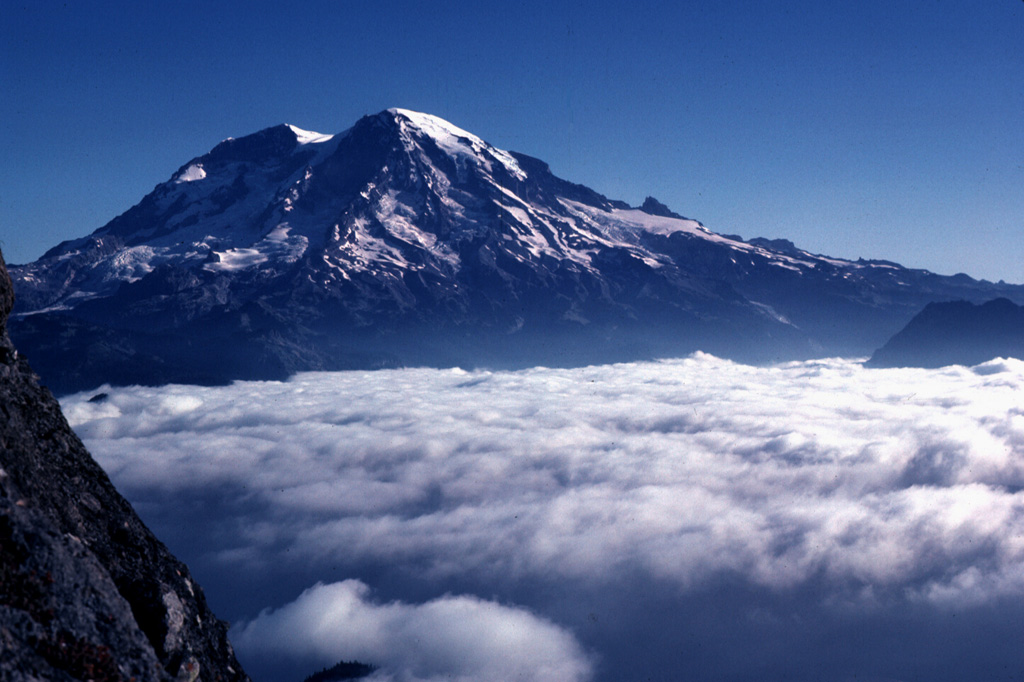
About Mount Rainier
Mount Rainier is an active, ice-clad stratovolcano geographically located within the Mount Rainier National Park. Mount Rainier is located about 45 miles (73 km) southeast of Tacoma and 60 miles (97 km) south-southeast of Seattle in Washington State. It is the tallest peak in the Cascade Range and is covered by the greatest concentration of glaciers in the contiguous United States.
Source : CVO.
Photo : Lee Siebert, 1981 (Smithsonian Institution).
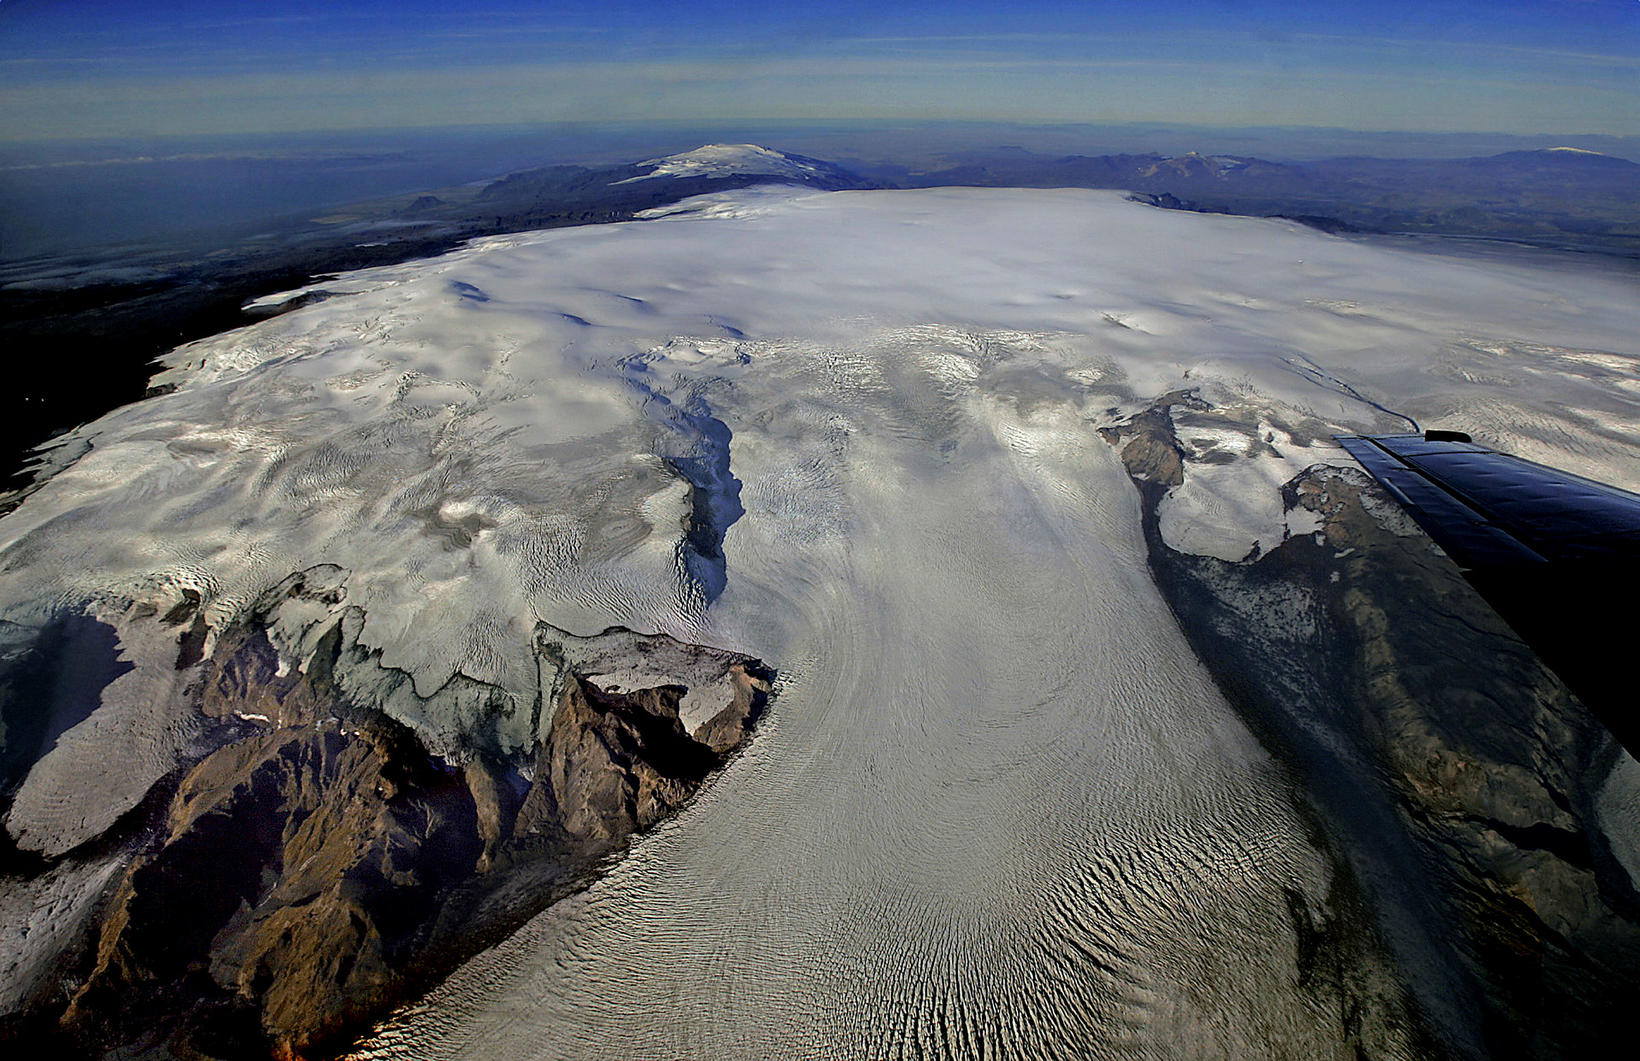
Iceland , Mýrdalsjökull :
Glacial outburst flood from Mýrdalsjökull in Leirá Syðri and Skálm
Electrical conductivity and water levels have risen in Leirá Syðri in recent days, according to measurements from a recently installed monitoring station near Sandfellsjökull. Increased conductivity and water levels have also been detected in readings at the bridge over Skálm on Route 1. This information was reported by the Icelandic Meteorological Office.
Public urged to exercise caution
The event currently qualifies as a small glacial outburst flood ( jökulhlaup ), but both conductivity and water levels continue to rise. The Meteorological Office has received reports of a sulfur smell, and people are therefore advised to be cautious near the river sources, as gas pollution may be present in the area.
Floods of this type are known in the region
A small flood occurred in Leirá Syðri and Skálm in late July last year, followed unexpectedly by a more substantial event that overflowed Route 1 and damaged the road. Such floods from geothermal areas beneath the glacier are well-known in several rivers around Mýrdalsjökull.
The most recent flood of this kind was in December. Since the major flood in July last year, four such events have occurred in the river.
Bergur Einarsson, head of hydrological research at the Icelandic Meteorological Office, says the cause of last year’s large flood is still not fully understood.
Flood still ongoing, water levels rising slowly
The outburst flood from Mýrdalsjökull is still in progress, and water levels in Leirá Syðri and Skálm continued to rise overnight, albeit slowly.
This was confirmed in a statement from the Meteorological Office.
The institution says it will monitor the situation closely throughout the day.
Yesterday’s statement from the Meteorological Office noted that this is a small flood and that water levels and conductivity are gradually increasing. Travelers had reported the smell of sulfur, and the public was advised to be cautious near the river sources due to possible gas emissions
Source et photo : MBL is
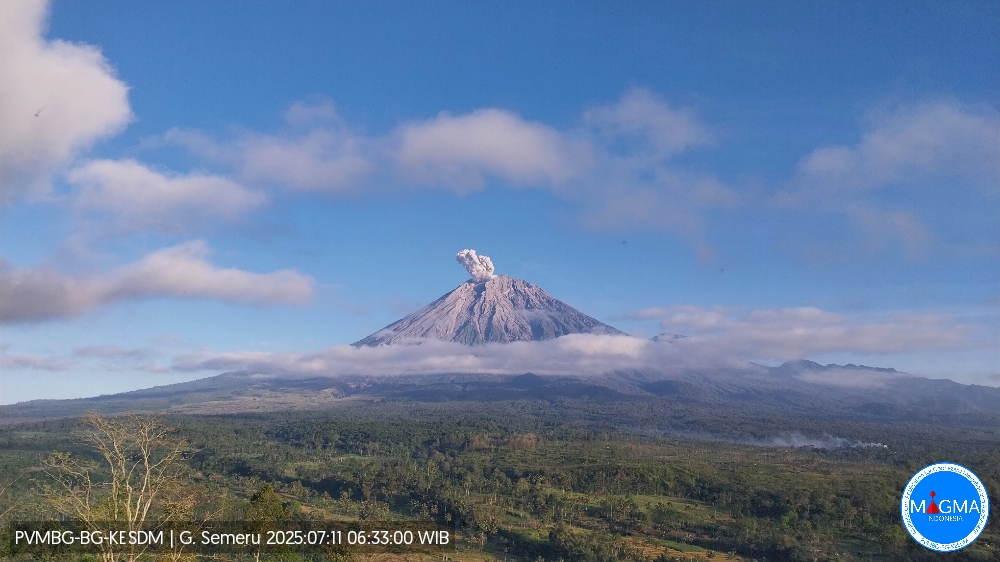
Indonesia , Semeru :
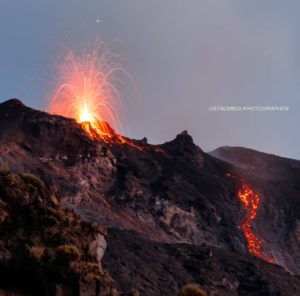
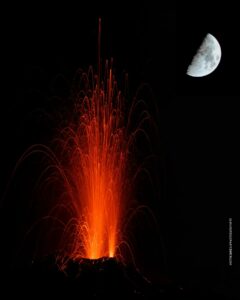
Mount Semeru erupted on Friday, July 11, 2025, at 6:31 a.m. (local time). An ash column was observed about 700 m above the summit (about 4,376 m above sea level). The ash column was gray and of strong intensity, oriented towards the southeast. This eruption was recorded by seismograph with a maximum amplitude of 22 mm and a duration of 126 seconds.
VOLCANO OBSERVATORY NOTICE FOR AVIATION – VONA
Issued : July 11 , 2025
Volcano : Semeru (263300)
Current Aviation Colour Code : ORANGE
Previous Aviation Colour Code : orange
Source : Semeru Volcano Observatory
Notice Number : 2025SMR2443
Volcano Location : S 08 deg 06 min 29 sec E 112 deg 55 min 12 sec
Area : East java, Indonesia
Summit Elevation : 11763 FT (3676 M)
Volcanic Activity Summary :
Eruption with volcanic ash cloud at 23h31 UTC (06h31 local).
Volcanic Cloud Height :
Best estimate of ash-cloud top is around 14003 FT (4376 M) above sea level or 2240 FT (700 M) above summit. May be higher than what can be observed clearly. Source of height data: ground observer.
Other Volcanic Cloud Information :
Ash cloud moving to southeast. Volcanic ash is observed to be gray. The intensity of volcanic ash is observed to be thick.
Remarks :
Eruption recorded on seismogram with maximum amplitude 22 mm and maximum duration 126 second.
Source et photo : Magma Indonésie .
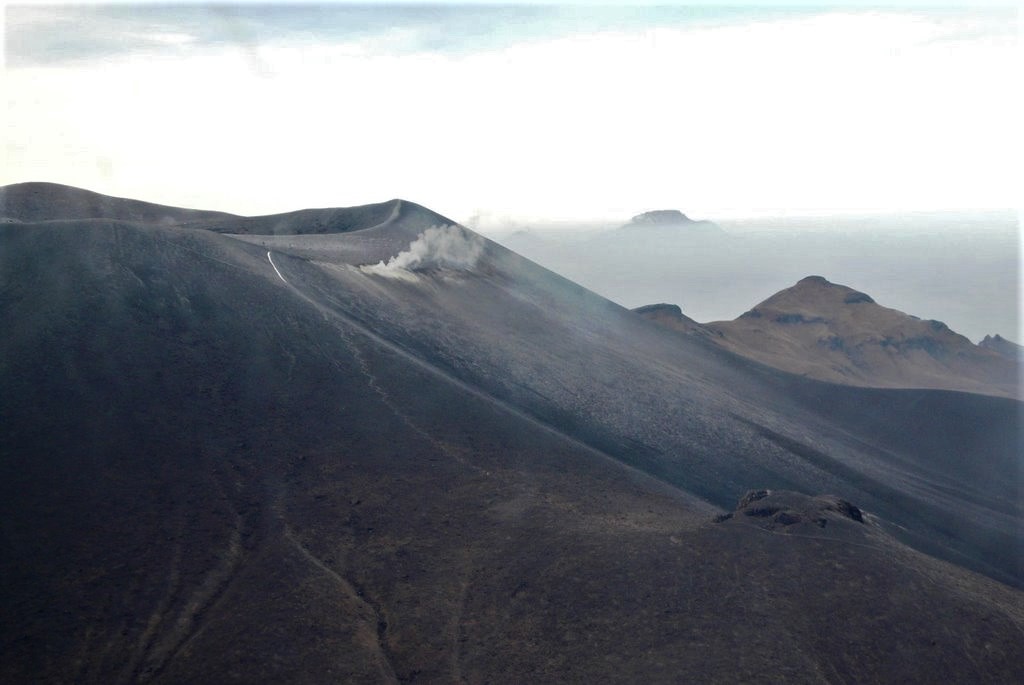
Colombia , Puracé – Chaîne volcanique Los Coconucos :
Popayán, July 8, 2025, 3:00 p.m.
Regarding the monitoring of the activity of the Puracé volcano and the Los Coconucos volcanic chain, the Colombian Geological Survey (SGC), an entity attached to the Ministry of Mines and Energy, reports that:
During the week of July 1-7, 2025, seismic activity decreased slightly compared to the previous week, particularly with regard to fluid dynamics.
Earthquakes associated with rock fracturing were located mainly between the Puracé and Piocollo volcanoes, at depths between 1 and 3 km, reaching a maximum magnitude of 1.3. The remaining seismic activity was distributed distally, at distances between 12 and 25 km to the northwest and southwest of the Puracé volcano crater, respectively.
Fluid-related earthquakes were located beneath this same crater, at a depth of less than 1 km, and are characterized by their low energy input.
Satellite and field detection instruments recorded moderate levels of sulfur dioxide (SO2) and carbon dioxide (CO2) emissions.
Furthermore, the slow deformation process detected after the eruption of Curiquinga Volcano on January 20, 2025, continues.
Visible spectrum webcam images continued to show degassing processes within the crater of Puracé Volcano and in the fumarole field on the outer rim of the crater. In conclusion, continuous degassing from the Puracé volcano crater continued throughout the week, accompanied by moderate SO2 and CO2 emissions, slow ground deformation, and localized seismic activity beneath the Puracé and Piocollo volcanoes, indicating the persistence of an active volcanic system.
The alert status for volcanic activity remains yellow: active volcano with changes in the baseline behavior of monitored parameters and other manifestations.
Source et photo : SGC
Hawaii , Kilauea :
HAWAIIAN VOLCANO OBSERVATORY DAILY UPDATE
U.S. Geological Survey
Thursday, July 10, 2025, 9:24 AM HST (Thursday, July 10, 2025, 19:24 UTC)
19°25’16 » N 155°17’13 » W,
Summit Elevation 4091 ft (1247 m)
Current Volcano Alert Level: WATCH
Current Aviation Color Code: ORANGE
Activity Summary:
Episode 28 of the ongoing Halemaʻumaʻu eruption ended just before 1:30 p.m. HST , July 9, 2025, after 9 hours of sustained lava fountaining. Summit inflation has resumed, and low-level degassing and seismic tremor persist.
Summit Observations:
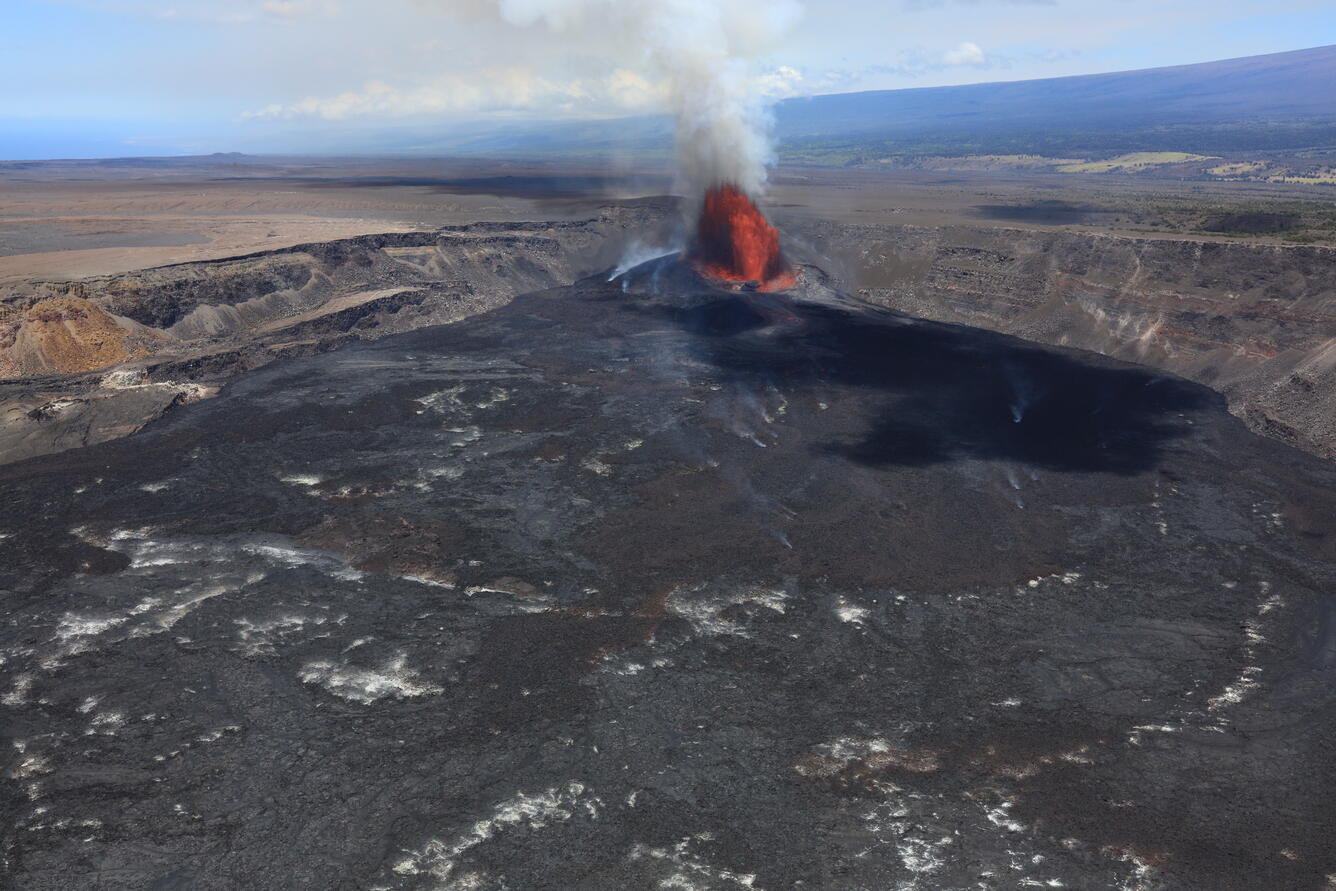
Following days of low-level gas pistoning and occasionally visible spatter and flames, activity at the north vent began to increase just after 4 a.m. HST (July 9, 2025) with a larger lava overflow, continuous low-level fountaining, weak deflation, and an increase in seismic tremor. An hour later, fountaining increased in height and vigor; at the same time, tilt began to drop sharply. High fountaining with maximum heights near 1,200 feet (365 meters) continued for roughly 8 hours, for a total of 9 hours of fountaining activity. All activity associated with Episode 28 was focused at the north eruptive vent; the south vent did not reactivate during the episode and appears to have been completely buried by the deposits erupted from north vent. Deposits from the episode have also nearly connected the growing eruptive cone with the top of the surrounding cliff in some places.

Aerial view taken during a USGS Hawaiian Volcano Observatory helicopter overflight, showing the lava fountain of episode 28 within the summit caldera (Kaluapele) of Kīlauea. These lava fountains reached a maximum of 1150 ft (350 meters) but were mostly lower than this height throughout the fountaining episode. The tephra and eruptive plume were blowing to the southwest with strong trade winds. At the time of the overflight, around 11 a.m. HST on July 9. lava flows had only advanced a little less than halfway across the crater floor.
At present, tremor and degassing persist at lower but still elevated levels. Typical sulfur dioxide (SO2) emission rates associated with pause periods are 1,200 to 1,500 t/d. Lava flows on the floor of Halemaʻumaʻu within the southern part of Kaluapele (Kīlauea caldera) may continue to exhibit slow movement or incandescence as they cool and solidify over the coming days, and additional new ooze-out lava flows have been observed at the edges of older flows. Slumping of the eruptive cone around the vent may also continue to expose incandescent material over the next hours to days.
At the time of the onset of Episode 28, the tiltmeter near Uēkahuna (UWD) had recorded about 14 microradians of inflationary tilt since the end of episode 27. Fountaining associated with Episode 28 resulted in 15 microradians of deflation. At the time of this update, UWD had re-inflated by nearly 3 microradians.
Source : HVO
Photo : USGS / D. Downs.