January 16 , 2025.
Hawaii , Kilauea :
Wednesday, January 15, 2025, 10:53 AM HST (Wednesday, January 15, 2025, 20:53 UTC)
19°25’16 » N 155°17’13 » W,
Summit Elevation 4091 ft (1247 m)
Current Volcano Alert Level: WATCH
Current Aviation Color Code: ORANGE
Activity Summary:
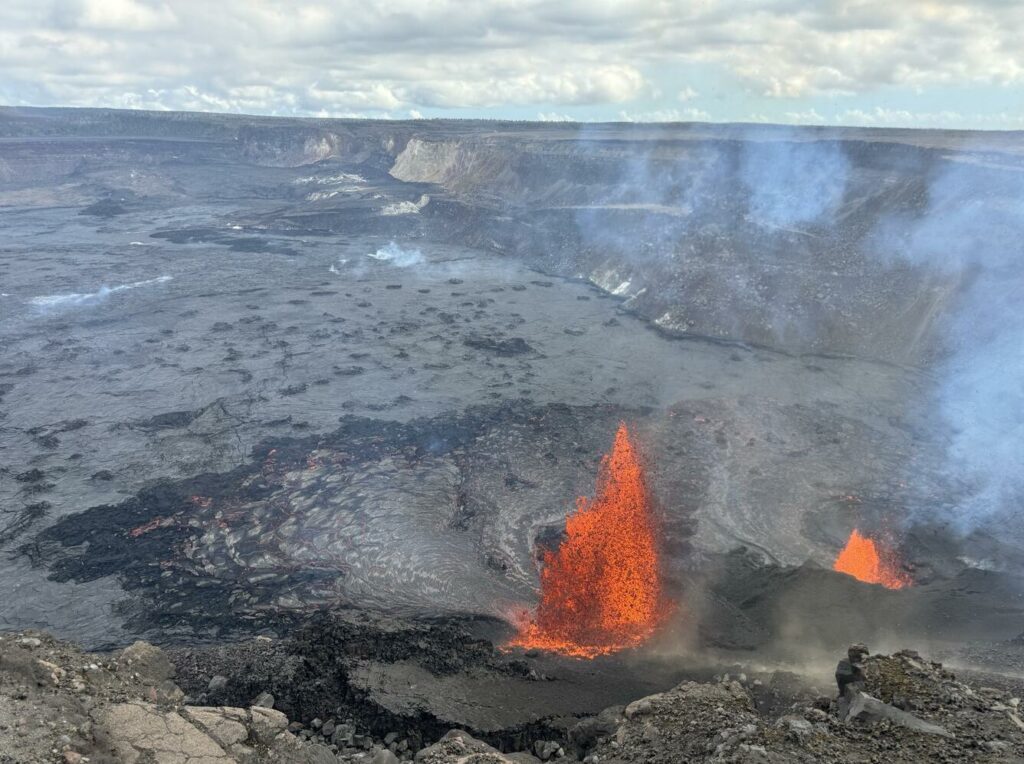
Around 9:15 a.m. HST this morning, January 15, 2025, the eruption of Kīlauea within Kaluapele (summit caldera) resumed with a small lava flow exiting the north vent, following low-level continuous lava spattering that started around 5:40 a.m. HST. from the same vent. Around 9:55 a.m., low-level lava fountaining started with more vigorous lava flow activity.
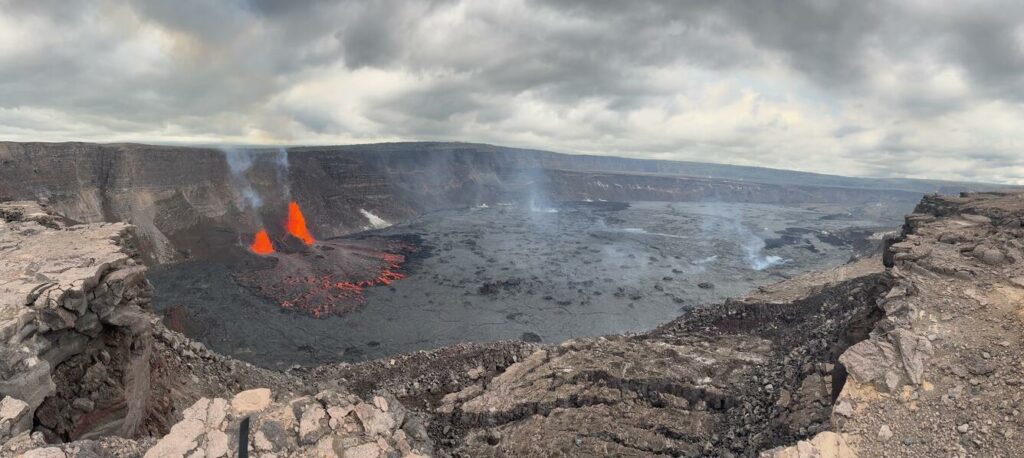
Panorama image of the north and south vents in the west portion of Kīlauea caldera are erupting lava fountains during the afternoon of January 15, 2025. Lava fountains are feeding lava flows that are moving in an eastward direction on the caldera floor.
The small sluggish lava flow from the north vent at around 9:15 a.m. today, Wednesday January 15, 2025, marks the beginning of the fourth episode of the ongoing summit eruption. By 9:50 a.m., lava flow activity increased, and lava fountaining began around 9:55 a.m. At time of writing, approximately ten percent of the floor of Halemaʻumaʻu has been covered with new lava, and based on webcam imagery, the lava fountain appears to be 60 meters (200 feet) high. The sluggish, low effusion rate eruptive activity at the start of the fourth eruptive episode was shorter than the sluggish start of second (3-4 hours) and third (2.5 days) eruptive episodes. There are no signs of activity at the south vent.
The tiltmeter at Uēkahuna continued to record inflation beneath Halemaʻumaʻu starting around 9 a.m. yesterday, and may be starting to show signs of leveling off. Tremor increased when fountaining began, but is still lower than the first two episodes of vigorous high fountains (>250 feet or 80 meters).
Episode 4 of the ongoing Kīlauea summit eruption began this morning, January 15, 2025. Lava fountains resumed erupting from the two vents that have been active in the eruption that began within Halemaʻumaʻu at the summit of Kīlauea volcano on December 23, 2024. Each episode of the eruption has been separated by pauses in eruptive activity lasting less than 24 hours to 12 days.
If fountaining continues, it is possible that the fountain heights will increase as more gas-rich lava erupted. It is not possible to estimate how high the fountains may get or how long the fountaining will last, but prior episodes have produced fountains over 200 feet high (70 m) that last up to 24 hours.
This is the fourth episode of an eruption that began within Halemaʻumaʻu at the summit of Kīlauea volcano on December 23, 2024. Each episode of lava fountaining has continued for 14 hours to 8 days and episodes have been separated by pauses in eruptive activity lasting a less than 24 hours to 12 days.
Source : HVO
Photos : USGS / M. Patrick.
Indonesia , Ibu :
Increase in Mt. Ibu’s activity level from level III (SIAGA) to level IV (AWAS).
I. Visual observation
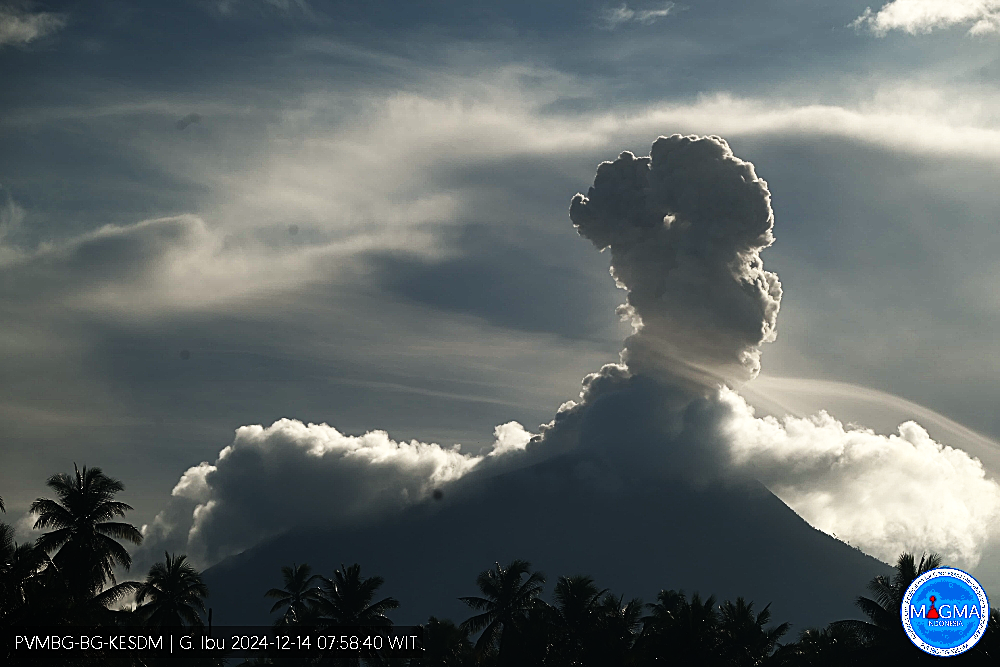
Mount Ibu, West Halmahera, has been at SIAGA III activity level since 21 June 2024. Eruptions occur on average at 70 events per day. During the period of January 2025, the height of the eruption column fluctuated and there were signs of an increase in the height of the eruption column up to a maximum of 4,000 m above the summit. Explosive eruptions do not occur continuously, when there is no eruption, visual observations of Mount Ibu are clearly visible until it is covered by fog. The smoke observed from the main crater is white and grey with fine to moderate intensity, approximately 100-400 m above the summit.
Until January 15, 2025, there have been 5 (five) eruptions of Mount Ibu with eruption columns that tended to be higher and larger than usual.
On January 1, 2025, at 19:58 WIT, an eruption occurred with an eruptive column about 3,000 m above the peak (± 4,325 m above sea level). The eruptive column was gray with a thick intensity oriented to the East and Southeast. This eruption was recorded on a seismogram with a maximum amplitude of 28 mm and a duration of ± 1 minute 52 seconds.
On 10 January 2025, there were two eruptive events with eruptive columns of approximately 3,000 m above the peak (± 4,325 m above sea level), namely at 12:35 WIT, and
18:20 . The eruptive column was grey with a thick intensity oriented towards the East and Southeast. This eruption was recorded on a seismogram with a maximum amplitude of 28 mm and a duration of ± 2 minutes 25 seconds for the first eruption and ± 2 minutes 18 seconds for the second eruption.
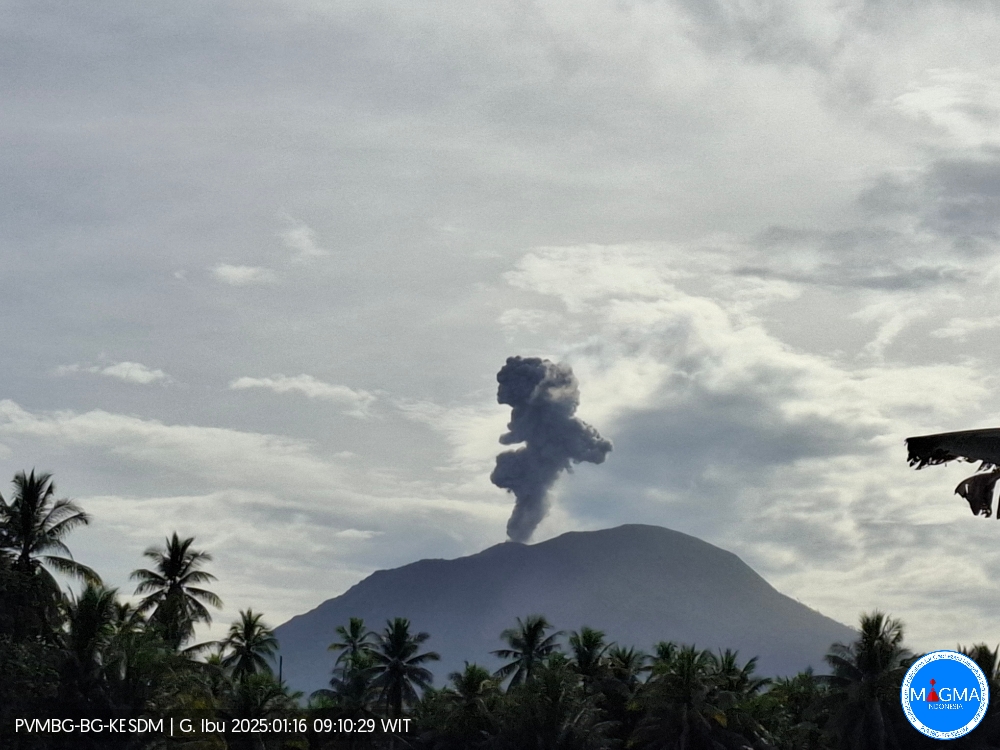
An eruption of Mount Ibu occurred on Thursday, 16 January 2025 at 09:09 WIT with an observed ash column height of ± 700 m above the peak (± 2025 m above sea level). The ash column was observed to be grey in colour with a thick intensity, oriented towards the West. This eruption was recorded on a seismograph with a maximum amplitude of 28 mm and a duration of 42 seconds.
On 11 January 2025, an eruption occurred with an eruptive column approximately 4000 m above the peak (± 5325 m above sea level) at 19:35 WIT. The eruptive column was grey with a thick intensity oriented towards the West. This eruption was recorded on a seismogram with a maximum amplitude of 28 mm and a duration of ± 3 minutes 5 seconds.
On 14 January 2025, an eruption occurred with an eruptive column approximately 3,000 m above the peak (± 4,325 m above sea level) at 14:07 WIT. The eruptive column was grey with a thick intensity oriented towards the West. This eruption was recorded on a seismogram with a maximum amplitude of 28 mm and a duration of ± 1 minute 54 seconds.
On 15 January 2025, an eruption occurred with an eruptive column approximately 4,000 m above the peak (± 5,325 m above sea level) at 07:11 WIT. The eruptive column was gray with a thick intensity oriented towards the West. This eruption was recorded on a seismogram with a maximum amplitude of 28 mm and a duration of ± 2 minutes 1 1 seconds. There was a strong bang and a rumble up to the PGA Post. Hot clouds were observed with a sliding distance of about 500 meters to the North of the crater opening and a rumbling noise accompanied by a rumbling was heard up to the PGA Post, Ibu.
II. Instrumental observation
During the period from 1 to 14 January 2025, the seismicity recorded on Mount Ibu was: 748 eruption earthquakes, 70 avalanche earthquakes, 1,643 emission earthquakes, 173 harmonic tremors, 11 « tornillos » earthquakes, 6,976 shallow volcanic earthquakes, 346 deep volcanic earthquakes, 60 local tectonic earthquakes, 1 felt earthquake and 223 distant tectonic earthquakes.
Tiltmeter data up to 6 January 2024 show inflation (swelling) in the body of the volcano that is thought to be due to fluid pressure from the depths. According to the G. lbu EDM results up to January 13, 2025, the Lower Tolisaur and Upper Tolisaur reflectors tend to be inflationary.
III. Assessment
Visually, the activity of G. Ibu has increased. Between January 1 and 14, 2025, four eruptions occurred, with the height of the eruptive column reaching 3,000 meters. On January 1, 2025 at 19:58 WIT and on January 15, 2025 at 07:11 WIB, the height of the eruption column reached 4,000 meters from the culminating crater,
Since around the beginning of January 2025, there has been a trend towards an increase in the frequency of shallow volcanic earthquakes and tectonic earthquakes with sources around Mount Ibu, so the eruption potential increases.
Deformation data show that inflation has occurred, indicating that the body of the volcano is swelling due to fluid pressure from deep within.
IV. Conclusion
Based on the results of visual and instrumental monitoring which show an increase in volcanic activity on Mount Ibu, the activity level of Mount Ibu has been upgraded from Level III (SIAGA) to Level IV (AWAS) as of 15 January 2025 at 10:00 WIT.
Source : PVMBG
Photos : Magma Indonésie.
Iceland , Grímsvötn :
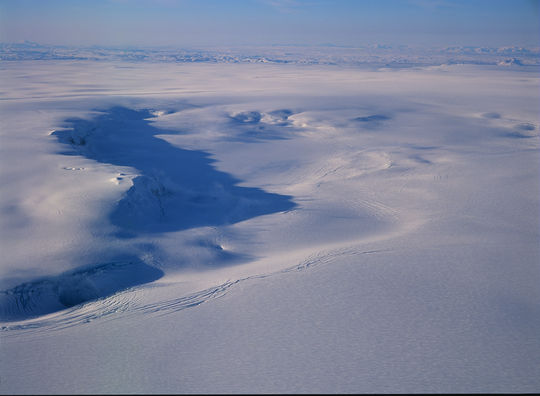
On 13 January the Icelandic Meteorological Office (IMO) reported that a gradual increase in seismic tremor at Grímsvötn had been detected over the previous few days, indicating the likely onset of jökulhlaup originating from the subglacial lake. Floodwaters typically emerge from the base of Skeiðarárjökull glacier, flowing into the Gígjukvísl river. On 15 January tremor recorded on the seismic station at Grímsfjall increased sharply, which is not unusual when a flooding event reaches peak discharge. The Aviation Color Code was raised to Yellow (the second level on a four-color scale) at 13h19, reflecting the slight increase in the likelihood of an eruption being triggered by the flood. IMO noted that the last eruption following a flooding event was in 2004; since then there have been 13 jökulhlaups with no eruptions. The 2011 eruption was not preceded by a jökulhlaup.
Grímsvötn, Iceland’s most frequently active volcano in recent history, lies largely beneath the vast Vatnajökull icecap. The caldera lake is covered by a 200-m-thick ice shelf, and only the southern rim of the 6 x 8 km caldera is exposed. The geothermal area in the caldera causes frequent jökulhlaups (glacier outburst floods) when melting raises the water level high enough to lift its ice dam. Long NE-SW-trending fissure systems extend from the central volcano. The most prominent of these is the noted Laki (Skaftar) fissure, which extends to the SW and produced the world’s largest known historical lava flow in 1783. The 15 km3 basaltic Laki lavas were erupted over 7 months from a 27-km-long fissure system. Extensive crop damage and livestock losses caused a severe famine that resulted in the loss of one-fifth of the population of Iceland.
Sources : Icelandic Meteorological Office (IMO), GVP.
Photo : Veðurstofa Íslands/Oddur Sigurðsson).
Japan , Sakurajima :
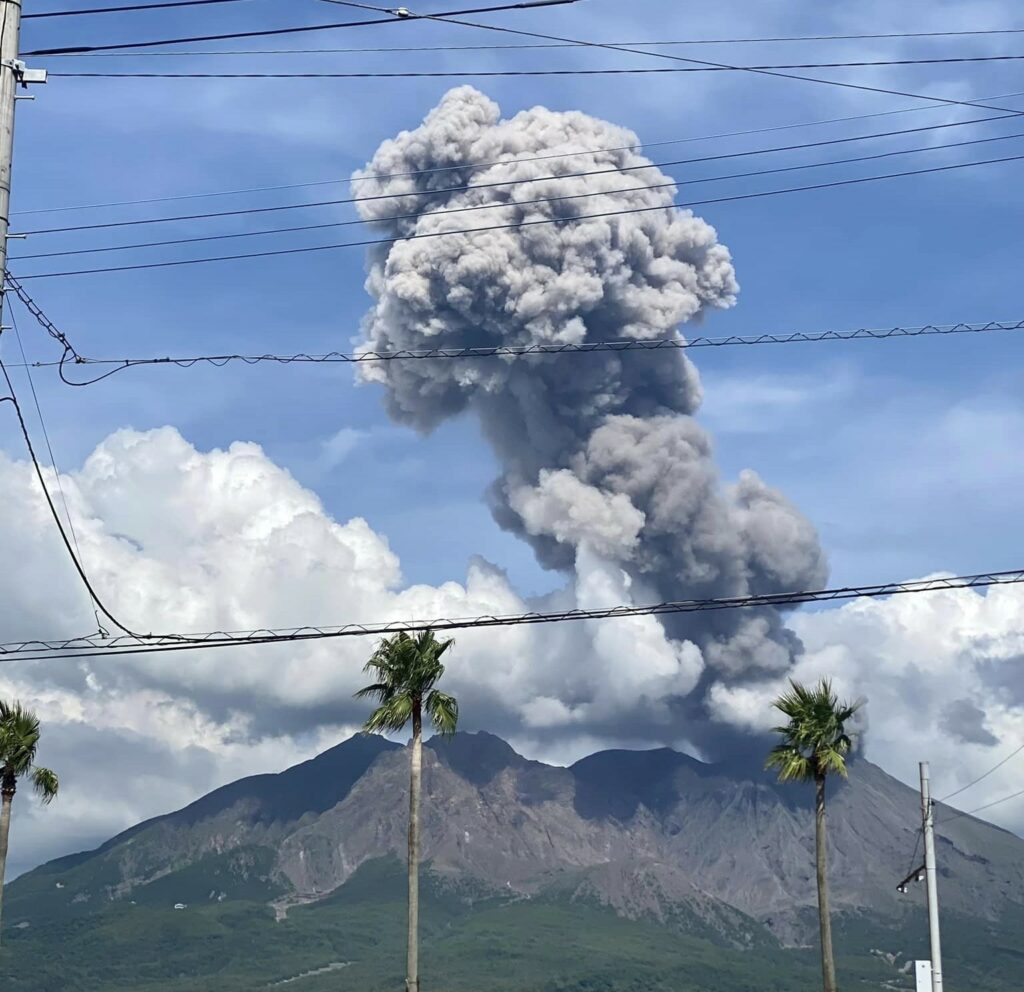
The Japan Meteorological Agency (JMA) reported ongoing eruptive activity at Minamidake Crater (Aira Caldera’s Sakurajima volcano) during 6-13 January. Nightly crater incandescence was visible in webcam images. Explosions at 14h51 and 19h13 on 6 January, at 19h46 and 22h25 on 7 January, at 05h16 on 8 January, and at 04h49 on 12 January produced ash plumes that rose 0.9-1.5 km above the crater rim and drifted SE. All of the explosions, except for those at 14h51 on 6 January and at 19h46 on 7 January, ejected large blocks 300-1,100 m above the crater rim. An eruptive event at 05h41 on 12 January produced an ash plume that rose 1.2 km above the crater rim and drifted SE. The Alert Level remained at 3 (on a 5-level scale), and the public was warned to stay 1 km away from both craters.
The Aira caldera in the northern half of Kagoshima Bay contains the post-caldera Sakurajima volcano, one of Japan’s most active. Eruption of the voluminous Ito pyroclastic flow accompanied formation of the 17 x 23 km caldera about 22,000 years ago. The smaller Wakamiko caldera was formed during the early Holocene in the NE corner of the caldera, along with several post-caldera cones. The construction of Sakurajima began about 13,000 years ago on the southern rim and built an island that was joined to the Osumi Peninsula during the major explosive and effusive eruption of 1914. Activity at the Kitadake summit cone ended about 4,850 years ago, after which eruptions took place at Minamidake. Frequent eruptions since the 8th century have deposited ash on the city of Kagoshima, located across Kagoshima Bay only 8 km from the summit. The largest recorded eruption took place during 1471-76.
Sources : Japan Meteorological Agency (JMA), GVP.
Photo : Kumiko Nagai
Philippines , Kanlaon :
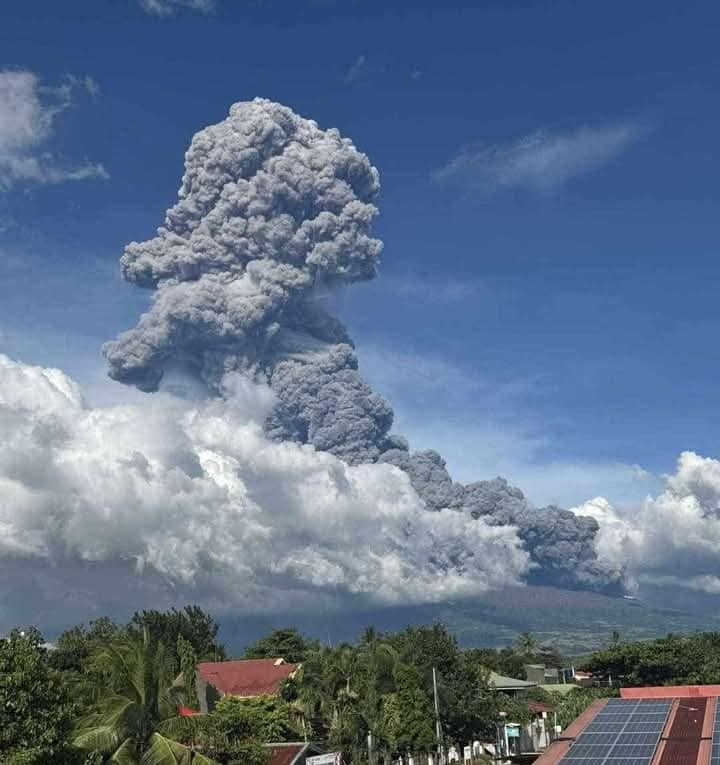
The Philippine Institute of Volcanology and Seismology (PHIVOLCS) reported continuing eruptive activity at Kanlaon during 7-13 January. The seismic network recorded 11-22 daily volcanic earthquakes that, during 7-8 and 11-13 January, included 1-7 periods of volcanic tremor lasting 10 minutes to one hour and 57 minutes. Average daily sulfur dioxide emissions ranged from 2,029 to 5,763 tonnes per day, with the upper limit being close to the average recorded since the 3 June 2024 eruption. Daily gas emissions that occasionally contained ash were often voluminous, rising as high as 1 km above the summit and drifting in multiple directions. There were 1-3 daily periods of ash emissions during 7-8 and 12-13 January, each as short as five minutes to as long as one hour and 55 minutes. The ash plumes mainly drifted W, WSW, and SW. Rapid inflation of the mid-to-upper part of the E flank was detected at 1920 on 10 January in tilt data recorded by the Upper Pantao Observation station (VKUP) located at 1,056 m elevation on the E flank.
The eruption continued to impact residents. The National Disaster Risk Reduction and Management Council (NDRRMC) report issued at 0800 on 12 January stated that 10,003 people (3,158 families) were spread across 25 evacuation centers and another 7,576 people (2,409 families) were staying elsewhere. The Alert Level remained at 3 (on a scale of 0-5); the public was warned to stay 6 km away from the summit and pilots were warned not to fly close to the volcano.
Sources: Philippine Institute of Volcanology and Seismology (PHIVOLCS), The National Disaster Risk Reduction and Management Council (NDRRMC) , GVP.
Photo : Miss Ching Lagawing’ 12/2024.


