July 13 , 2024.
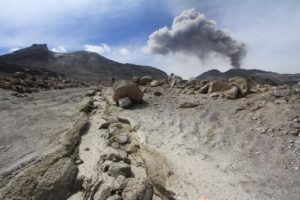
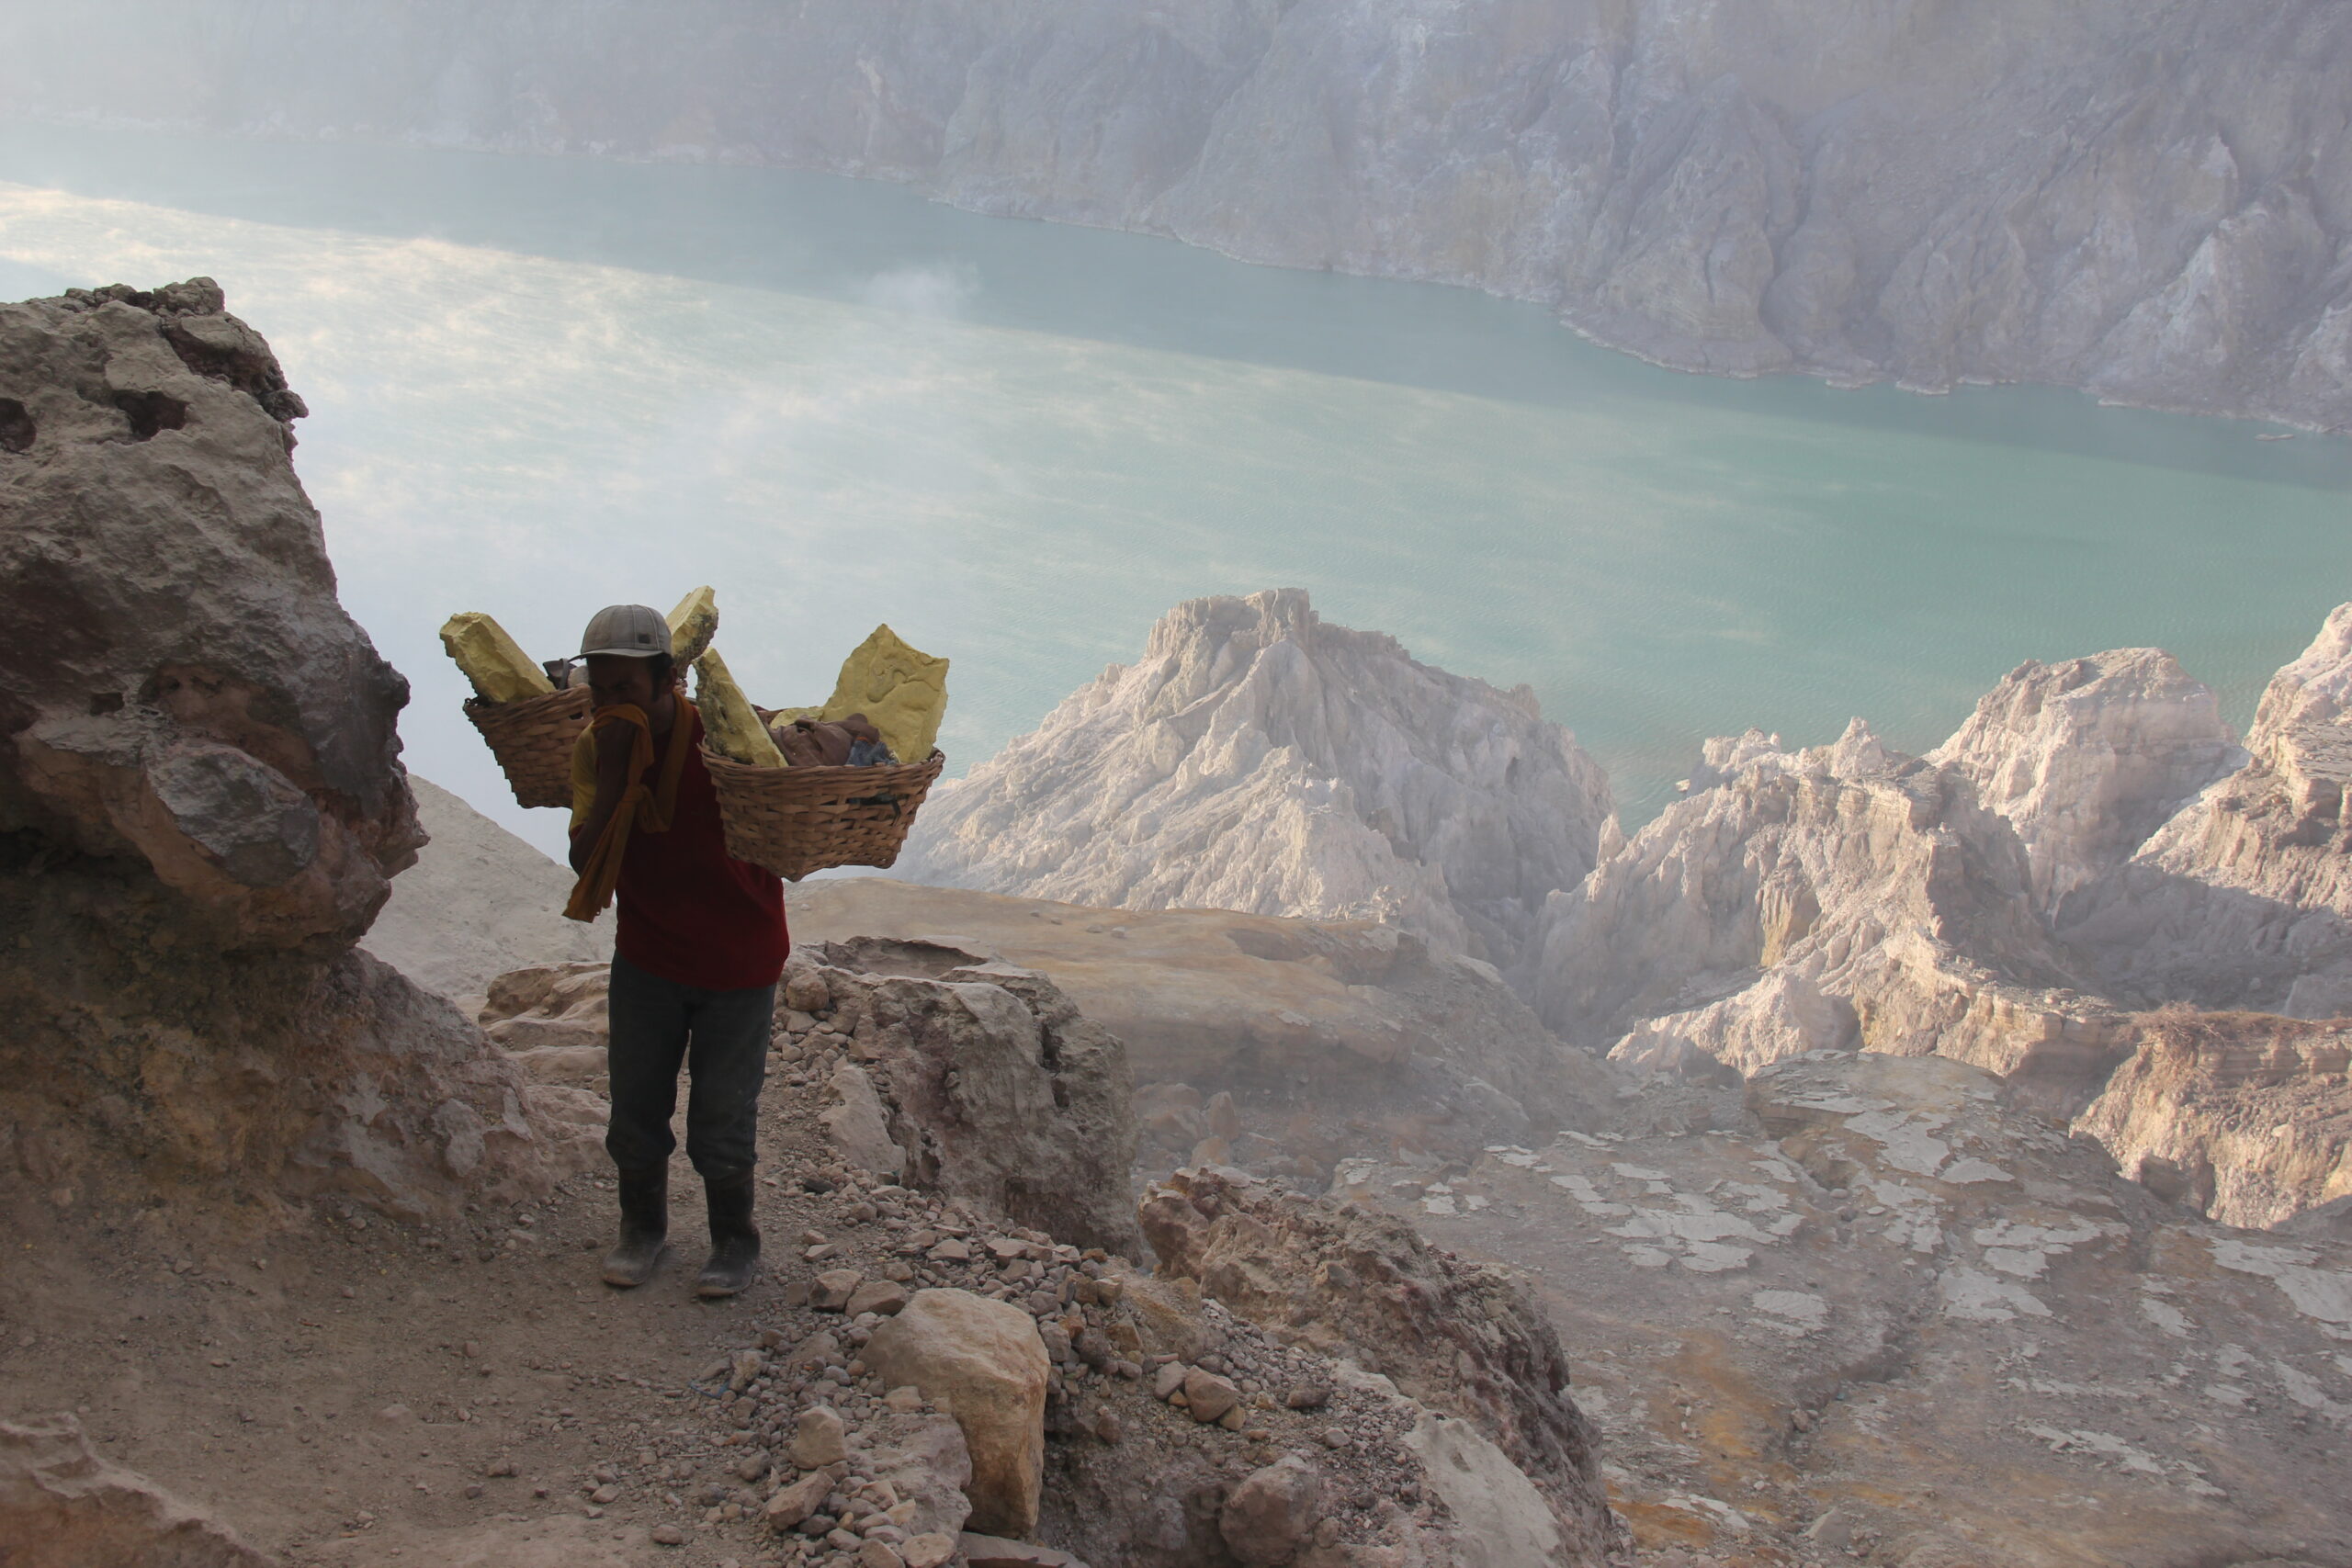
Indonesia , Kawah Ijen :
INCREASE IN ACTIVITY LEVEL OF G. IJEN FROM LEVEL I (NORMAL) TO LEVEL II (WASPADA).
Mount Ijen’s eruptions since 1900 have taken the form of phreatic eruptions from the crater lake. The 1993 phreatic eruption produced a column of black smoke reaching a height of 1,000 m. In 2011-2012, there was also an increase in activity in the form of an increase in seismicity and lake water temperature. In 2017, there were three gas explosions (CO2 explosion). In 2018, there were three gas explosions (CO2 explosions), namely on January 10, 2018, February 19, 2018 and March 21, 2018, which were quite large gas explosions which were followed by a flow of gas in the Banyu Pait River valley over a distance of more than 7 km. The last increase in activity occurred on January 17, 2020, in the form of an increase in the number of shallow volcanic earthquakes.
Between January 1, 2024 and July 12, 2024, the mountain is clearly visible until it is covered in fog. White and gray smoke coming from the crater was observed with low intensity 50-300 meters from the summit. During the measurements on June 30, 2024, the water temperature of the crater on the surface was 34°C. There is thick white solfatara smoke with low to moderate pressure. The odor of sulfurous gas is moderate. Peppered sulfur is visible at the edge of the lake.
Between January 1, 2024 and July 12, 2024, 424 swarm earthquakes were recorded, 12 non-harmonic earthquakes, 3 Tornillo-type earthquakes, 8 low-frequency earthquakes, 259 small volcanic earthquakes. deep, 25 deep volcanic earthquakes, 45 local tectonic earthquakes, 4 times felt, 294 deep tectonic earthquakes, 192 continuous tremors with an amplitude of 0.5 to 7 mm, dominant value 3 mm. The number of shallow volcanic earthquakes and deep volcanic earthquakes tends to decrease, while the number of other earthquakes fluctuates normally.
Increased activity in Ijen Crater is often marked by a change in the color of the crater lake water from green to whitish green, this occurs due to the rise of sediment from the lake bottom to the surface due to the high pressure of gas from the bottom of the lake. The water temperature of Ijen Crater will also increase as the pressure/concentration of gas rising from the bottom of the lake increases. Under conditions of increasing activity of Ijen Crater, gas bubbles will usually appear on the surface of the crater water.
Multiple incidents of increased activity in Ijen Crater are often followed by « gas explosions » or gas eruptions/emissions from the crater lake. The gas emitted is mainly CO2. This CO2 gas has a heavier specific density than air, so the CO2 that comes out as a result of this eruption/explosion tends to flow down the valley like the gas eruption/explosion that erupted produced in March 2018.
Visually, the color of the crater water is normal (turquoise green), there is no change in the color of the crater water, there are no gas bubbles visible on the surface of the crater. water, the temperature of the water in the crater is still normal, namely 34° C.
During the period from June 1, 2024 to July 12, 2024, the number of shallow volcanic earthquakes and deep volcanic earthquakes tends to decrease, while the number of other earthquakes fluctuates normally.
RSAM records since January 1, 2023 show a fluctuating trend and tend to increase, albeit modestly. Seismic energy has generally fluctuated and slowly increased since 2023, but on July 12, a significant increase in energy was observed along with an increase in the amplitude of continuous tremors.
Although in general seismicity fluctuates normally, since July 12, 2024 between 5:00 p.m. and 9:00 p.m. WIB, the recording of earthquakes has increased in fluctuation with an amplitude of 5 to 25 mm. And since around 9:10 p.m. WIB, seismic tremors have been recorded with an amplitude > 46 mm (overscale).
The potential danger that may arise from the volcanic activity on Mount Ijen at this time is the high concentration of volcanic gases around the crater originating from the solfatara activity on the walls of the Ijen crater and also the diffusion of volcanic gases from the inside the crater towards the surface, as well as phreatic eruptions in the form of gas emissions from the crater lake. Phreatic eruptions can occur without being preceded by an increase in visual or seismic activity.
Based on the results of the assessment until July 12, 2024, the activity level of Mount Ijen was increased from level I (normal) to level II (WASPADA) from July 12, 2024 at 22:00 WIB.
Source : PVMBG
Photo : G Vitton
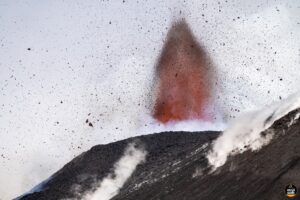
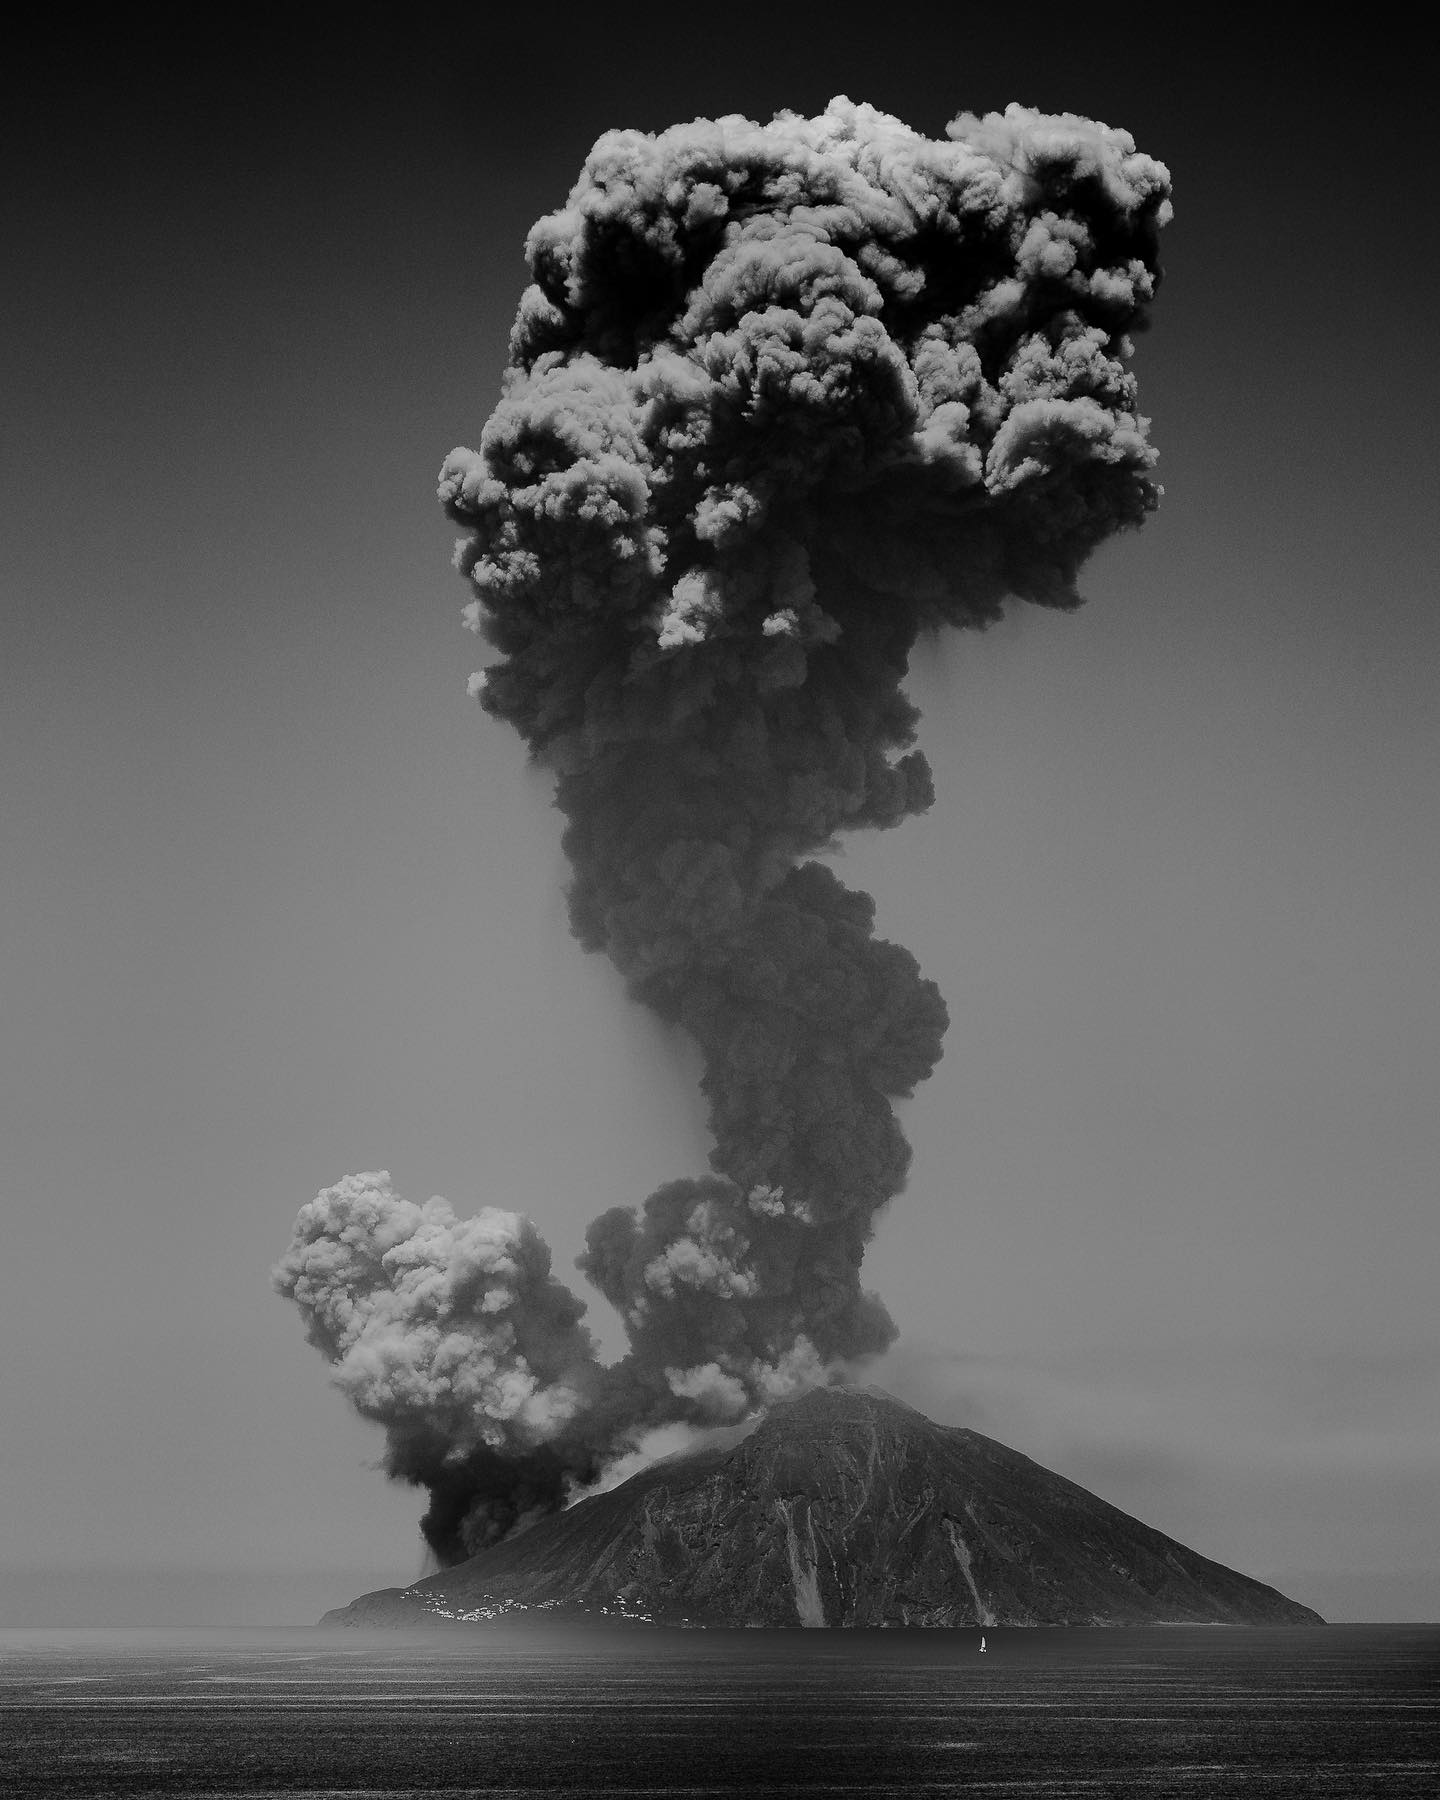
Italy , Stromboli :
Press release on Stromboli activity, July 12, 2024, 10:30 (08:30 UTC).
The National Institute of Geophysics and Volcanology, Osservatorio Etneo, communicates that from the analysis of images from the cameras of the monitoring network and INGV personnel in the field, it is possible to observe that the flow on the Sciara del Fuoco generated by the effusive activity has stopped. There are currently no active flows.
Following the paroxysmal phenomenon of July 11, morphological variations were recorded in the crater area where the absence of explosive activity persisted.
The average amplitude of the seismic signal is at low levels with few oscillations at the average level. Analysis of seismograms highlights low seismic activity.
Regarding deformations, the inclinometer network, after the transient recorded during yesterday’s paroxysmal activity, does not show significant variations. The GNSS network does not record any significant changes.
Further updates will be communicated shortly.
Source : INGV
Photo : @valerianecchi_photographer via Stromboli Stati d’animo / Sebastiano Cannavo .
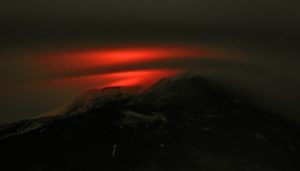
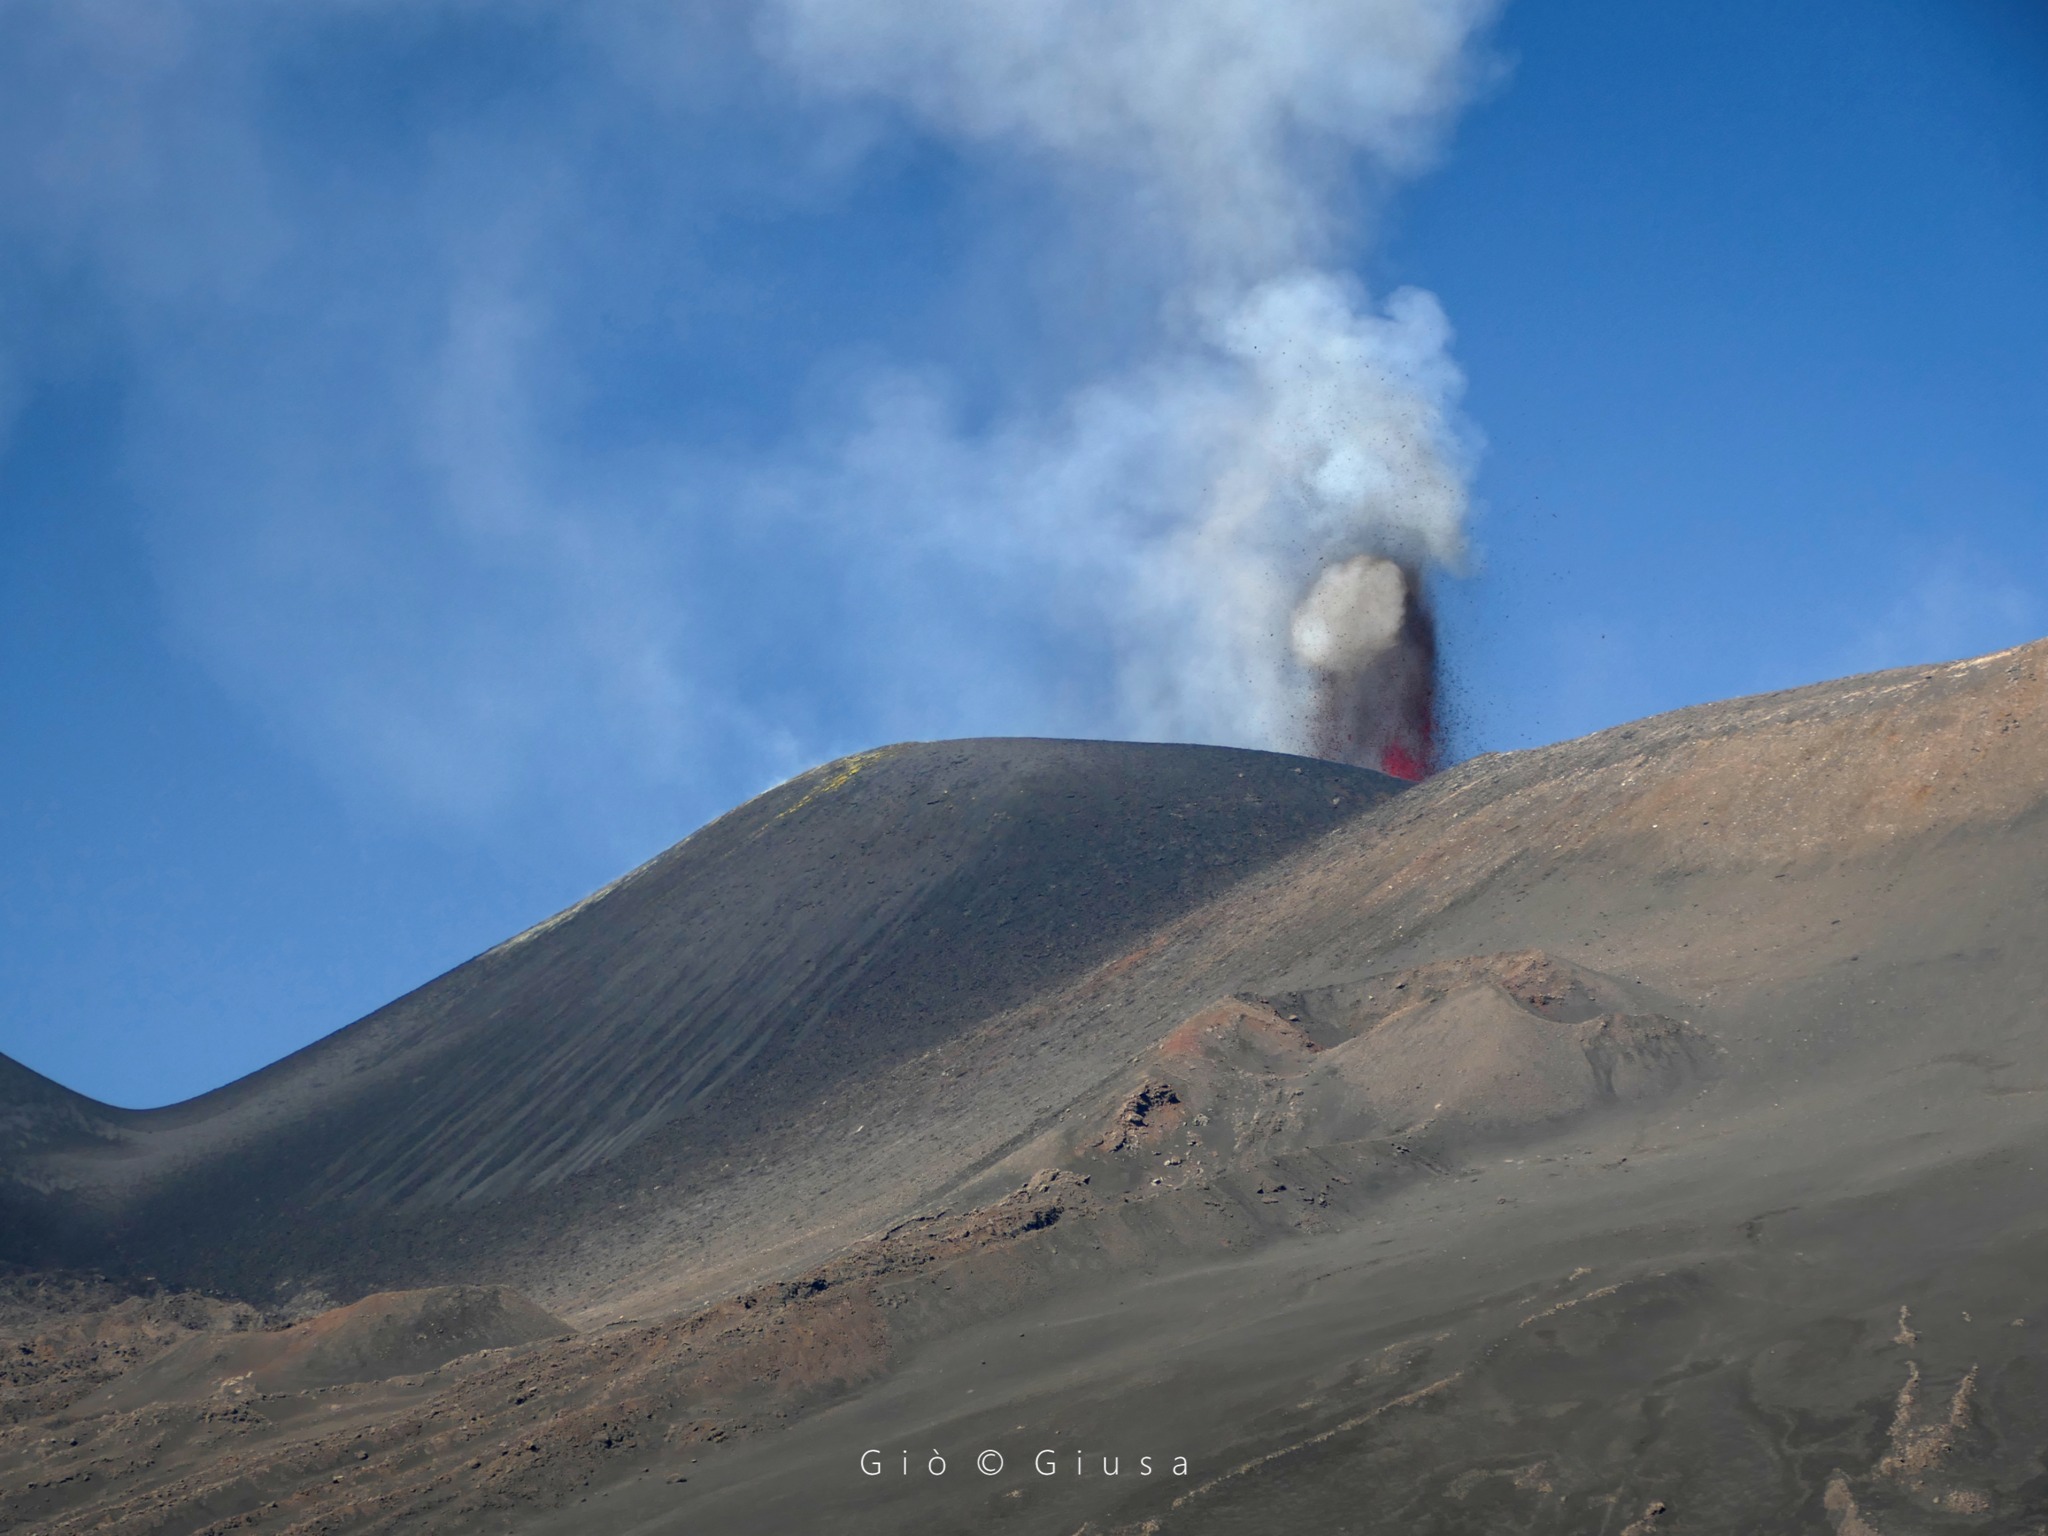
Italy / Sicily , Etna :
Press release on the activity of Etna, July 12, 2024, 11:07 (09:07 UTC).
The National Institute of Geophysics and Volcanology, Osservatorio Etneo, communicates that according to the analysis of the images from the cameras of the monitoring network, the Strombolian activity has been considerably reduced, in addition the lava flow produced by the Voragine crater n is more active.
The average amplitude of the volcanic tremor, from 01:00 UTC today July 12, shows oscillations between medium and high levels, with a downward trend and, in recent hours, it is limited to the medium level. The center of gravity of the sources of the volcanic tremor is located in the Southeast crater area, at an altitude between 2,300 and 2,900 m above sea level. The infrasound activity decreases and the sources of the events are located in the Southeast crater.
Concerning deformations, the inclinometer network does not present significant variations.
Further updates will be communicated shortly.
Source : INGV
Photo : Gio Giusa .
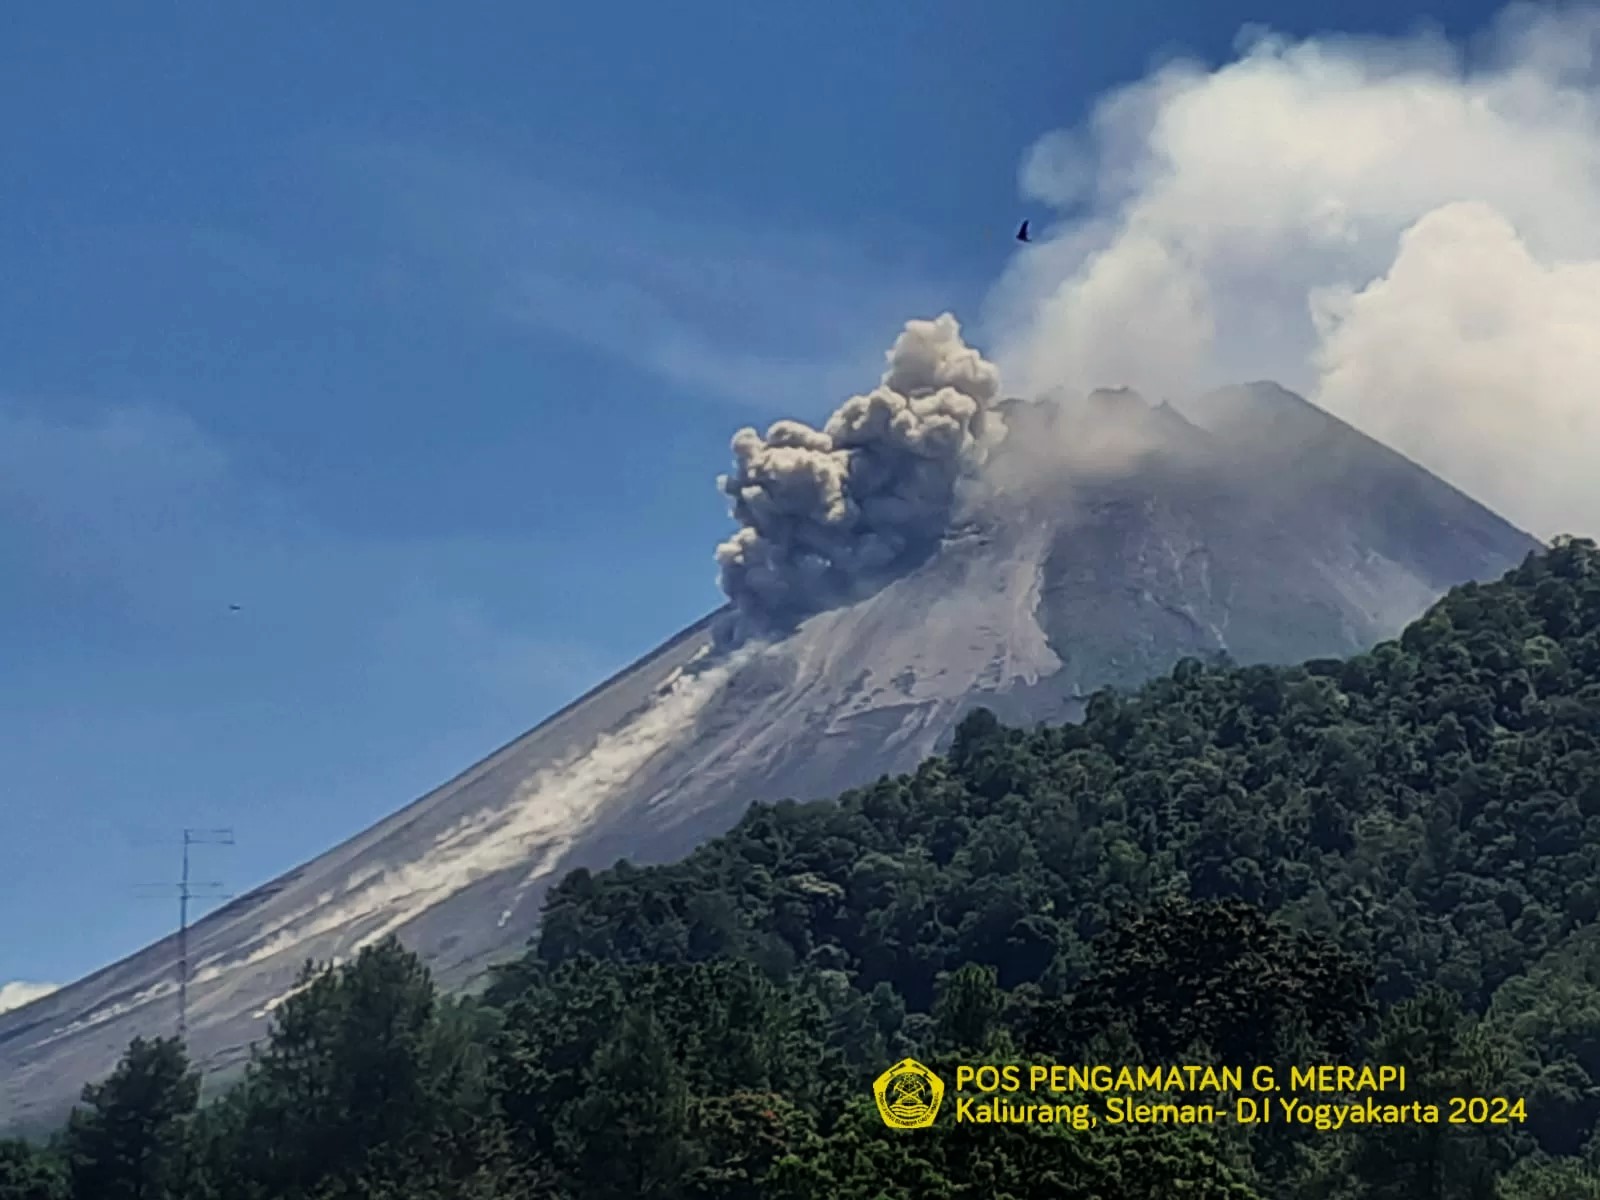
Indonesia , Merapi :
MOUNT MERAPI ACTIVITY REPORT, from July 5 to 11, 2024. Published on July 12, 2024
OBSERVATION RESULT
Visual
The weather around Mount Merapi is generally clear in the morning and night, while it is foggy from noon to evening. White smoke, of light to thick thickness, low to moderate pressure and a height of 700 m was observed from the observation post of Mount Merapi Selo on July 7, 2024 at 06:00 WIB. This week, there was a warm cloud avalanche in the southwest (upstream of the Bebeng River) with a sliding distance of 1,300 m. Lava avalanches were observed 131 times towards the upstream of the Bebeng River up to a maximum of 2,000 m and once towards the South (upstream of the Boyong River) up to 900 m. The sound of avalanches was heard 8 times from Kaliurang and Babadan posts with low to moderate intensity.The morphology of the Southwest dome was observed to change due to dome growth activities, hot cloud avalanches, and lava avalanches. The highest hot spot was observed at 243°C, relatively the same as the previous measurement temperature. For the morphology of the medial dome, no significant changes were observed. The highest hot spot was observed at 219.4°C, which was higher than the previous measurement temperature. Based on the analysis of aerial photos, the volume of the South-West dome was measured at 2,425,500 m3 and that of the Central dome at 2,360,700 m3.
Seismicity
This week the seismicity of Mount Merapi recorded:
1 warm cloud avalanche (APG) earthquake,
98 superficial volcanic earthquakes (VTB),
452 times multi-phase (MP) earthquakes,
13 low frequency (LF) earthquakes,
522 avalanche earthquakes (RF),
13 tectonic earthquakes (TT).
The intensity of earthquakes this week is higher than last week.
Deformation
The deformation of Mount Merapi monitored by EDM this week showed an average shortening rate of 2.1 cm/day, lower than last week.
Rain and lahars
This week there was no rain at the Mount Merapi lookout and no additional flow or lava was reported in the rivers that originate at Mount Merapi.
Conclusion
Based on the results of visual and instrumental observations, it was concluded that:
Mount Merapi’s volcanic activity is still quite high in the form of effusive eruptive activity. The activity status is set to the “SIAGA” level.
Source : BPPTKG
Photo : BPPTKG ( archive)
Chile , Villarica :
Seismology
The seismological activity of the period was characterized by the recording of:
A continuous tremor signal associated with the fluid dynamics inside the volcano, which, during the period, presented an energy variation, evaluated with the RSAM parameter, between 0.2 and 0.4 μm/ s.
10 seismic events of type VT, associated with the fracturing of rocks (Volcano-Tectonics). The most energetic earthquake had a Local Magnitude (ML) value equal to 1.2, located 9.9 km east-southeast of the volcanic edifice, at a depth of 1.0 km relative to to the crater.
1821 LP type seismic events, associated with fluid dynamics within the volcanic system (Long Period). The size of the largest earthquake evaluated from the Reduced Displacement (RD) parameter was equal to 19 cm2.
302 seismic events of type TR, associated with the dynamics maintained over time of fluids inside the volcanic system (TRemor). The size of the largest earthquake evaluated from the Reduced Displacement (RD) parameter was equal to 12 cm2.
Fluid Geochemistry
The sulfur dioxide (SO2) emissions data obtained by the differential optical absorption spectroscopy (DOAS) equipment, corresponding to the Los Nevados and Tralco stations, installed respectively at 10 km in an East-North-East direction and 6 km East-South-East of the active crater, presented an average value of 693 t/d in the second half of June, with a maximum average value of 903 t/d on June 27.

Geodesy
The analysis of geodetic data, based on data from 5 GNSS stations, indicates that:
– Horizontal and vertical displacement rates have moderate magnitudes, and in general, they are affected by cyclical variations, data loss and increased dispersion in time series, which does not allow correct estimation the magnitudes of the rates.
– The variation in distance between the different GNSS stations does not show variations during this period, however, the distance between stations remains greater than the basic distance values.
Based on the trends and directions of movements in the current period, no deformation patterns are observed at the volcanic edifice suggesting relevant depth changes.
Surveillance cameras
The frequency of available images, provided by fixed cameras near the volcano, was significantly reduced due to unfavorable weather conditions during the assessment period. However, during days of visibility, outgassing events were recorded with a maximum height of 800 m above the crater level. The nocturnal activity featured sporadic incandescence and the presence of Strombolian explosions up to 200 m high, which in turn generated pyroclastic and ballistic deposits in the area near the crater and drop deposits up to 400 m high. carried on the northwest flank of the volcano.
The explosion that occurred on June 29 at 2:51 p.m. HL (6:51 p.m. UTC) is distinguished by a maximum height of 420 m above the level of the crater with dispersion towards the East-North-East and a pyroclastic deposit with a main descent of 2.8. approximately km, in the direction mentioned.
Satellite geomorphological analysis
According to the analysis of Planet Scope, Sentinel 2 L2A and SkySat Collect satellite images, there is visibility only in the morning of June 28 and 29, in which the lava lake is not identified, probably in due to the pyroclast cover. No other morphological variations are recognized indicating changes in the development of volcanic processes expected at this level of activity.
The continuous tremor type seismic signal is maintained at low energy values with RSAM levels considered low. However, during the period evaluated, some explosions released pyroclastic materials whose deposits reached maximum distances of 400 m from the crater rim. Thanks to the different cameras and when weather conditions permitted, degassing and sometimes incandescence phenomena were detected. The above suggests that although the energy of the seismic signals remains at low levels, there is still evidence that the lava lake is located near the surface, generating explosive activity that impacts areas near the crater.
Therefore, the technical alert is maintained in:
YELLOW TECHNICAL ALERT: Changes in the behavior of volcanic activity
Source : Sernageomin
Photo : in-cyprus.philenews.com/