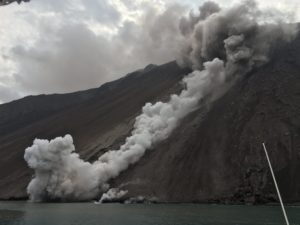
Iceland , Reykjanes Peninsula :
Inflation continues in Svartsengi, around 2 to 3 cm between April 2 and 7. The speed increased as the power of the eruption decreased. This indicates that the majority of the magma flowing beneath Svartsengi is pooling and that there is an open connection with the Sundhnúks craters.
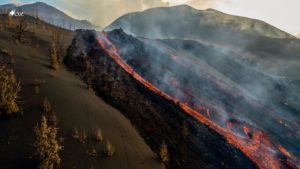
Experts from the Institute of Natural Sciences and Land Registry of Iceland conducted a study flight over the eruptions yesterday, April 8. Based on the data collected during the flight, it was possible to estimate the size of the lava bed and the lava flow during the eruption. The results show that the power of the eruption steadily decreased.
The average lava flow from the craters between April 3 and 8 is estimated at 3.6 ± 0.7 m3/s. Based on data collected by the Efla Engineering Institute on April 3 during a drone flight, the average lava flow was estimated at 6.6 ± 0.3 m3/s from March 27 to April 3 . The surface area of the lava bed is 6.14 km2 and its volume is 31.3 million m3.
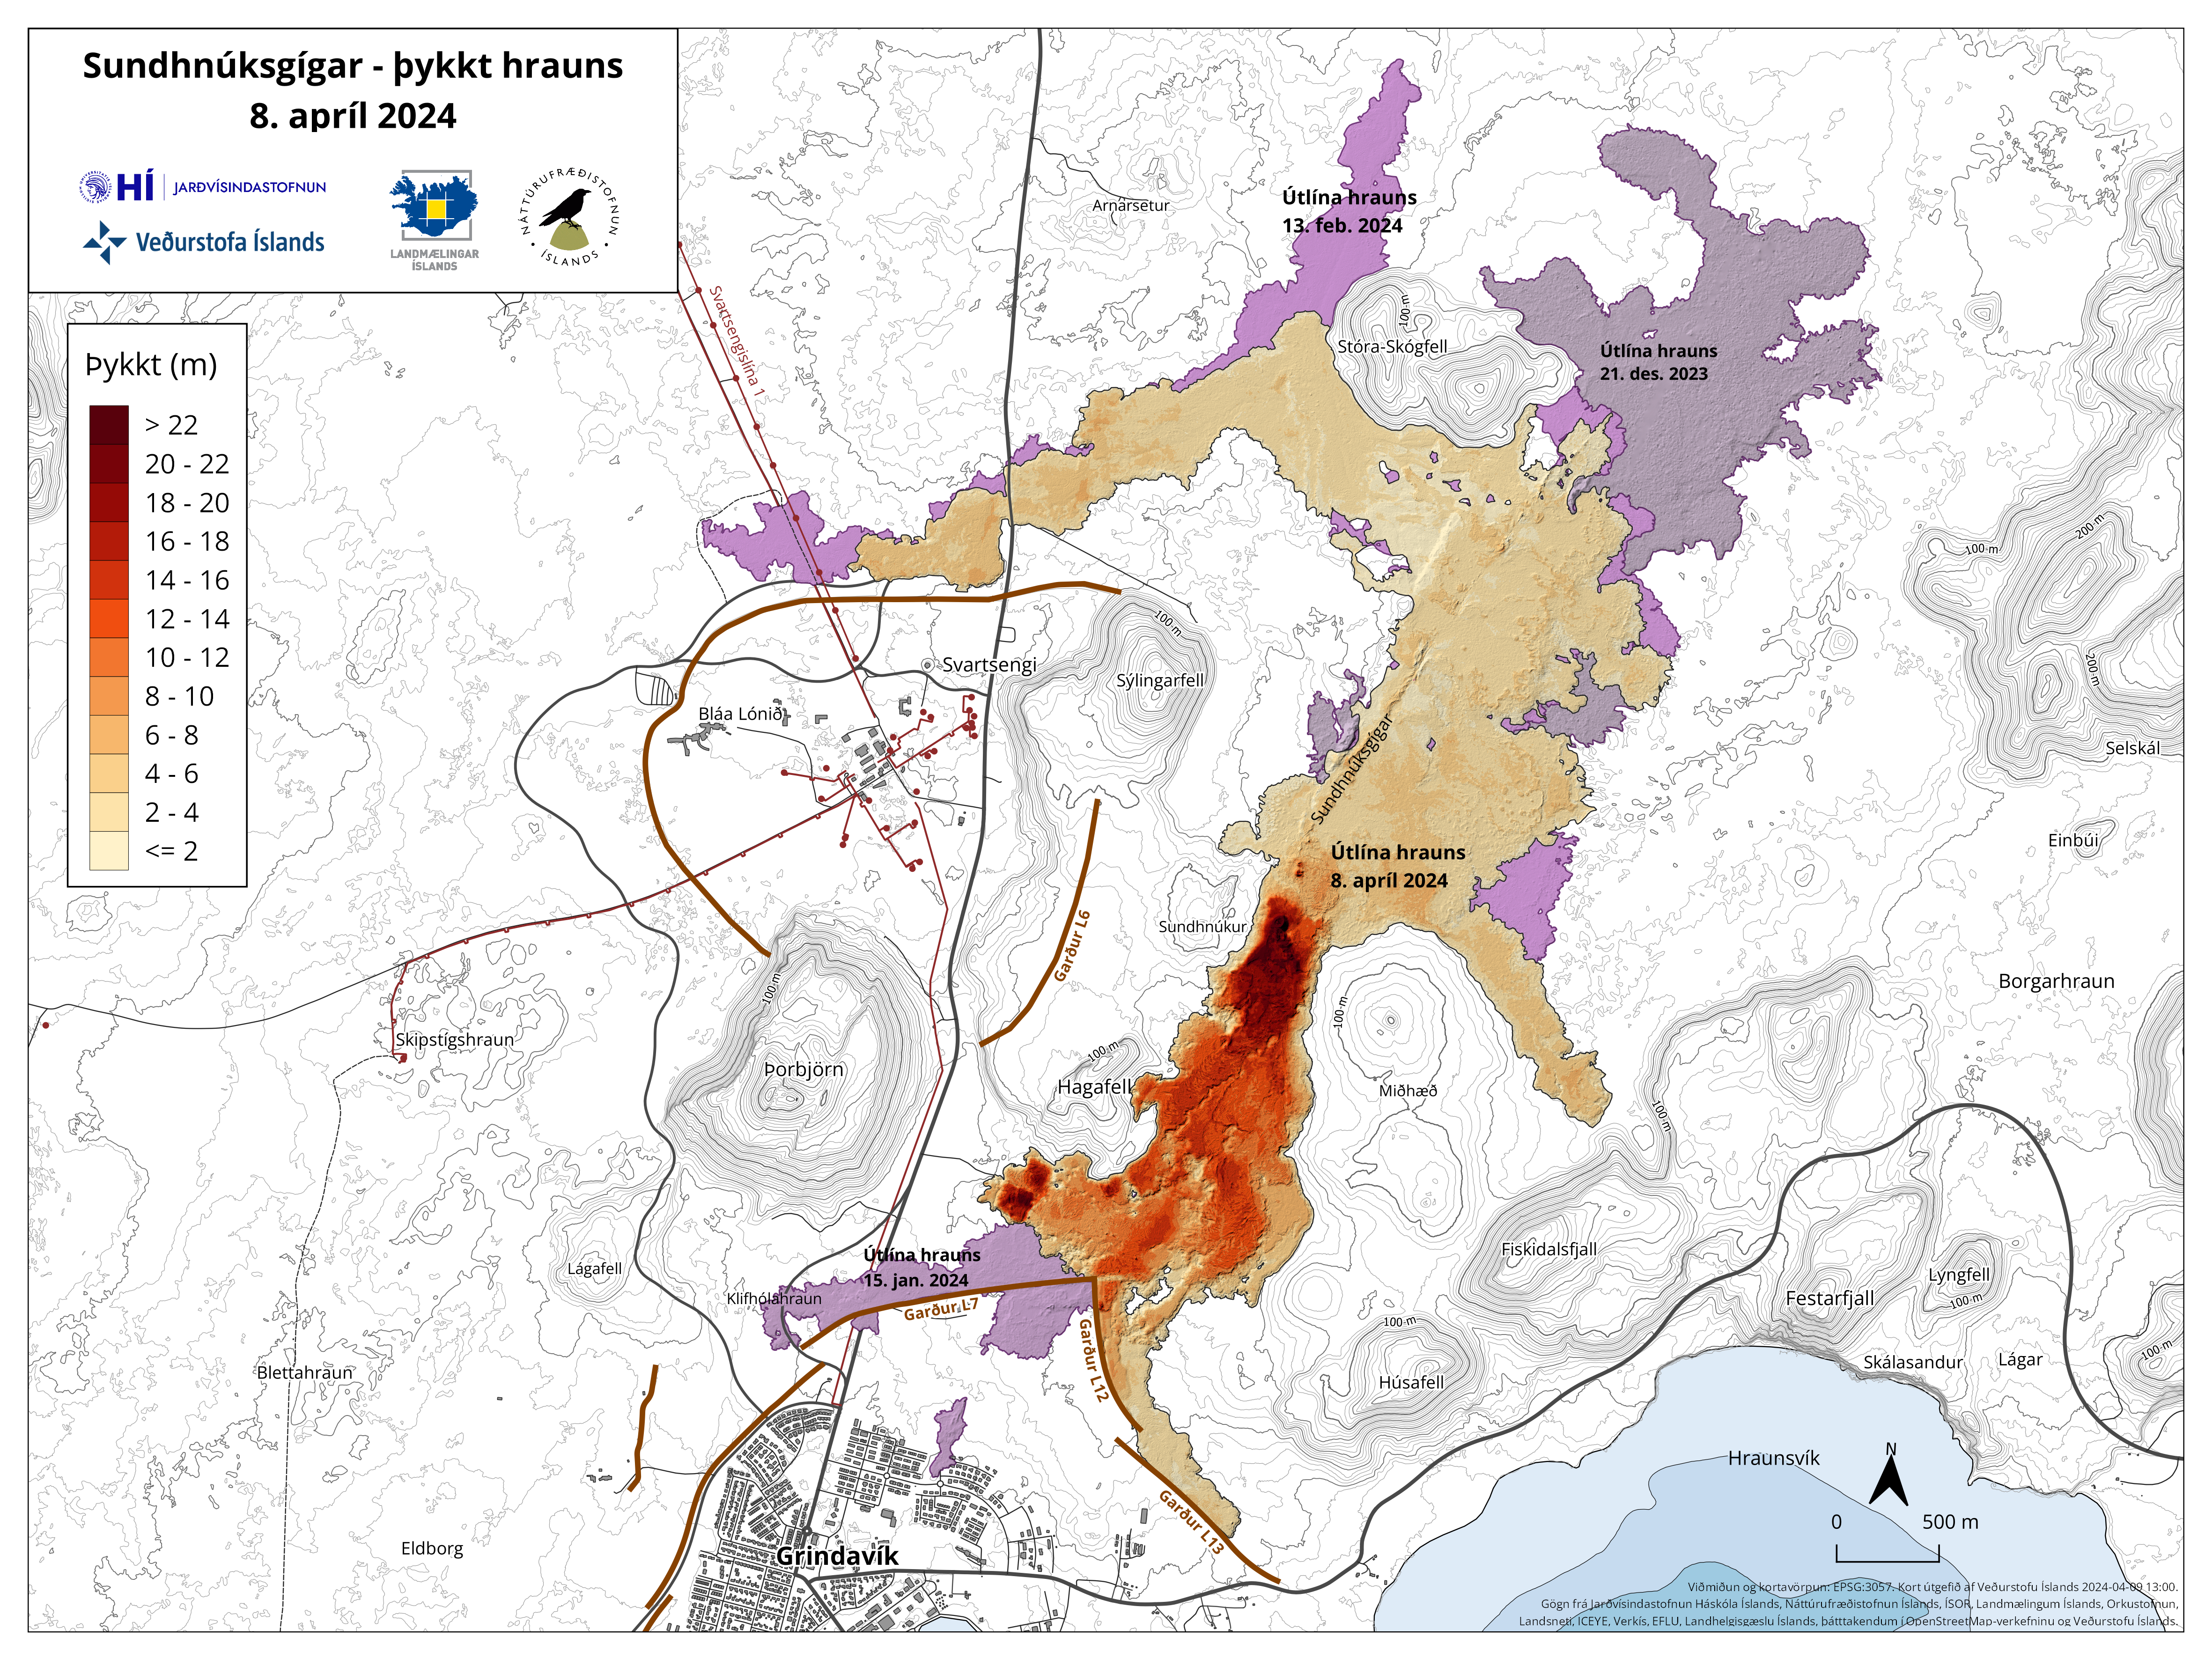
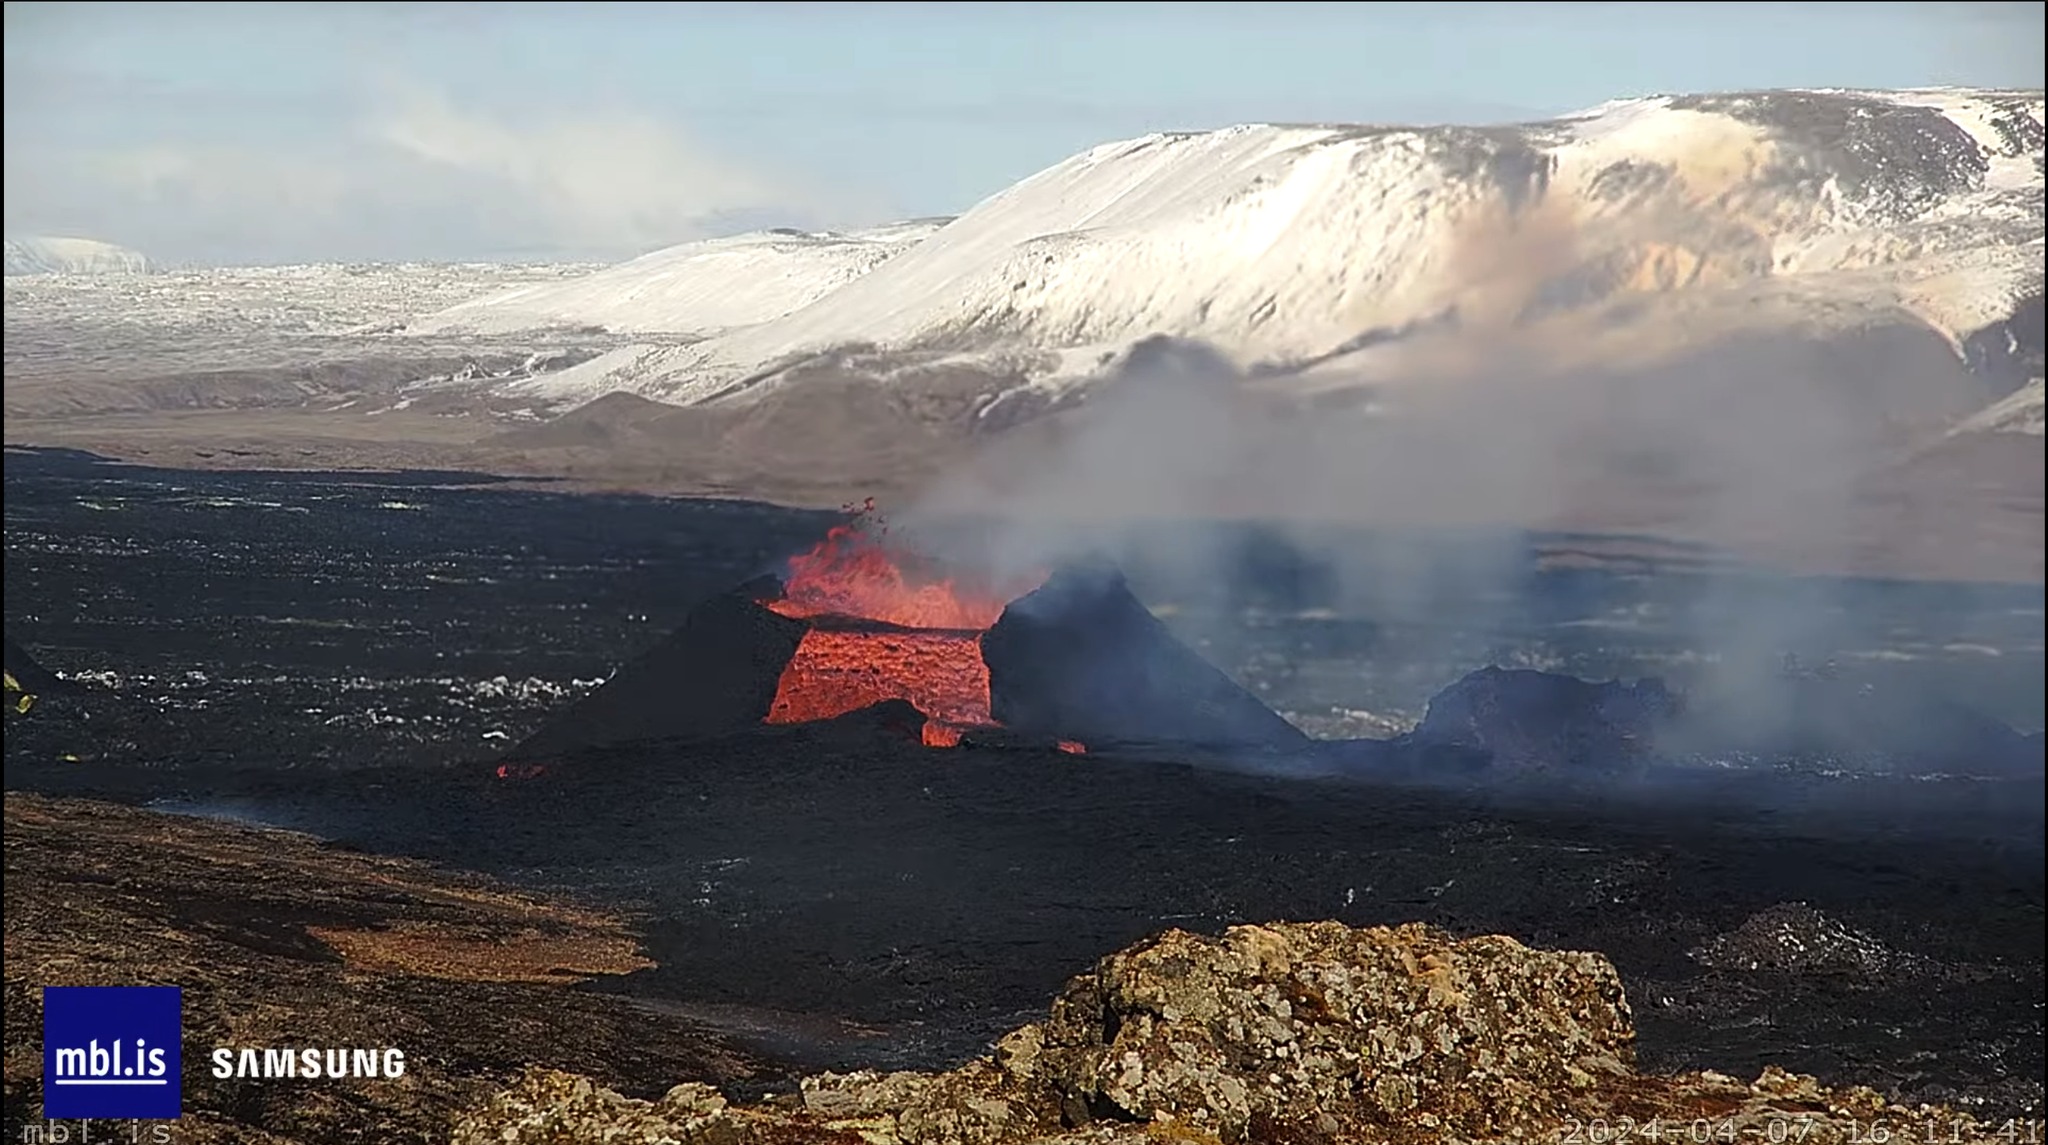
The average lava effusion rate decreased from about 6.6 cubic meters per second during 27 March-3 April to about 3.6 cubic meters per second during 3-8 April. During an overflight on 8 April observers confirmed that there had been a gradual decrease in the intensity of the eruption. The lava-flow field was an estimated 6.14 square kilometers with an approximate volume of 31.1 million cubic meters. Concurrent with a decrease in eruption intensity, inflation had accelerated. Seismicity continued to be at low levels and was concentrated between Sylingarfell and Stóra-Skógfell, and in the W part of Grindavík. Sulfur dioxide emissions continued to be high around the eruption site and were detected in residential areas downwind. On 3 April the Civil Protection Emergency Level was lowered to the middle level on a three-level scale. The Aviation Color Code remained at Orange (the second highest level on a four-color scale).
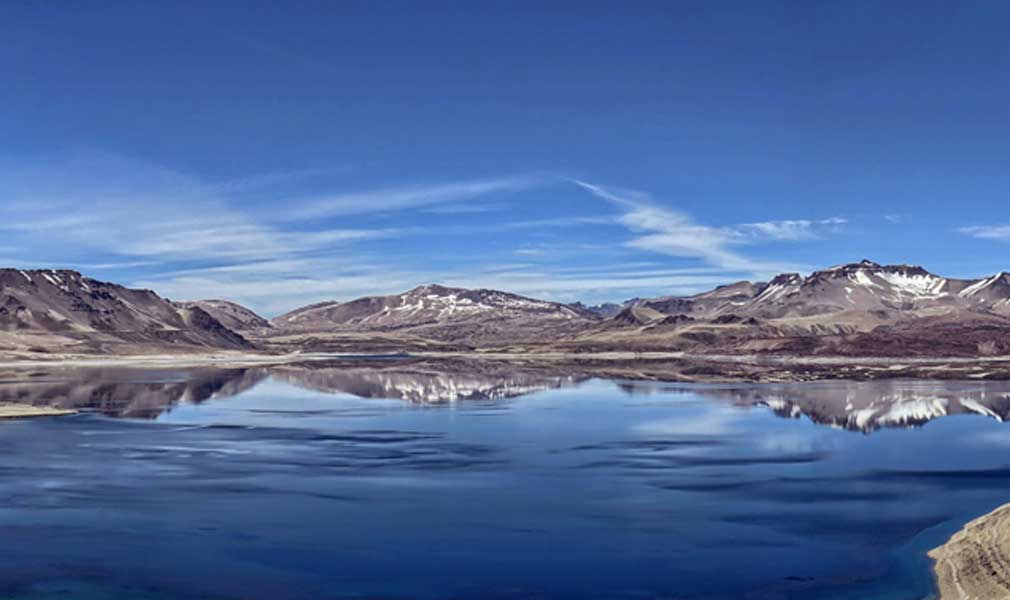
Chile , Laguna del Maule :
Seismology
The seismological activity of the period was characterized by the recording of:
1066 seismic events of type VT, associated with the fracturing of rocks (Volcano-Tectonics). The most energetic earthquake had a Local Magnitude (ML) value equal to 2.2, located 4.8 km South-South-East of the center of the lagoon, at a depth of 6.5 km.
5 LP type seismic events, associated with fluid dynamics inside the volcanic system (Long Period). The size of the largest earthquake evaluated from the Reduced Displacement (RD) parameter was equal to 1.2 cm2.
3 TR type seismic events, associated with the dynamics maintained over time of fluids inside the volcanic system (TRemor). The size of the largest earthquake evaluated from the Reduced Displacement (RD) parameter was equal to 2.9 cm2.
Fluid geochemistry
No anomalies have been reported in emissions of sulfur dioxide (SO2) into the atmosphere in the area near the volcanic complex, according to data published by the Tropopheric Monitoring Instrument, (TROPOMI) and Ozone Monitoring Instrument (OMI) Group. sulphur dioxide.
Geodesy
From data provided by 7 GNSS stations, which monitor the deformation of the volcanic complex, we observe that the inflationary process recorded since 2012 continues.
Particularly during the period evaluated, we note that:
– The distances between stations maintain the trends and magnitudes compared to the previous period, with lengthening or shortening rates which reach a maximum magnitude of 1.4 cm/month.
– The maximum vertical rise remains in the central sector of the lagoon, with a speed of 1.99 cm/month for this period, recorded at station MAU2.
– Thanks to satellite radar interferometry (InSAR), using Sentinel 1A images, we observe signals associated with a deformation of a magnitude and pattern similar to those previously recorded in the complex, with an area maximum inflation near the center of the lagoon. In particular, for this period, we observe the stabilization of the subsidence east of Laguna Fea previously reported, in accordance with GNSS data.
The process of cortical deformation continues its evolution with rates similar to those observed historically. On the surface, there are no apparent changes linked to volcanic dynamics.
From the above, we conclude that the volcanic system always records internal activity with energy levels above its basic threshold. In this way, the technical alert is maintained in yellow and the area concerned is considered to be that contained within a radius of 2 km around the passive CO2 degassing zone.
Volcanic activity remains with the recurrent recording of VT seismic activity with active sources preferentially located to the South-West, East and South-East of the center of the lagoon. The process of cortical deformation continues its evolution with rates similar to those observed historically. On the surface, there are no apparent changes linked to volcanic dynamics. From the above, we conclude that the volcanic system always records internal activity with energy levels above its basic threshold.
In this way, the technical alert is maintained in:
YELLOW TECHNICAL ALERT: Changes in the behavior of volcanic activity.
Source : Sernageomin
Photo : Senapred / Rayen Gho.
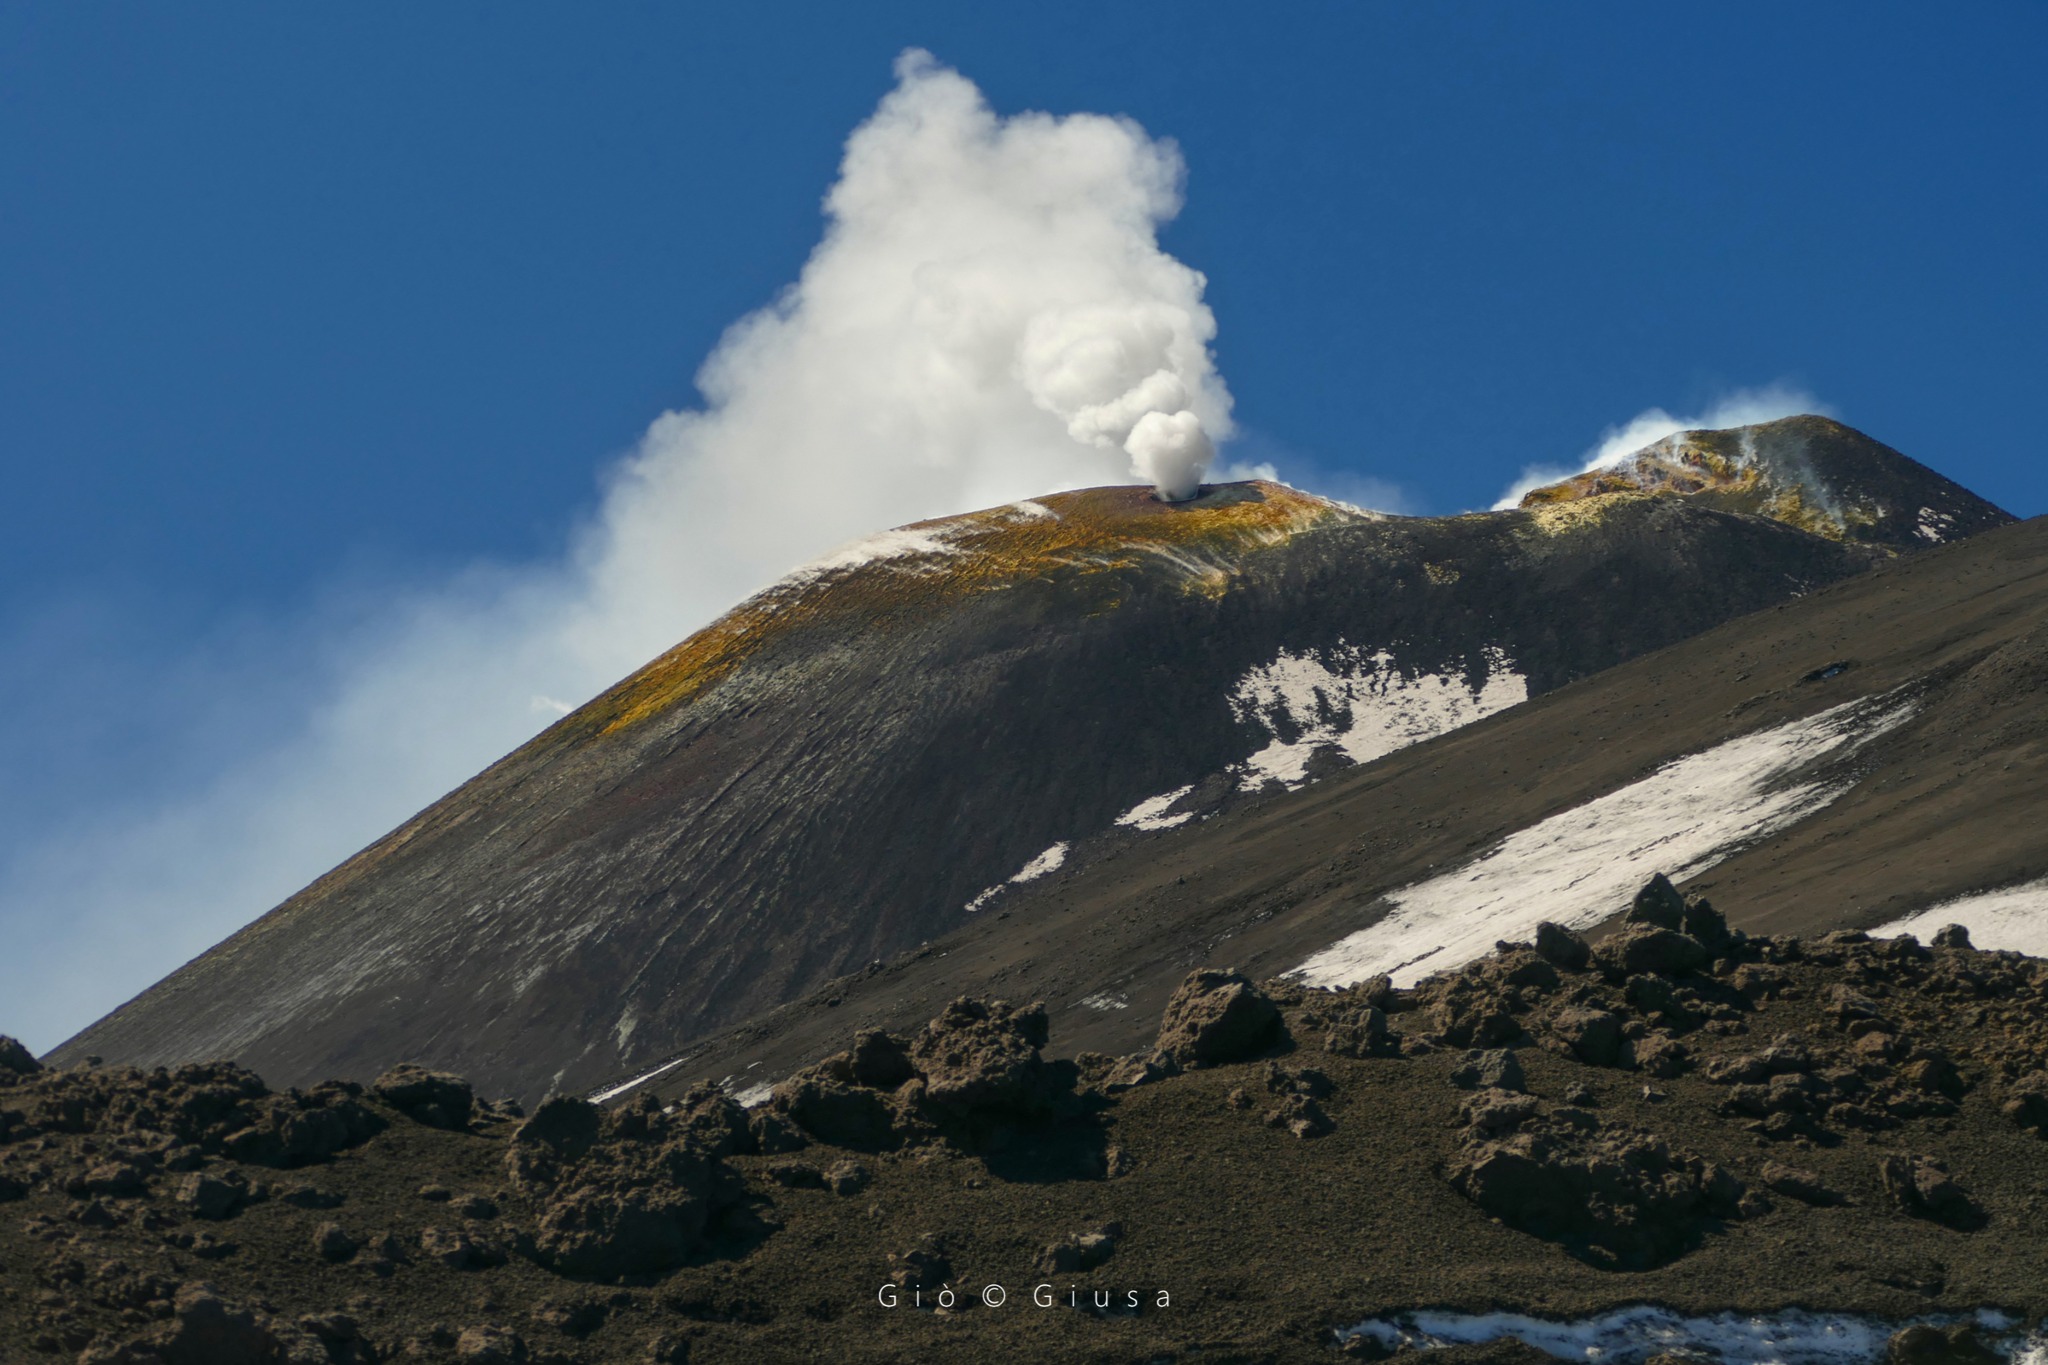
Italy / Sicily , Etna :
Communiqué on the activity of Etna, April 10, 2024 10:44 p.m. (8:44 p.m. UTC).
The National Institute of Geophysics and Volcanology, Osservatorio Etneo, reports an emission of ash visible from cameras located at the summit craters.
Further updates will be communicated shortly.
Communiqué on the activity of Etna, April 10, 2024 23:22 (21:22 UTC).
The National Institute of Geophysics and Volcanology, Osservatorio Etneo, communicates at 8:41 p.m. UTC, from surveillance cameras, a weak explosion was observed from the Southeast crater which produced a modest emission of ashes which quickly dispersed in the summit area.
As observed in recent days, even in the current state, the average amplitude of the volcanic tremor remains within the range of average values. The sources of the tremor are located under the Southeast crater, at an altitude of approximately 2,900 m above mean sea level. The infrasound signals do not show significant variations; infrasound events are exclusively located in correspondence with the South-East Crater.
Data from the inclinometer network and the GNSS network do not show significant ground deformations.
Further updates will be communicated shortly.
Source : INGV.
Photo : Gio Giusa
India , Barren Island :
Eruptive activity at Barren Island continued according to notices from the Darwin VAAC. Ash plumes identified in satellite images during 2-3 April rose 0.9-1.5 km (3,000-5,000 ft) a.s.l. and drifted SW and W. Weather conditions prevented views on 4 April. A thermal anomaly over the summit was identified in Sentinel data on 30 March and 4 April.
Barren Island, a possession of India in the Andaman Sea about 135 km NE of Port Blair in the Andaman Islands, is the only historically active volcano along the N-S volcanic arc extending between Sumatra and Burma (Myanmar). It is the emergent summit of a volcano that rises from a depth of about 2250 m. The small, uninhabited 3-km-wide island contains a roughly 2-km-wide caldera with walls 250-350 m high.
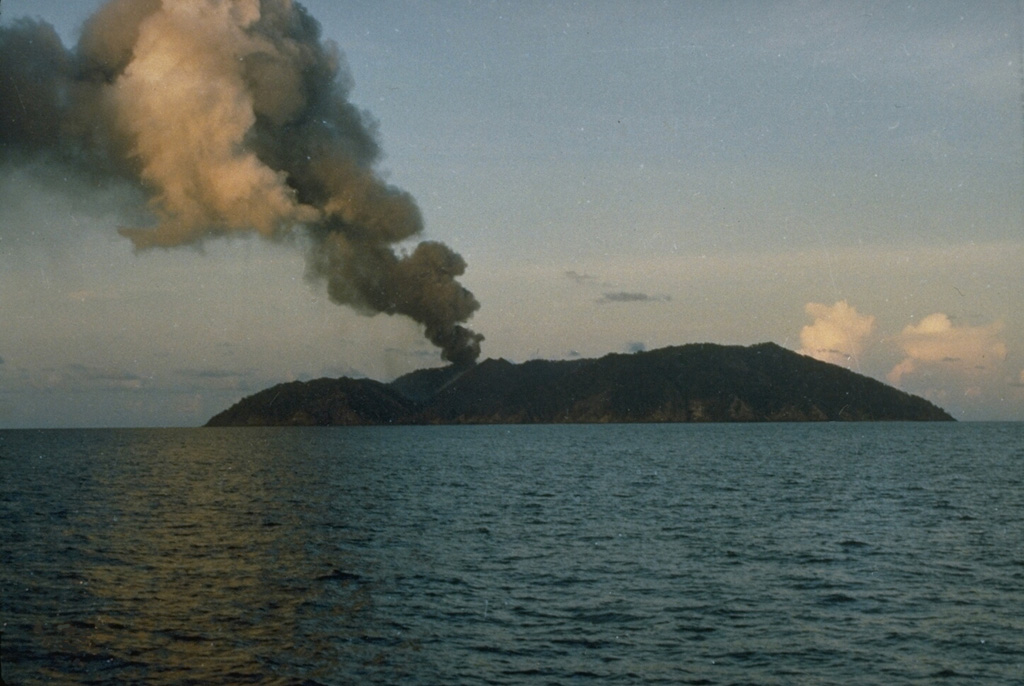
An ash plume in 1991 rises above Barren Island along the volcanic arc connecting north of Sumatra. The 3-km-wide island contains a 1.6-km-wide crater that is partially filled by a scoria cone that has been the source of eruptions since the first was recorded in 1787. Lava flows reached the coast during several recent eruptions.
The caldera, which is open to the sea on the west, was created during a major explosive eruption in the late Pleistocene that produced pyroclastic-flow and -surge deposits. Historical eruptions have changed the morphology of the pyroclastic cone in the center of the caldera, and lava flows that fill much of the caldera floor have reached the sea along the western coast.
Sources: Darwin Volcanic Ash Advisory Centre (VAAC), Copernicus
Photo : D. Haldar, 1991 (Geological Survey of India)/ GVP.
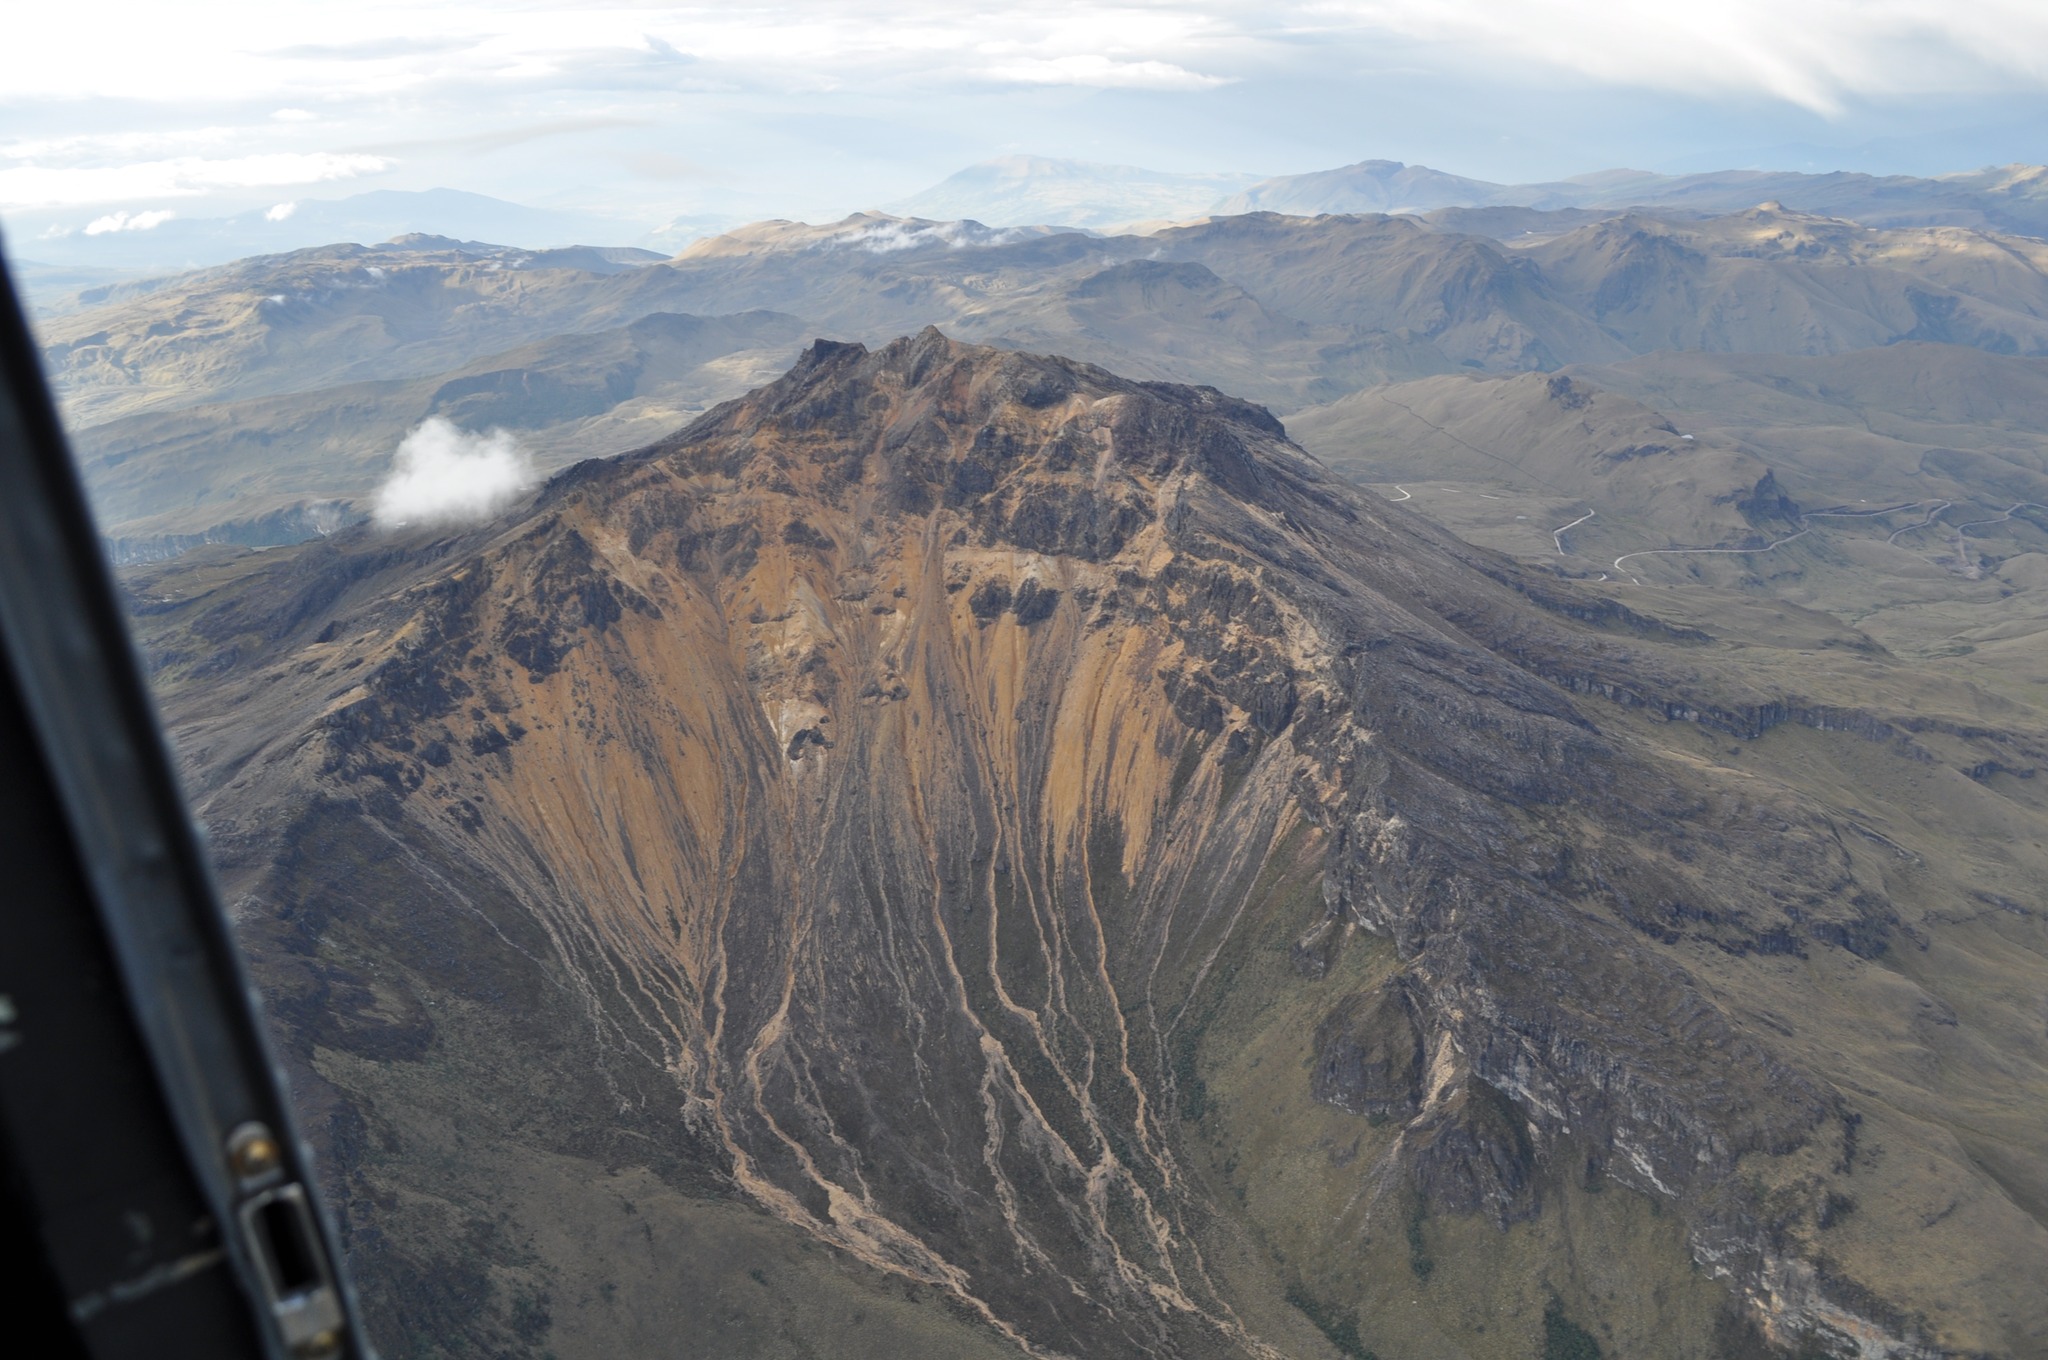
Colombia , Chiles / Cerro Negro :
Weekly Activity Bulletin: Chiles Volcanic Complex and Cerro Negro (CVCCN)
Regarding the monitoring of the activity of the CHILES AND CERRO NEGRO VOLCANOES, the MINISTRY OF MINES AND ENERGY, through the COLOMBIAN GEOLOGICAL SERVICE (SGC), reports that:
In the period between April 2 and 8, 2024 and compared to last week, seismic activity increased both in terms of occurrence and seismic energy released, maintaining the predominance of events related to fracture processes of the rocks inside the volcanic building. With values much lower than those of fracture earthquakes, the appearance of seismicity associated with the movement of fluids inside these volcanoes continues, some of them with very low frequency contents.
Fracture seismicity was located in three adjacent sources: the first, at the summit of the Chiles volcano, in the so-called collapse zone, at depths between approximately 2 and 5 km from its summit (4,700 m above sea level). altitude) and magnitudes up to 1.1. The second source was located at distances up to 7 km south-southeast of the Chiles volcano, at depths between approximately 4 and 8 km, relative to its summit (4,700 m above sea level) with maximum magnitudes of 2.4. The third source was located between 5 and 12 km southeast of Chiles, at depths between approximately 8 and 11 km, relative to its summit (4,700 m above sea level) with maximum magnitudes of 1.4.
Volcanic deformation processes recorded by sensors installed on the ground and by remote satellite sensors continue. The evolution of activity in the CVCCN is the result of internal processes derived from the complex interaction between the magmatic system, the hydrothermal system and the geological faults of the area. Thus, the probability of the occurrence of energetic earthquakes that can be felt by residents of the CVCCN zone of influence continues.
Volcanic activity remains in a YELLOW ALERT state: Active volcano with changes in the behavior of the base level of monitored parameters and other manifestations.
Source et photo : Sgc