February 12 , 2020 .
La Réunion , Piton de la Fournaise :
Activity bulletin for Tuesday, February 11 at 2:45 p.m. (local time).
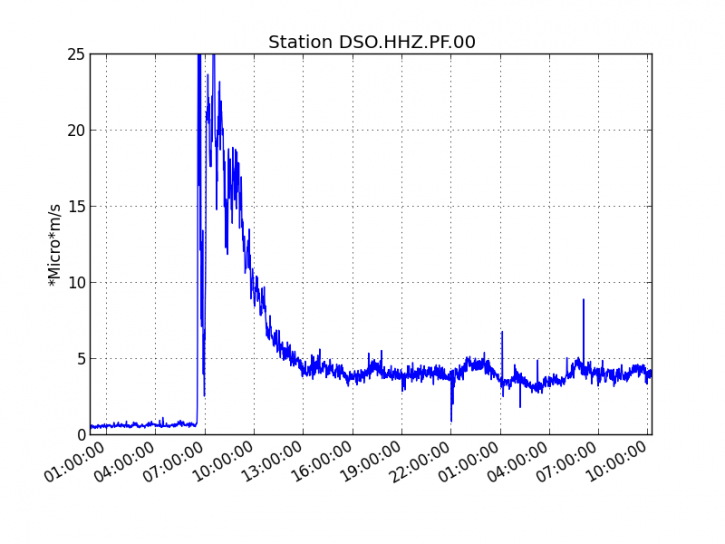
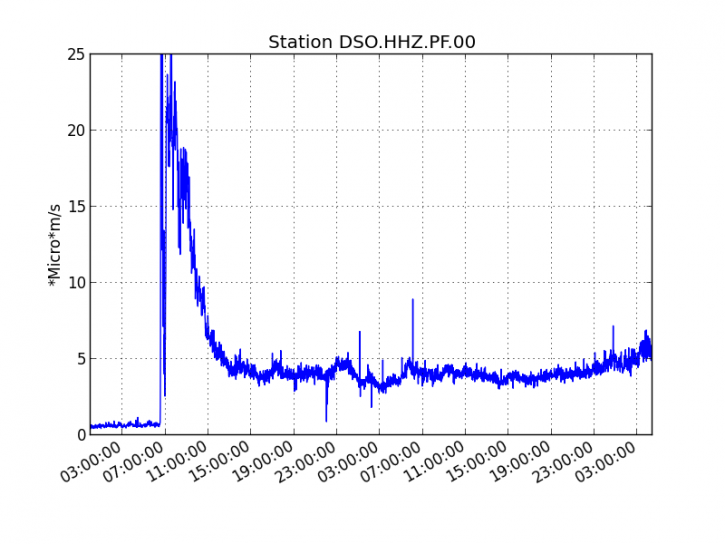
The eruption which started on 02/10/2020 at around 10:50 am local time continues. The intensity of the volcanic tremor (indicator of the intensity of the eruption), after having decreased continuously, has been relatively stable since 8:00 p.m. local time (4:00 p.m. UT) on 02/10 (Figure 1).
Figure 1: Evolution of the RSAM (indicator of the volcanic tremor and the intensity of the eruption) between 02/10/2020 and 02/11/2020 2.30 p.m. local time (10.30 a.m. UT) on the DSO seismological station located at the top of the volcano. (© OVPF / IPGP).
Since the start of the eruption, 3 deep earthquakes (> 2 km deep) have been recorded under the eastern flank of the volcano.
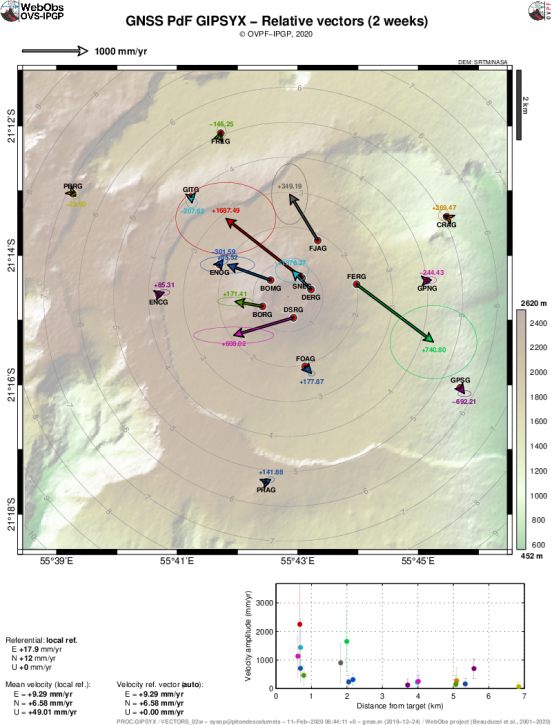
The seismic crisis which preceded the arrival of magma on the surface by about twenty minutes was accompanied by rapid deformations of relatively small amplitude which impacted only the terminal cone (12 cm max, Figures 2 and 3).
Figure 2: Map of the displacements linked to the February 10, 2020 eruption. The horizontal displacements are represented in vector form and the vertical displacements are indicated by the numerical values in color (values expressed in speed mm / year). (© OVPF-IPGP).
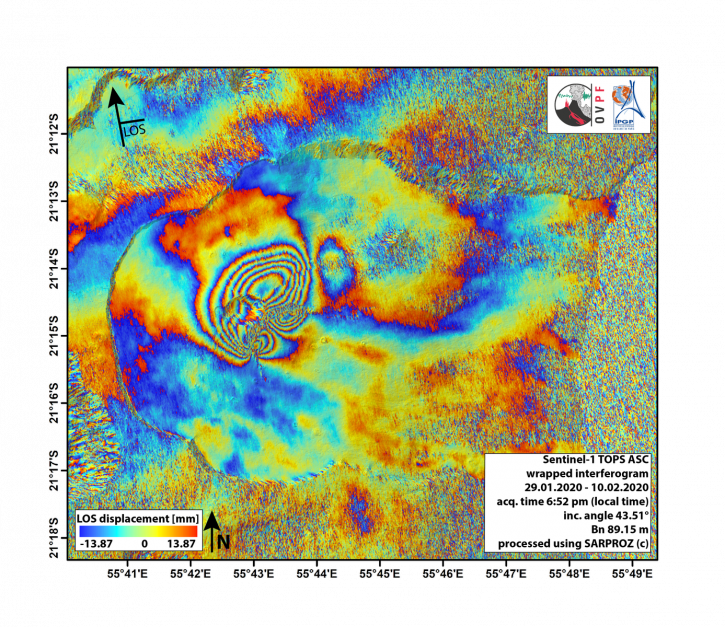
The satellite data (Figure 3) show another possible small intrusion towards the South (Château Fort sector) during the seismic crisis of 02/10. The latter was not associated with any thermal anomaly or volcanic tremor at the surface, and was therefore most certainly not responsible for the emission of lava at the surface (to be confirmed when favorable weather conditions returned).
Figure 3: Interferogram representing the deformations at Piton de la Fournaise associated with the February 10, 2020 eruption (© OVPF-IPGP). In addition to ground measurements, the OVPF also uses a satellite technique called dInSAR to monitor the building’s inflation / deflation cycles associated with magma movements at depth. For this, the satellite “illuminates” an area of the ground with an electromagnetic wave and collects the signal reflected from the ground. The comparison of two measurements of this type of the same surface taken at different times makes it possible to image the deformations of the surface. The interferogram above shows the deformation of the surface associated with the eruption of February 10, 2020. Each complete color cycle (from red to blue) of the interferogram corresponds to 27.8 mm of displacement from the surface to (positive) or opposite (negative) of the Sentinel-1 satellite (whose direction is represented by the arrow « LOS » at the top right of the figure). (© OVPF / IPGP)
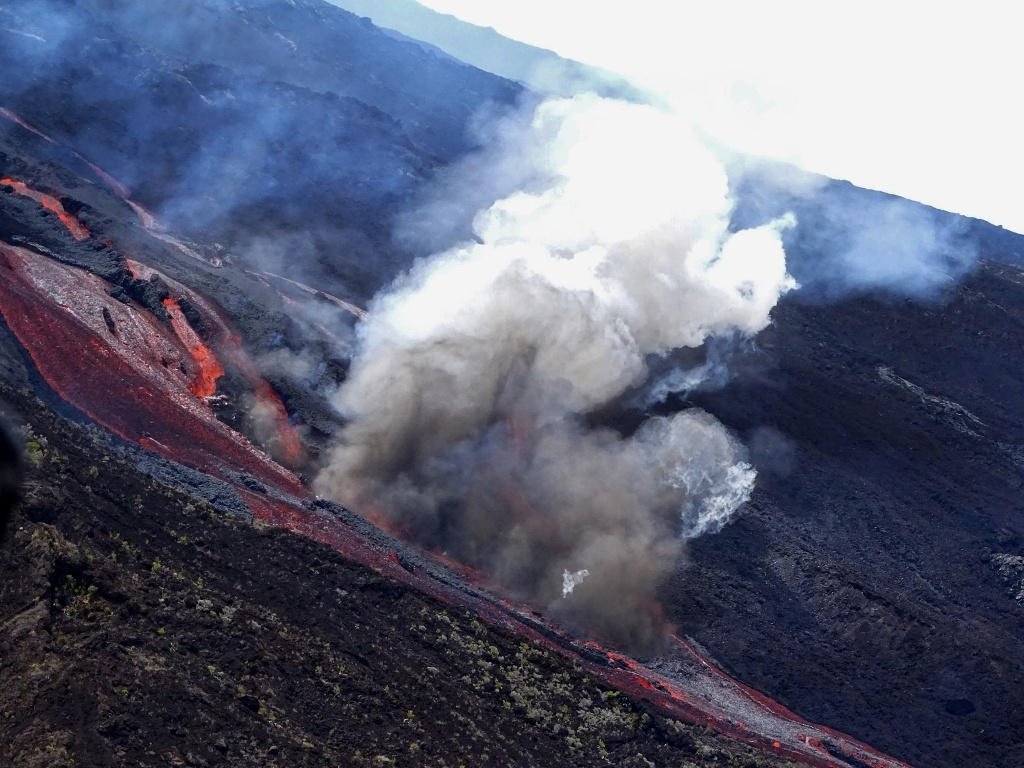
Due to bad weather conditions no reconnaissance could be carried out today, but the low flows probably did not allow the casting front to progress significantly since the last observatory survey which located it around 1700 m altitude (in the early afternoon on 10/02).
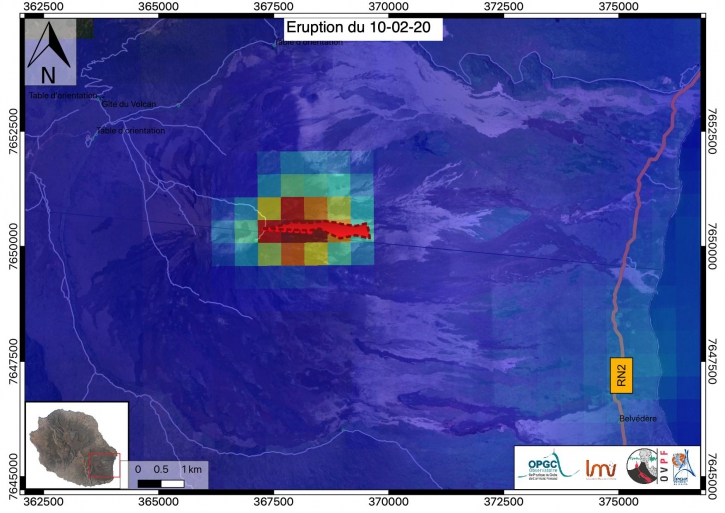
Satellite data from the MIROVA platform (MODIS data, University of Turin) show a thermal anomaly noted at 10:45 pm (local time) of low amplitude localized at the level of the eruptive cracks (Figure 4).
Figure 4: Superposition of thermal anomaly registered by Mirova platform (MODIS Database, University of Turin) the 10/02 and 22:45 and the approximate contour of the lava observed 10/02 between 13h and 1:30 p.m. local time. (© Mirova / OPGC / LMV / OVPF / IPGP).
Activity bulletin of February 12, 2020 at 8.45 a.m. (local time).
The eruption which started on 02/10/2020 at around 10:50 am local time continues. The intensity of the volcanic tremor (indicator of the intensity of the eruption) has been relatively stable over the past 24 hours (Figure 1). The increase in the tremor observed around 3 a.m. local time (11 p.m. UT; Figure 1) is related to the arrival of a rainy and stormy front on the volcano which noises the signals.
Figure 1: Evolution of the RSAM (indicator of the volcanic tremor and the intensity of the eruption) between 10/02/2020 and 12/02/2020 08:30 local time (04:30 UT) on the DSO seismological station located at the top of the volcano. (© OVPF / IPGP).
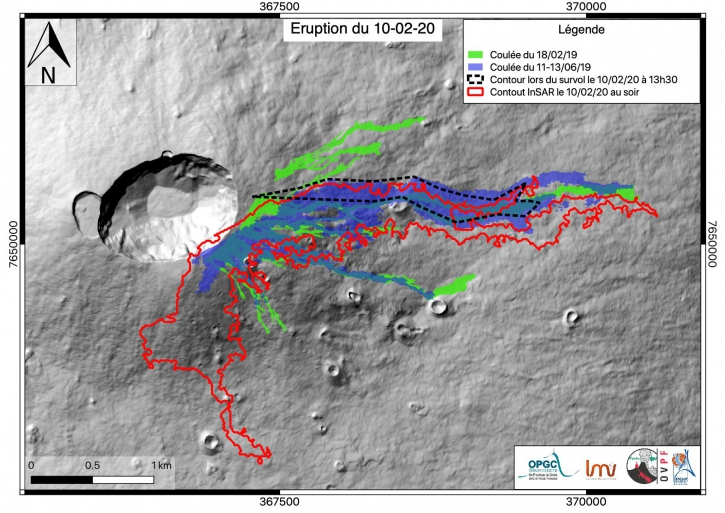
A precise mapping of the lava flow on 02/10/2019 in the evening carried out by the OI2 platform (OPGC – Clermont Auvergne University) from satellite data shows a greater extension of the flows than that estimated until then, with a lava field on the upper part of the terminal cone and an arm of flow which flowed towards the south. During the flyover on 10/02 between 1 p.m. and 1:30 p.m., the upper part of the summit, heavily clouded, did not allow them to be observed. These most upstream and most southerly flows were most certainly only active during the first hours of the eruption. Currently only the north arm flowing east remains active.
This new mapping shows a flow front at an altitude of around 1,400 m.
It is remarkable to note that the highest cracks in altitude (not visible during the flyover of 10/02 and now inactive) opened in the same sector as the cracks of the eruptions of February 18 and June 11, 2019 (Figure 2) . This localization shows that the dike (« superficial conduit taking root in a reservoir and allowing the delivery of magma to the surface ») which fed this eruption has taken up in depth a « path » already opened during previous eruptions, explaining the speed that the magma took to reach the surface (23 minutes between the start of the seismic crisis and the opening of the first eruptive cracks on the surface).
Figure 2: In red the outline of the lava flows associated with the eruptive episode of 02/10/2020 determined from satellite data acquired by the OI2 platform (Clermont Auvergne University), dated 02/10/2020 in the evening . In black dotted lines, the approximate contour of the active flow arm visible during the overflight on 02/10/2020 at 1:15 p.m. (the south and the summit of the terminal cone were then under the clouds). For comparison, in green the outline of the lava field of the eruption of 02/18/2019 and in blue that of the eruption of June 11-13, 2019 (© OPGC / LMV / OVPF / IPGP).
The estimated surface flows, from satellite data via the HOTVOLC (OPGC – University of Auvergne) and MIROVA (University of Turin) platforms, are highly disturbed due to bad weather conditions which attenuate the satellite signals. However, a peak was detected yesterday at 3:45 p.m. (local time) thanks to a thinning on the HOTVOLC platform at 10 m3 / s.
Source : OVPF .
Read the articles : http://www.ipgp.fr/fr/ovpf/bulletin-dactivite-mardi-11-fevrier-a-14h45-heure-locale
http://www.ipgp.fr/fr/ovpf/bulletin-dactivite-12-fevrier-2020-a-08h45-heure-locale
Photo : IPR / Twitter via Bernard Duyck.
Italy / Sicily , Etna :
Weekly bulletin from 03/02/2020 to 09/02/2020 (date of issue 11/02/2020)
SUMMARY OF THE ACTIVITY STATUS.
In light of the monitoring data, it is highlighted:
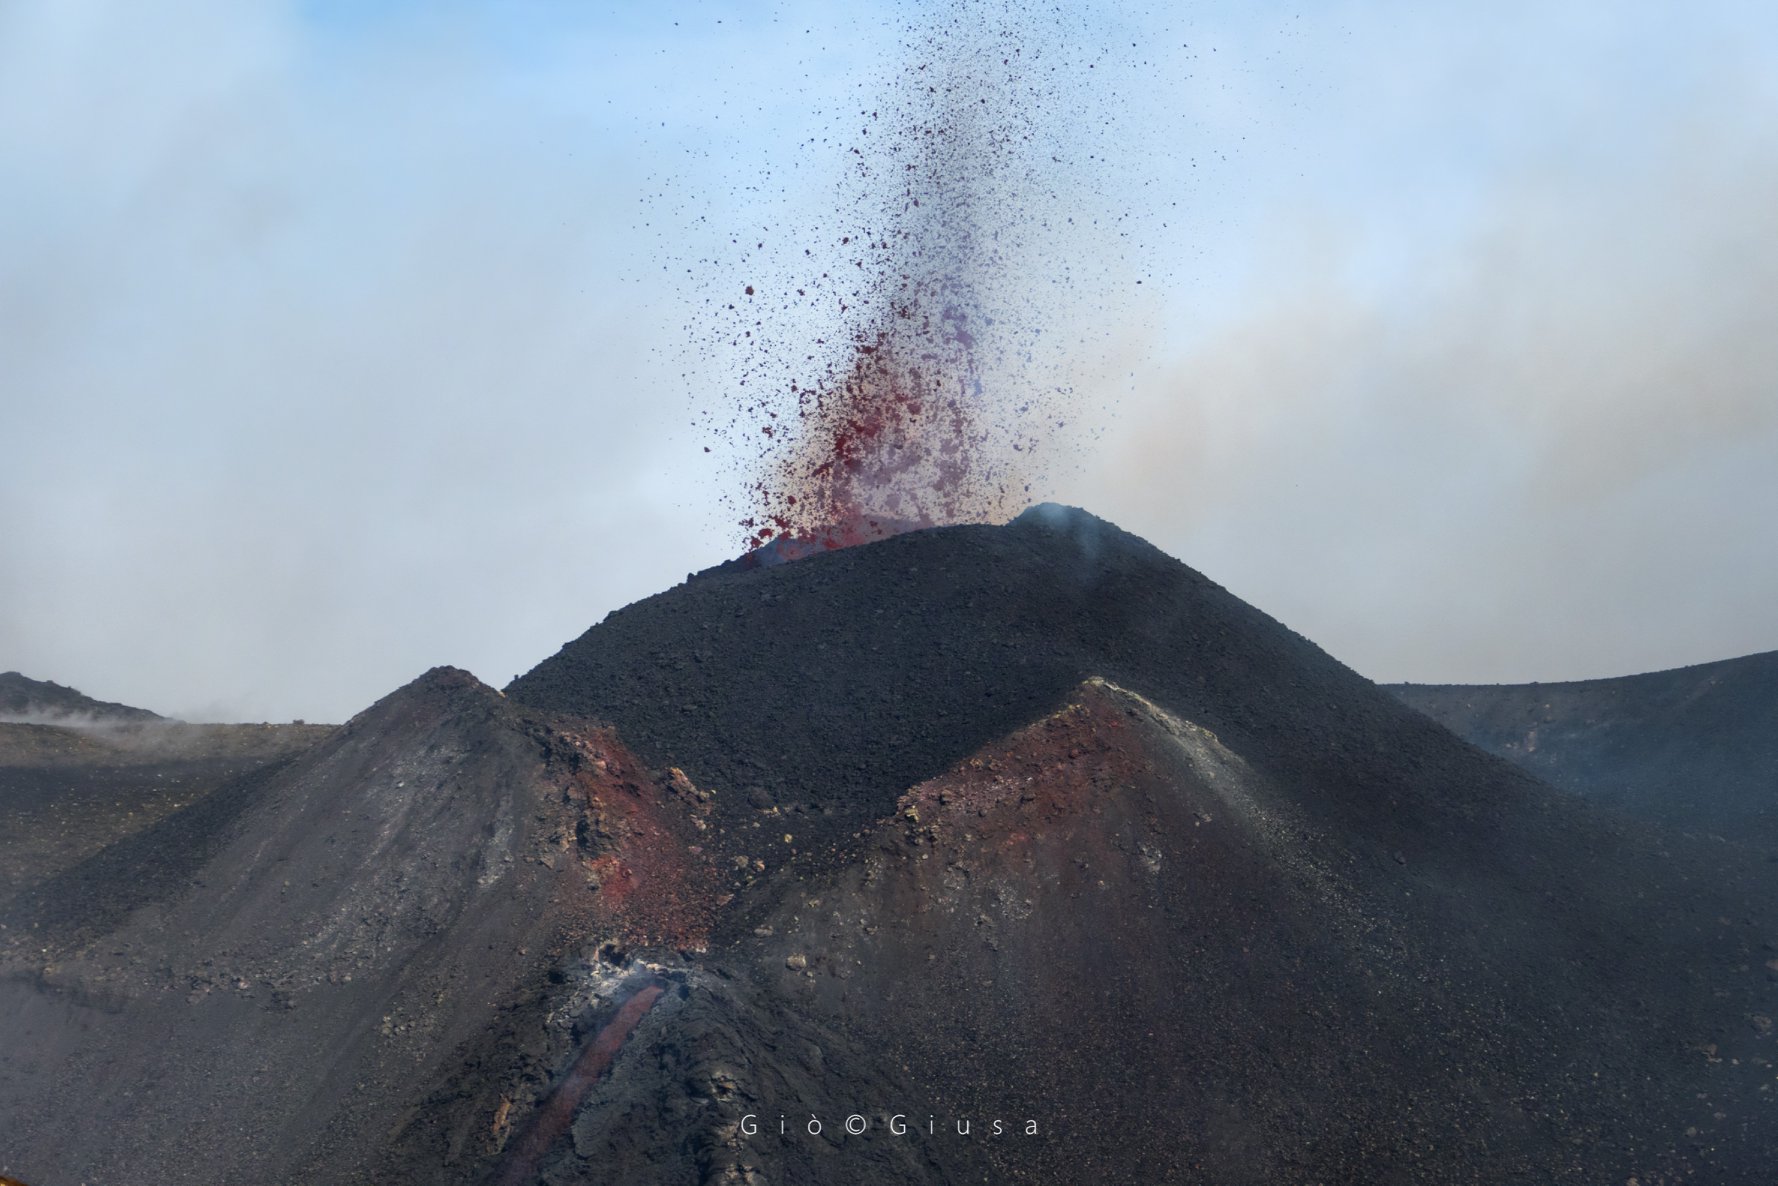
1) VOLCANOLOGICAL OBSERVATIONS: Strombolian and effusive intra-crater activity of the Voragine crater, weak and discontinuous emission of ashes from the New South-East Crater and the North-East Crater, ordinary degassing activity of the upper craters.
2) SEISMOLOGY: Low seismic fracturing activity; amplitude of the volcanic tremor mainly at the medium level.
3) INFRASOUND: Moderate infrasonic activity.
4) DEFORMATIONS: The Etna soil deformation monitoring networks have not shown any significant variation to report in the past week
5) GEOCHEMISTRY: The fluxes of SO2 and HCl are placed at a medium-low level. Soil CO2 flow values are low to medium. The partial pressure of dissolved CO2 does not show significant variations. The isotopic ratio of helium (data from January 28) confirms medium-high values. No update on the CO2 / SO2 ratio is available. The last figure for January relates to average values.
VOLCANOLOGICAL OBSERVATIONS
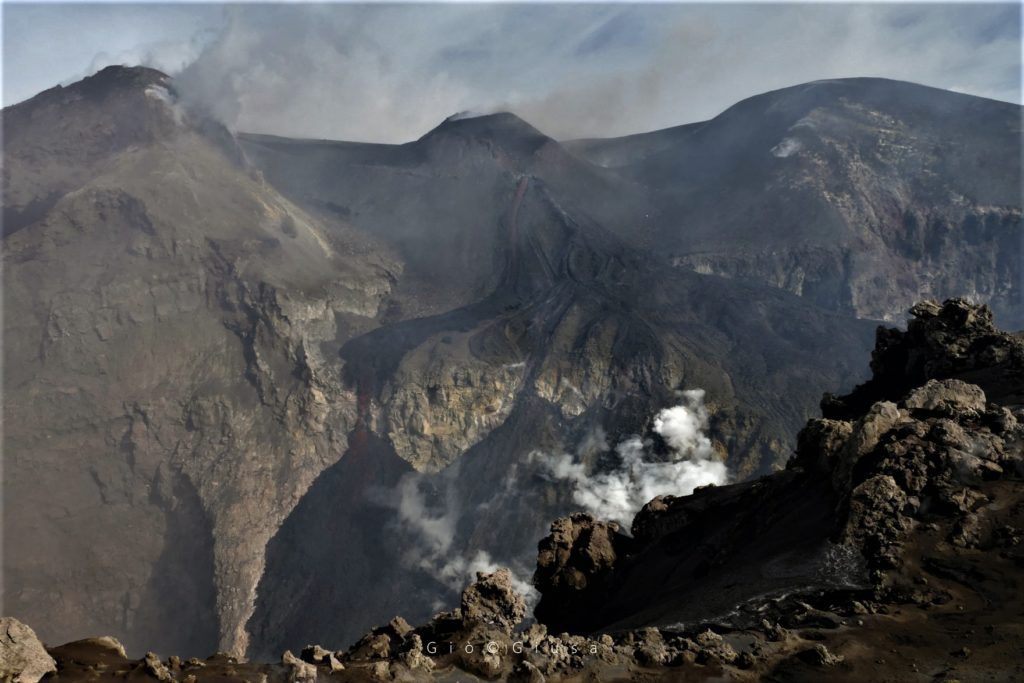
During the observation period, the volcanic activity of Etna was monitored by analyzing the images of the surveillance cameras of the INGV-Osservatorio Etneo (INGV-OE), by analyzing the images recorded during the overflight on Monday 3 February, which was carried out thanks to the helicopter made available by the 2nd Air Corps of the Coast Guard of Catania, and finally through several inspections by INGV-OE staff, including one in the summit area. During the period considered, the activity of Etna was mainly characterized by an eruptive activity of the Voragine crater (VOR), by soft and discontinuous ash emissions from the Northeast crater (NEC) and New Southeast Crater (NSEC) and by the ordinary degassing of the other summit craters.
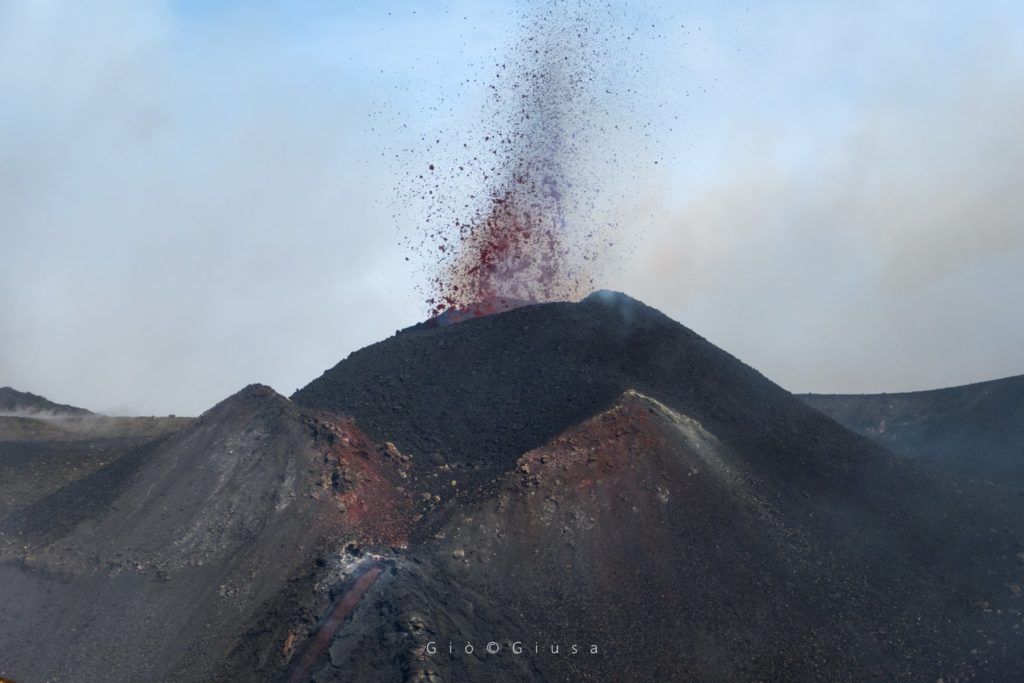
The strombolian intra crater activity continues in the Voragine crater which emits shreds which extend a few hundred meters beyond the edge of the crater and which have led to new growth of the slag cone, in particular in its northern part. In addition, as already mentioned in the previous press release (Rep. N ° 06/2020), the low ash emissions produced by Voragine continue to disperse rapidly in the atmosphere.
The continuous effusive activity of the southern flank of the intra crater cone pours into the adjacent Bocca Nuova. Observations made in the field and images recorded during the helicopter overflight showed that lava filled the eastern sector (BN-2) and reached, spilling inside the crater of the western well (BN-1) . As for the New South-East Crater (NSEC), the thermal images recorded during the overflight on February 3 showed mainly fumarolic activity. Instead, as of February 4, NSEC also produced weak discontinuous episodes of volcanic ash emission observed both by images recorded by surveillance cameras and by INGV-OE personnel in the field . Finally, the northeast crater also produced light and intermittent ash emissions observed by surveillance cameras.
Volcanic tremors: The average amplitude of volcanic tremors, although not showing significant variations, in general, presented a modest downward trend, with values which from medium to high, recorded in the first half of the week, were exclusively in the middle level for the past few days. The sources of the tremor were located under the summit craters, in the altitude range between 2000 and 2700 m above mean sea level.
Source : INGV .
Read the article : file:///C:/Users/Utilisateur/AppData/Local/Packages/Microsoft.MicrosoftEdge_8wekyb3d8bbwe/TempState/Downloads/BollettinoEtna20200211%20(1).pdf
Photos : Gio Giusa.
Colombia , Nevado del Ruiz :
Weekly bulletin of the Nevado del Ruiz volcano
The level of activity continues at the level yellow or (III): changes in the behavior of volcanic activity.
Regarding the monitoring of the activity of the Nevado del Ruiz volcano, the COLOMBIAN GEOLOGICAL SERVICE reports that:
The Nevado del Ruiz volcano continues with an unstable behavior. During the past week, some of the parameters monitored have shown variations reflecting the instability of the volcanic system. An acceleration of the volcanic process and consequently changes in the level of activity of the volcano cannot be excluded.
https://www.facebook.com/sgcolombiano/videos/586287771922319/
The seismicity generated by the fracturing of rocks (volcano-tectonic type) decreased in number of earthquakes and increased in released seismic energy, compared to the previous week. This type of seismicity was mainly located in the South-South-West and North-East sectors of the volcano and, to a lesser extent, in the North, South-East sectors and the Arenas crater. The depth of the earthquakes ranged from 0.9 to 6.2 km. The maximum magnitude recorded during the week was 1.8 ML (local magnitude), corresponding to the earthquake recorded on February 6 at 8:17 a.m. (local time), located 4.3 km north of the Arenas crater, at 5 , 5 km deep.
During the week, there were several episodes of « Drumbeat » type seismicity, volcano-tectonic earthquakes, on February 8 and 9. These episodes were characterized by a low level of energy and, in general, a short duration. This type of seismicity is linked to the processes of ascent and evolution of the dome on the surface of the volcano.
The seismicity linked to the dynamics of the fluids inside the volcanic conduits showed an increase both in the number of recorded events and in the seismic energy released, compared to the previous week. This seismic activity has been characterized by the presence of continuous volcanic tremors, pulses of volcanic tremors, long period and very long period earthquakes.
The earthquakes presented varying energy levels and spectral content. Some of these signals were associated with small emissions of gas and ash, confirmed by cameras installed on the volcano and by reports from field personnel.
The deformation of the volcanic surface, measured from electronic inclinometers and GNSS (Global Navigation Satellite System) stations, showed some minor changes during the week.
Following information provided on the Mirova and NASA FIRMS web portals, they have reported several low to moderate energy thermal anomalies on the volcano in the past week.
The Nevado del Ruiz volcano continues at the yellow activity level.
Source : SGC.
Peru , Ubinas :
Analysis period: February 3 to 9, 2020. Arequipa, February 10, 2020
Alert level: ORANGE
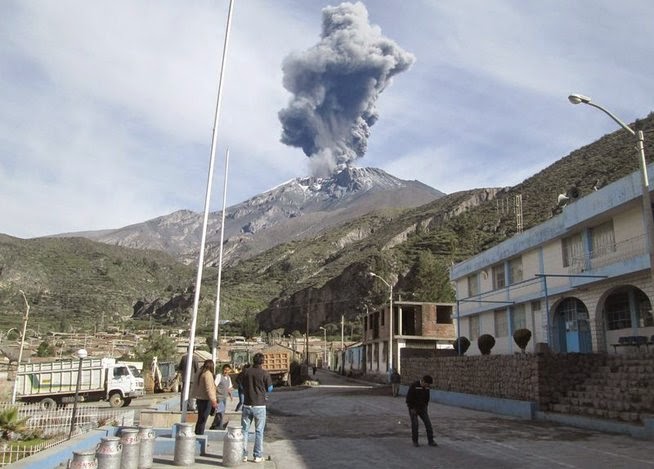
The Geophysical Institute of Peru (IGP) reports that the eruptive activity of the Ubinas volcano remains at low levels. To date, the recording of earthquakes associated with the rise of magma to the surface is rare. There are weak and sporadic emissions of bluish gases (of magmatic origin) and water vapor. According to this scenario, the possibility of volcanic explosions and / or ash emissions is low.
During the period from February 3 to 9, 2020, the IGP recorded and analyzed a total of 52 seismic events associated with the dynamic behavior of the Ubinas volcano, with the predominance of seismic signals of the Volcano-Tectonic (VT) type, related to the fracturing of rocks inside the volcano. This type of event presented an average of 3 earthquakes per day, all of magnitude less than M1.8. The seismic signals linked to the rise of magma (hybrid type) decreased both in number of events (3 daily earthquakes) and in energy.
Visual surveillance, although limited by cloud cover at this time of the year, records slight emissions of volcanic gases and water vapor that have reached maximum heights of 300 m. Monitoring the deformation of the volcanic structure, using GNSS data (processed with fast orbits), does not record any anomalies. MIROVA satellite surveillance also did not record thermal anomalies in the volcano.
Posted on 11/02/2020 16:50
Observations:
A seismic signal is recorded associated with the descent of a lahar of low to moderate volume (volcanic flows) along the southeast flank of the Ubinas volcano, along the Volcanmayo gorges, at a distance of approximately 2 km from the city of Ubinas. It is recommended that people stay away and avoid driving on the road that crosses the course of this river.
Source : IGP.
Photo :Unknown author.

