November 13 , 2019.
Italy / Sicily , Etna :
Weekly activity bulletin: ETNA, 04 November 2019 – 10 November 2019 (publication date 12 November 2019).
SUMMARY OF THE STATUS OF THE ACTIVITY
In light of the surveillance data, we highlight:
VOLCANOLOGICAL OBSERVATIONS: Strombolian intra-crateric activity in the craters of the Bocca Nuova, Voragine and New Craters of the South-East, associated with modest ash emissions. Ordinary degassing activity of the Northeast crater with occasional light ash emissions.
SISMOLOGY: Low seismic activity due to fracturing; average amplitude of the tremor oscillating around the medium to high values.
INFRASONS: Very low infrasonic activity.
DEFORMATIONS: Tilt and GPS networks did not detect any significant changes in previously reported trends.
GEOCHIMY: SO2 flows are at an average level. Underlying CO2 flows confirm a slightly upward trend, reaching average values. The partial pressure of CO2 in the soil does not show any significant changes. Helium isotope ratio values show a further increase, reaching medium-high values (latest available data on October 30).
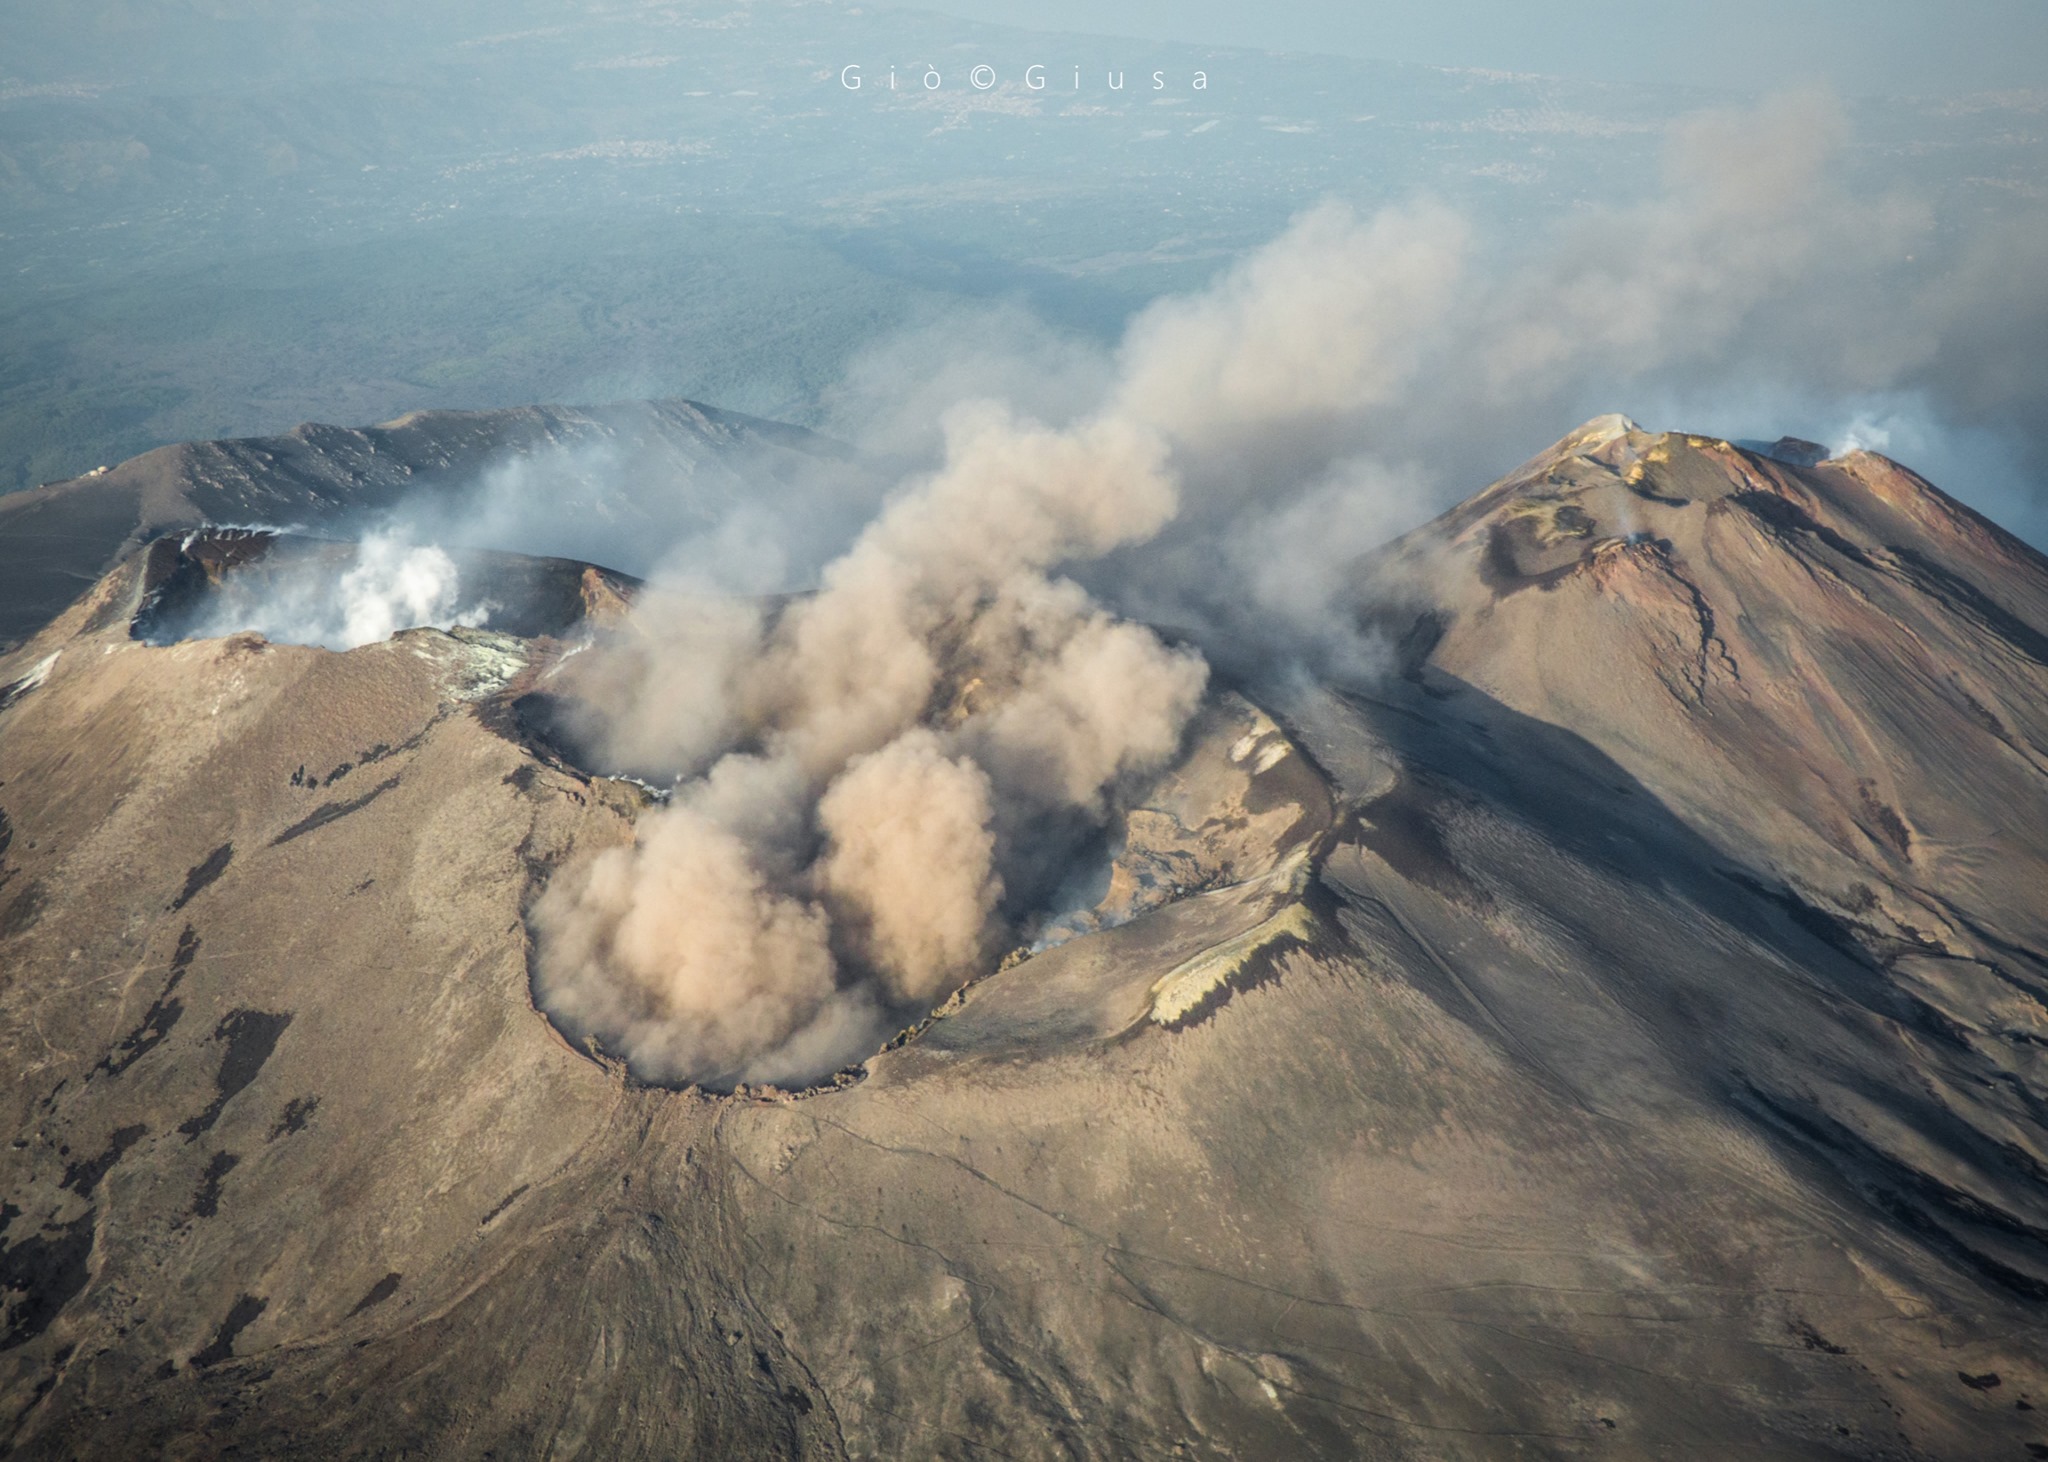
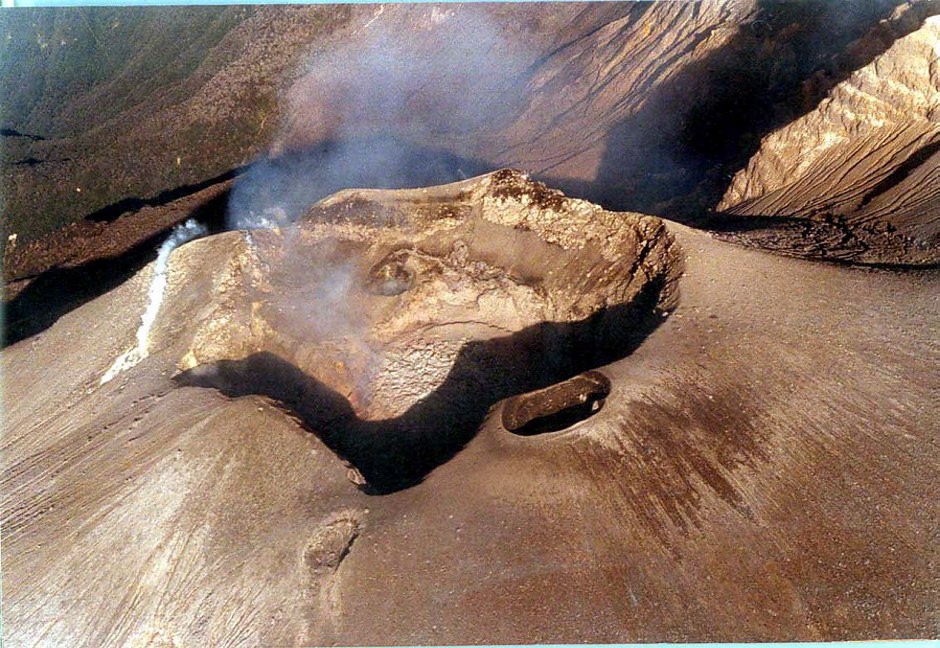
CRATERS OF SUMMIT OF MOUNT ETNA 2019
The craters of the summit of Etna. In the center with the emission of ashes the Bocca Nuova and the Voragine, behind left the crater North-East (Summit 3324m.), On the right the complex of Crater South-East.
VOLCANOLOGICAL OBSERVATIONS:
The monitoring of the volcanic activity of Etna between 4 and 10 November 2019 was carried out by analyzing the images acquired by the network of surveillance cameras INGV – Catania Section, Osservatorio Etneo (INGV-OE) and by inspections carried out in the area of the summit. During the period under review, Etna’s activity consisted of explosive Strombolian activity in the craters of Voragine, Bocca Nuova and, more conservatively, in the New Crater of the Southeast. This activity was accompanied by modest ash emissions and degassing activities with variable intensity and intensity depending on the summit craters.
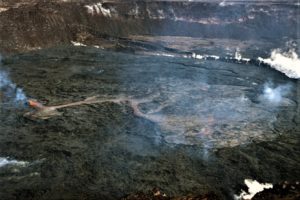
In detail, in the crater of Bocca Nuova, a deep intracratic Strombolian activity was observed, accompanied by gas under pressure and occasional modest emissions of ash which quickly dispersed near the summit. While the explosive activity of Voragine was also intra-crateric, it sometimes resulted in the launching of incandescent materials at heights above the edge of the crater. This activity is fed by two active mouths inside the cone of slag formed in September during strombolian activity of Voragine.
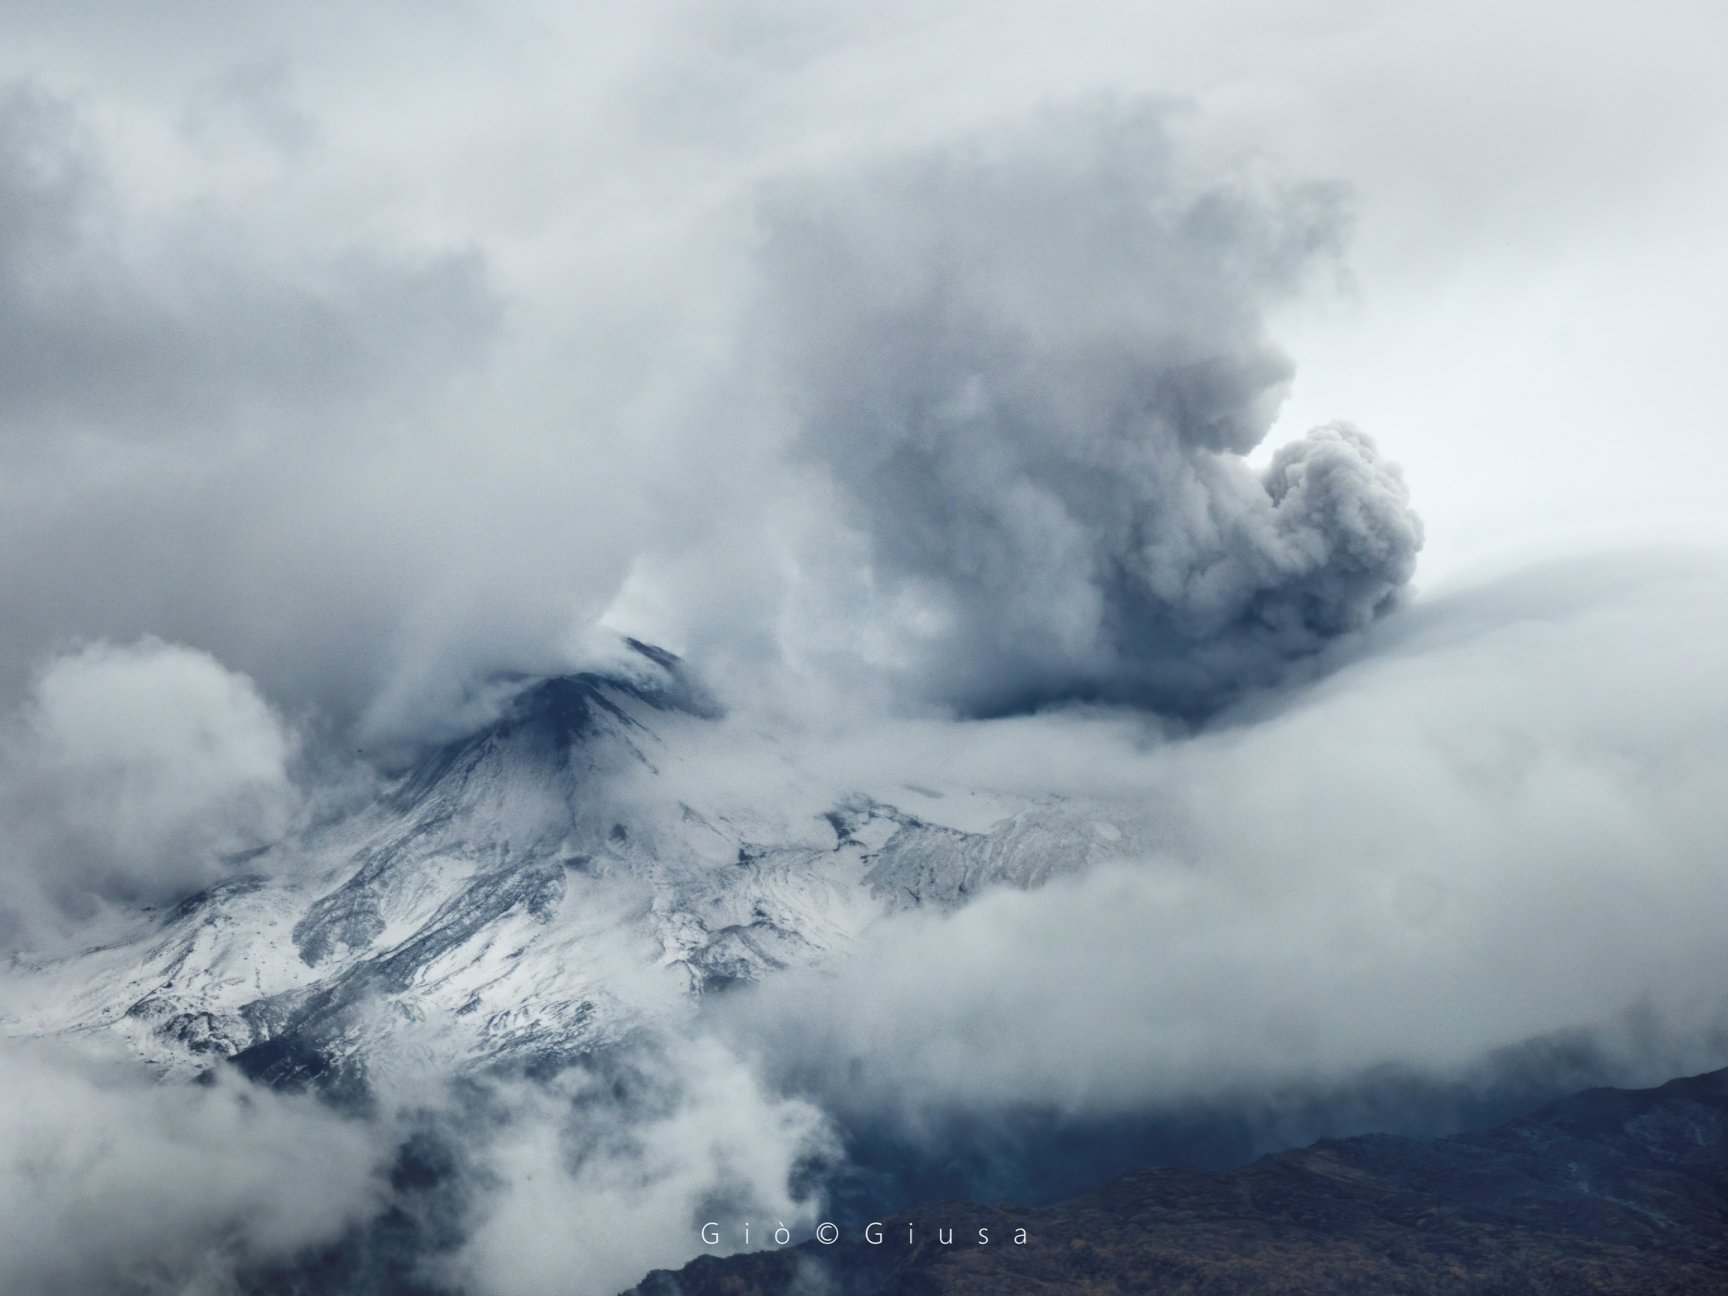
« chaos » in altitude.
Significant emissions of steam and gas, clouds, fog and snow (and / or hail). Here is a photo taken at 10:35 am on November 7, 2019 from the Etna summit region.
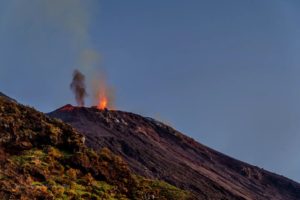
During the week, surveillance camera images also observed small, isolated, intermittent explosions from the East Vent of the New Southeast Crater, which produced fine materials rapidly. scattered in the atmosphere … / …
Volcanic tremor: During the week in question, the average amplitude of volcanic tremor fluctuated between medium to high values. The sources of tremor were located below the craters of the summit, between 2700 and 3000 m altitude above mean sea level
Source : INGV.
Read the article : file:///C:/Users/Utilisateur/AppData/Local/Packages/Microsoft.MicrosoftEdge_8wekyb3d8bbwe/TempState/Downloads/BollettinoEtna20191112%20(1).pdf
Photo : Gio Giusa .
Colombia , Chiles / Cerro Negro :
Weekly activity bulletin of Chiles and Cerro Negro volcanoes.
The activity level of volcanoes continues at the level: YELLOW LEVEL ■ (III): CHANGES IN THE BEHAVIOR OF THE VOLCANIC ACTIVITY.
Following the monitoring of the VOLCANS CHILES AND CERRO NEGRO activities, the COLOMBIAN GEOLOGICAL SERVICE (SGC) reports that:
For the period evaluated between November 5 and 11, 2019, seismic activity in the Chile – Cerro Negro volcanoes region increased three – fold from the previous week, from 568 to 1705 earthquakes classified as volcano – tectonic ( VT), associated with fractures of rock materials in the volcanic building. With regard to the energy level, there has been no significant change.
The earthquakes were located in three epicentral areas: one between Chiles and Cerro Negro volcanoes, 1.8 km east of Cerro Negro volcano at depths of up to 4 km; another at a maximum distance of 5 km southwest of Chiles volcano, at a maximum depth of 6 km, and a further distal (up to 8.5 km) and deeper (up to 9 km) located at South of Chiles volcano. The maximum local magnitude recorded was M2.4 and no earthquake was felt in the area of influence.
The Colombian Geological Service and the Institute of Geophysics of the National Polytechnic School of Ecuador are attentive to the evolution of the volcanic phenomenon and inform in a timely manner of observed changes.
Source : SGC
Photo :Unknown author .
Hawaii , Laupāhoehoe :
Magnitude-4.9 earthquake southwest of Laupāhoehoe, Hawai‘i
The U.S. Geological Survey’s Hawaiian Volcano Observatory (HVO) recorded a magnitude-4.9 earthquake on Monday, November 11, just before 6:36 a.m. HST. This magnitude may be refined as HVO seismologists continue to analyze the earthquake.
The earthquake was located 17 km (about 11 mi) southwest of Laupāhoehoe on the Island of Hawai‘i at a depth of 33 km (20 mi). A map showing the location of the earthquake is posted on HVO’s website
Light to moderate shaking, with a maximum Intensity of V on the Mercalli Intensity Scale, has been reported around the Island of Hawai‘i, with weak shaking reported from as far away as O‘ahu. The USGS « Did you feel it? » service (http://earthquake.usgs.gov/dyfi/) received over 1000 felt reports within an hour of the earthquake.

A high-precision Global Positioning System (GPS) survey is completed annually on Mauna Loa. This station was occupied for a period of three days to supplement the continuously operating GPS stations on the volcano. A beautiful view of Mauna Kea (in distance) could seen from this site during the GPS survey.
A magnitude-2.6 foreshock occurred in the same area about three minutes prior to the mainshock. Aftershocks have already been recorded; more are likely, and some could be felt.
The depth, location, and recorded seismic waves of the M4.9 earthquake suggest a source due to bending of the oceanic plate from the weight of the volcanoes in the Hawaiian Island chain, a common source for earthquakes in this area.
According to HVO Scientist-in-Charge Tina Neal, « HVO monitoring networks have not detected any significant changes in activity on Kilauea or Mauna Loa Volcanoes due to the earthquake. » The Pacific Tsunami Warning Center has stated that there is no tsunami threat from this earthquake. Hawaii County Civil Defense reports that Department of Public Works personnel will be checking roadways in the area for rockfalls.
Source : HVO.
Photo : USGS par R. Kramer.
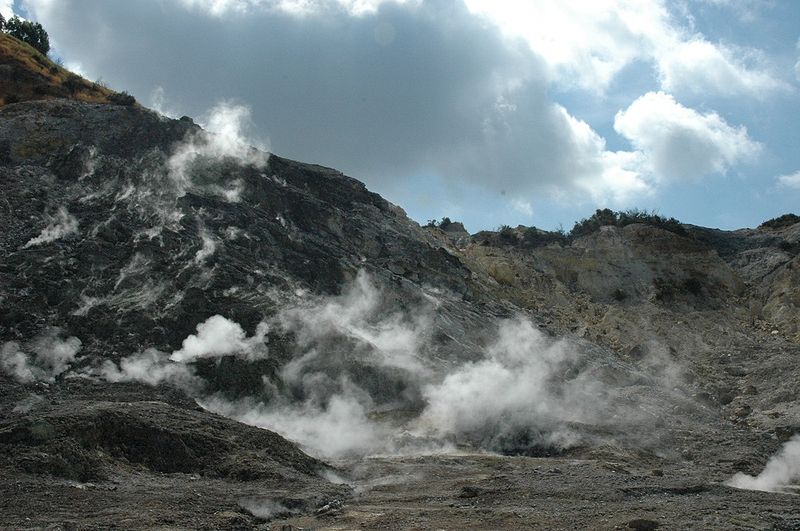
Italy , Campi Flegrei :
Weekly bulletin from 05 October 2019 to 12 October 2019. Updated November 12, 2019 local time.
SUMMARY OF THE STATUS OF THE ACTIVITY:
In light of the monitoring data we observe :
Seismicity: This past week, in the Campi Flegrei area, 33 earthquakes of low magnitude (Mdmax = 0.7) have been recorded.
Deformation: The average value of the maximum uplift zone is about 0.7 cm / month since July 2017. The uprising recorded at the RITE GPS station is about 57 cm since January 2011.
Geochemistry: The soil CO2 flux measured last week showed no significant change from the previous period, confirming the persistence of the long-term trend; last week, the temperature of the main fumarole of Pisciarelli remained on the values typical for this boiling zone of fumarolic fluids (~ 95 ° C).
Seismology:
During the last seven days in the Campi Flegrei area, 33 low magnitude earthquakes (Mdmax = 0.7) were recorded. It was possible to determine the hypocentral parameters of 18 recorded events whose locations were located. Between 11:38 and 24:02 UTC on 11/09 was recorded an earthquake swarm, consisting of a sequence of 6 earthquakes with a magnitude of 0.8≤Md≤0.4, located in the Pisciarelli area at a depth of 1 km.
Deformation of the soil:
GPS data confirm the average uplift in the maximum deformation zone of about 0.7 cm / month from July 2017. The uprising recorded at the RITE GPS station is about 57 cm since January 2011, of which about 21 , 5 cm from January 2017 … / …
Source : INGV.
Read the article : http://www.ov.ingv.it/ov/bollettini-campi-flegrei/Bollettino_Flegrei_2019_11_12.pdf
Photo : Manuel Mauer / Wikipédia .