October 20 , 2018.
Italy / Sicily , Etna :
A flank of Etna moves laterally. We make the point. by Alessandro Bonforte, Francesco Guglielmino, Giuseppe Puglisi
An article on the results of soil deformation measurements made on the seabed in front of the Etna volcano was recently published in the scientific journal Science Advances. Measurements have shown a slow eastward movement that also affects the submerged slope of the volcano. This discovery provoked a media outcry, both for the magazine’s international impact, for the subject in question, and for the slow sliding towards the sea of the eastern flank of the volcano, a fact already known for decades. This aspect has been exaggerated by some media that have reported information, especially on the Web, stressing the catastrophic aspect of the phenomenon and assuming a possible collapse of the entire slope and a tsunami that could ensue. This scenario is an extreme event and, as such, highly unlikely. Here we intend to clarify the complex geological phenomenon, studied for decades, that the study of German GEOMAR researchers and Italian researchers of the INGV Osservatorio Etneo has helped to make better known (Figure 1).
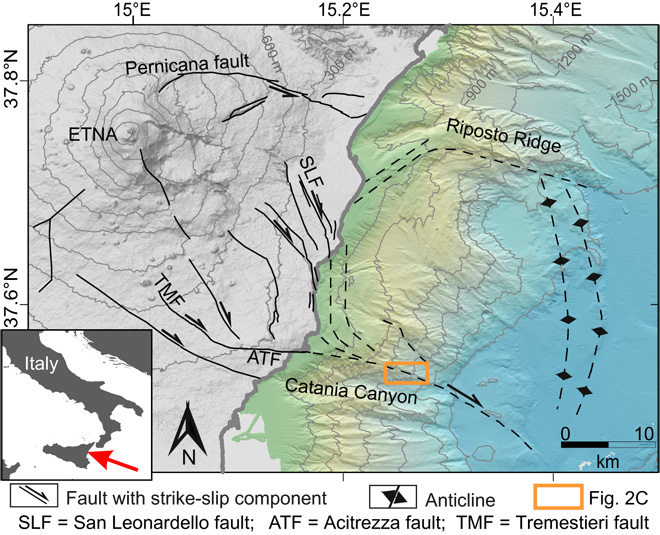
Figure 1 – Structural classification of the study area. The orange rectangle indicates the area in which the seafloor slow motion measurement network has been installed. Figure from Urlaub et al. (2018).
That Etna is interested in a « lateral » movement has been known for many years. The first hypotheses were formulated in the 80s, from purely geological evidence, from the study of faults that cut the eastern sector of the volcano, from the analysis of magmatic outcrops along the walls of the Valle del Bove , the hypothesis of the formation of the same Valle del Bove and the Northeast Rift and the study of outcropping deposits along the eastern slope of the volcano. Many researchers have proposed models to explain the dynamics of this flank on a geological and structural basis.
Only satellite ground deformation measurement techniques (GPS – Global Positioning System – and SAR Interoperometry – Synthetic Aperture Radar) have confirmed that the eastern face of the volcano and a southern part deforms almost continuously. showing a clear translational component, mainly to the East and Southeast, as well as compressions and uprisings on the southern edge of the volcano. From the 1990s, soil deformation measurements revealed this soil dynamics, defining it with increasing precision (Figures 2 and 3).
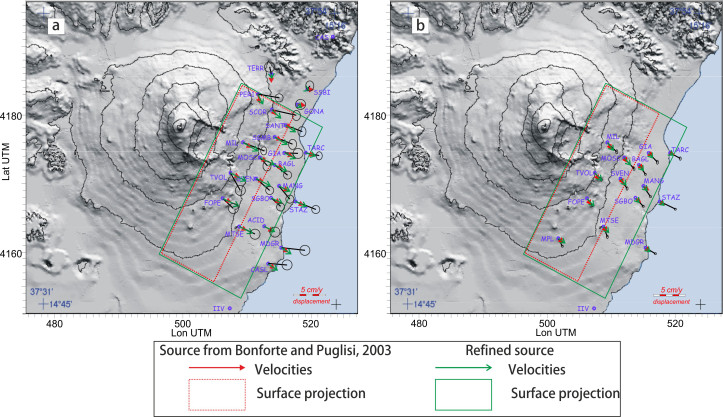
Figure 2 – Average speed of movement (in cm / yr) measured by GPS measurement campaigns on various points on the east flank of Etna from 1997 to 1998 (left, figure a) and from 1998 to 2001 (at right, b). The length of the arrows is proportional to the speed, according to the scale indicated. The circle at the end of each arrow represents the measurement error. The rectangles indicate the projection in plan of the geometry of the first mathematical models which try to simulate and define the hypothetical surface of separation under the slope in movement, starting from the model proposed in the work from which the figure was taken (Bonforte and Puglisi 2006).
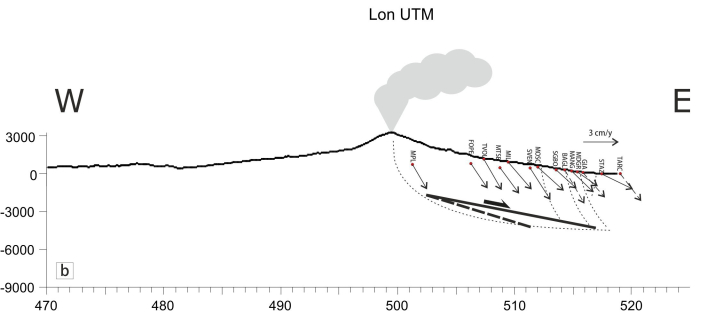
Figure 3 – The figure shows an E-W section of Etna with measured movement speeds. The length of the arrows is proportional to the speed, according to the scale indicated. The thick lines represent the sectional extension of the first mathematical models of the hypothetical separation surface below the moving slope. The dashed curve line is an assumption about how the actual separation area approximated by analytical models could be. Figure extracted from Bonforte and Puglisi (2006).
Overall, we can say today that we are observing a sliding movement towards the coast with a predominant horizontal component towards the East and the South-East whose average speed is 2 to 3 cm per year and a vertical component (lowering) of smaller entity. Locally and temporarily, there may be inversions (uplift) related to tectonic structures (Timpe di Acireale).
From the first direct observations, thanks to GPS measurements, the real complexity of the movement of the East flank appeared, segmented into several blocks with different speeds and separated by structures, often responsible for the seismicity of this sector (Figure 4). The area moving east of the volcano is limited to the north by the Pernicana fault system, while in the south it gradually decreases to extend over a fault bundle covering the entire south-east flank, up to ‘to the northern part of the city of Catania.
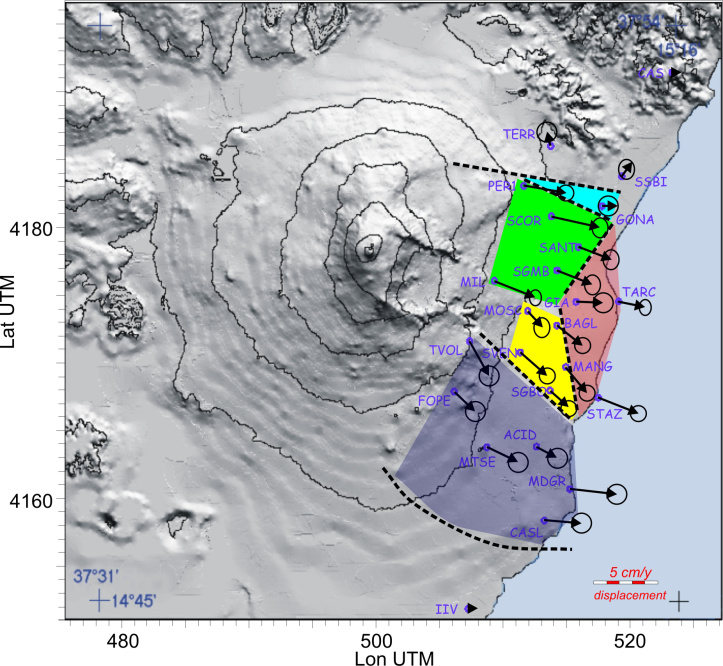
Figure 4 – First definition of kinematic blocks in which the eastern flank of Etna seems to be subdivided, based on the measurements of movements obtained from 1997 to 1998 with GPS measurement campaigns. The length of the arrows is proportional to the speed, according to the scale indicated. The circle at the end of each arrow represents the measurement error. Figure extracted from Bonforte and Puglisi (2006).
SAR remote sensing techniques subsequently allowed the geometry and dynamics of the various structures constituting the unstable slope to be defined in ever greater detail (Figure 5).
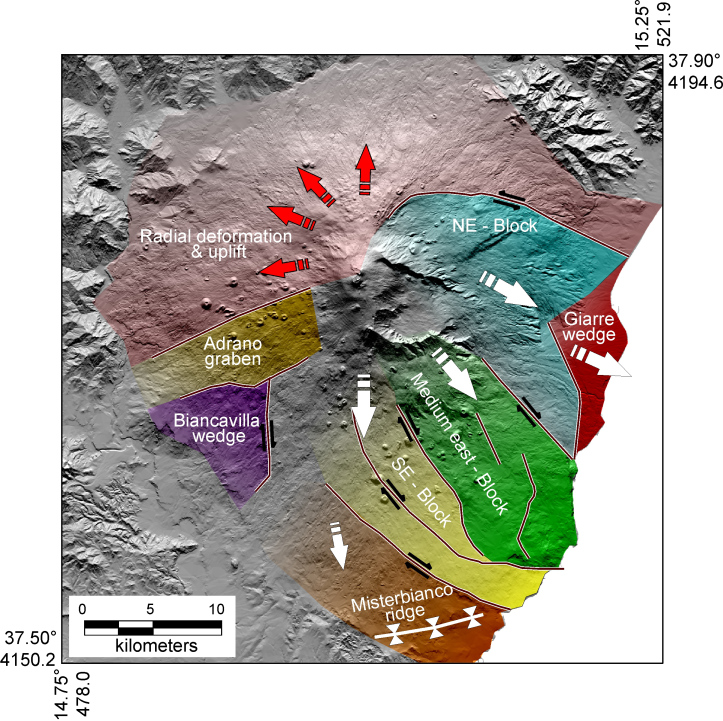
Figure 5 – Diagram and nomenclature of the blocks in which the volcanic building is fragmented (highlighted by the different colors in transparency) and the main faults (black lines) on which they flow, with relative kinematics (white arrows for black blocks and arrows) for defects) as measured by observations of SAR satellite interferometry. Figure from Bonforte et al. (2011).
Over time, the movement of the eastern flank of Etna showed accelerations often related to eruptions (Figure 6), but it was observed that this persisted even when volcanic activity was weak or absent.
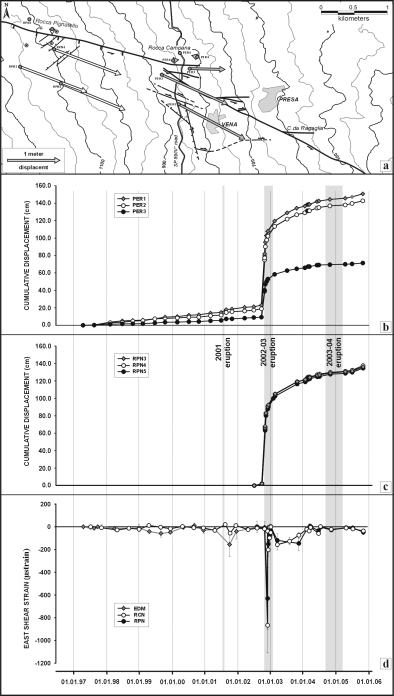
Figure 6 – Detail of the observations on the Pernicana fault. At the top of the map, the movements observed at the GPS measurement points from 1997 to 2005, where the length of the arrows is proportional to the speed, according to the scale indicated. It should be noted that on the points north of the fault, no movement was measured, while to the south, the slope moved to the southeast by more than one meter. In the lower charts, it is shown how much of the movement from 1997 to 2005 coincided with the 2002-2003 eruption. Figure from Bonforte et al. (2007).
The soil deformation measurements, combined with the geological knowledge, made it possible to develop new hypotheses as well as the first mathematical models on the mechanisms and causes of the movement observed. The FLANK project, funded by the Department of National Civil Protection, in which many Italian and foreign academics participated from 2008 to 2010, also contributed to the study of the dynamics of the flanks of Etna.
All models proposed over the years to explain the dynamics of the flanks of Etna are based on the assumption that the movement is mainly caused by the action of two forces: 1) gravity and 2) magma thrust, each larger or smaller as the models change. In addition, regional tectonics also influences flank dynamics. However, there are still several interpretations about the possible geometry and the mechanical characteristics of the structures that produce these deformations in depth.

The movement of the eastern flank of Mount Etna has been verified and shared by the scientific community. The scientific debate focused on the thickness, volumes and dynamics of the part of the Earth’s crust, trying to understand the mutual roles of gravity, magma movements. and tectonics on the triggering and control of instability on this side of Etna. One of the most important evidences, resulting from decades of measurements and observations, is that, apart from periods characterized by flank eruptions, the speed of movement increases towards the eastern periphery of the volcano. In other words, higher speeds are usually measured along the coast. This has always left questions about how the movement propagates in the submerged part of the volcano, how far and how far.
Previous studies on marine geophysics have already revealed clear morphological evidence of landslides on the seafloor of Etna, supporting the hypothesis that, at least in the past, instability extended well beyond from the Etna coast. However, there were still no elements (measurements and direct observations) to establish whether this instability of the submerged part was active and to what extent.
The study entitled « Gravitational Collapse of the Southeast Flank of Mount Etna », just published in Science Advances, is the fruit of a fruitful collaboration between researchers from the GEOMAR Ocean Research Institute in Kiel, Germany , and researchers from the INGV-Osservatorio Etneo of Catania. adds new observations to answer these questions. In particular, this work provides for the first time a direct measurement of deformations occurring along an underwater fault. This fault is located near the canyon of Catania, a deep underwater valley that extends from the north coast of the city of Catania to the abyssal plain. Previous studies had suggested that it could be related to the structures that delineate the moving Etna slope (Figures 7 and 8).
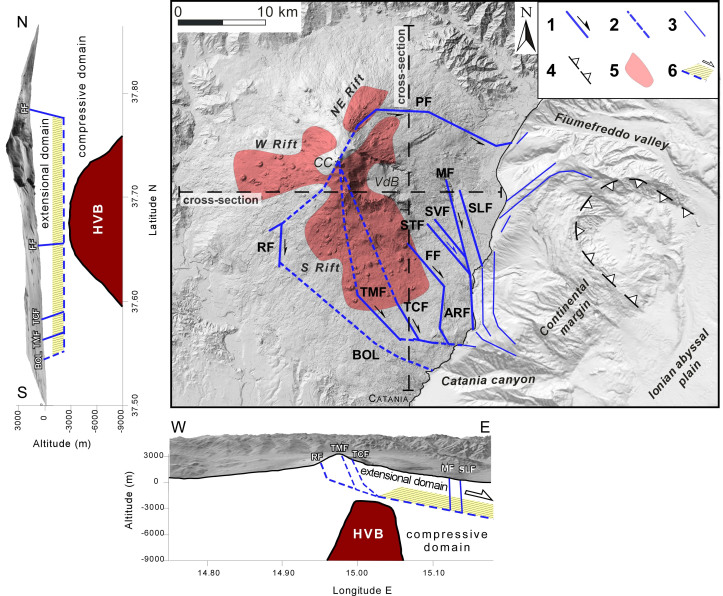
Figure 7 – Diagram of the whole of the eastern part of Etna, including the submerged part, with the main structures that segment it and its kinematics: PF, Pernicana; RF, Ragalna; CF, Calcerana; TMF, Tremestieri; TCF, Trecastagni; FF, Fiandaca; ARF, Acireale; STF, S. Tecla; MF, Moscarello; SLF, S. Leonardello; RF, Ragalna. HVB: « high-speed body », a more rigid structure of surrounding rocks, identified by prospecting for active seismic activity. 1, defects with relative kinematics; 2, other structural features showing no evidence at the surface but deduced from the deformations of the soil; 3, main underwater morphological slopes; 4, landslide slopes; 5, rift zones; 6, separation surfaces deduced from the soil deformation data. Figure from da Azzaro et al. (2013).
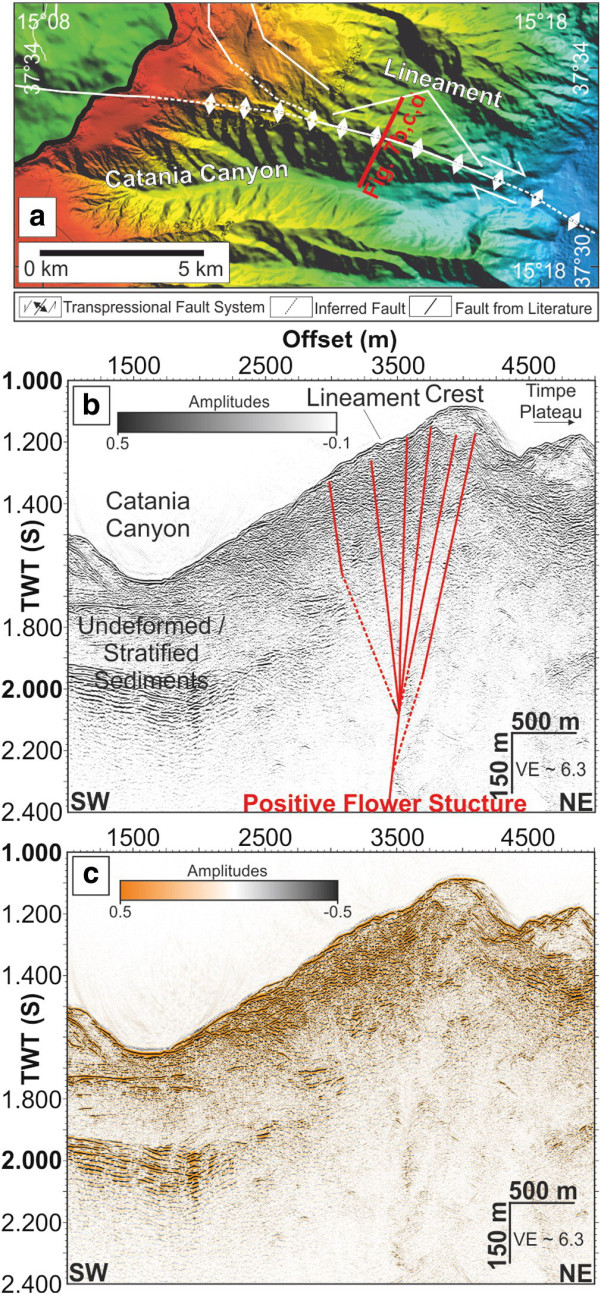
Figure 8 – Detail and section of Catania Canyon in the area where the underwater network was installed. Figure (a) above shows the morphology of the seabed on the map; Figure (b) shows the active seismic profile, along the section indicated in red on the map, highlighting the internal structure of the rocky body, with the interpretation of the structures that cut it (in red); Figure (c) shows the amplitude of the reflected seismic signal. The structure proposed in red in figure (b) could be the continuation of the Acitrezza fault.
The researchers installed a network of sensors on the seabed at a depth of 1,200 meters and at a distance of more than 10 kilometers from the Etna coast, therefore at a significant distance from the volcano. It is precisely the exceptional character of this scientific and technological enterprise that has aroused the great interest with which the publication of results has also been accepted on traditional media. The sensors measured the seafloor movements using acoustic waves and acquired data every 90 minutes from April 2016 to July 2017. The sensor network thus made it possible to measure a deformation of the submerged sidewall. about 4 cm, compatible with that measured at the same time by etna geodesy techniques (Figure 9).
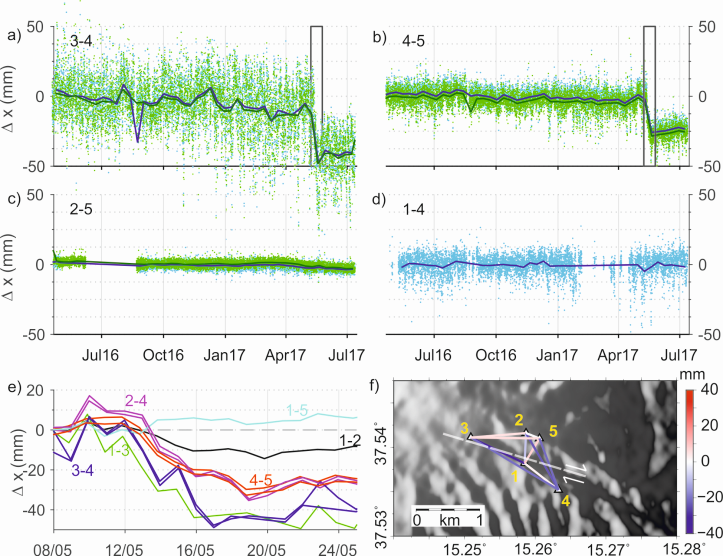
Figure 9 – Distance variations measured over time between the sensors of the submarine network. The network map is displayed at the bottom right. At the top, the variations between the sensors 3 and 4 (on the left) and between the sensors 4 and 5 (on the right). On the center line, it is shown that between sensors 2 and 5 and between sensors 1 and 4 (lines that do not pass through the fault) does not measure any variation. The chart at the bottom left shows a detail of the period during which the observed deformation occurs. Figure modified by Urlaub et al. (2018)
In particular, SAR interferometric measurements, integrated in GPS measurements and measurements of the submarine network, made it possible to specify how the deformations of the soil of the south-east flank of Etna extend between the emerged part and the submerged part. . Measurements on land and offshore (at sea) have shown that on Etna, this deformation is divided into two main directions: the Acitrezza fault and Timpe faults (including that of S. Leonardello, Figure 10) .
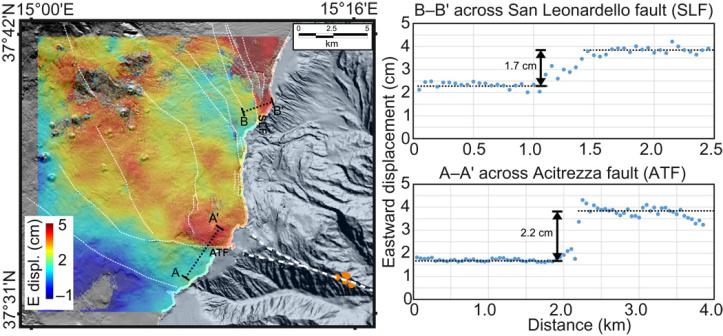
Figure 10 – Deformations (eastward motion) observed in the emerged part of SAR remote sensing. The distribution of the displacements measured on the map is illustrated on the left according to the colors indicated on the scale. On the right, the displacements according to the two profiles A-A ‘and B-B’ indicated on the map on the left while passing by the fault of Acitrezza (A-A ‘) and the fault of S. Leonardello (B-B’). : the jump is obvious where the profiles cross the two structures. Figure from Urlaub et al. (2018).
If, in future, new measurements in larger areas of the seabed in front of Mount Etna confirm the observations, so far it would be obvious that the dynamics of the flanks of Mount Etna is linked to a larger phenomenon , which would deeply affect a significant portion of the continental crust well below the only volcanic building, prolonging surface instability not only in the emerged part, but also on the undersea side.
In all cases, magma dynamics interferes with the general and dominant gravitational process for at least two reasons: 1) the continued eastward movement of a significant portion of the continental crust would lead to weakening and extension of the most superficial part of the crust, favoring the rise of the magma; 2) Large intrusive events of new magma in the volcanic edifice would provide additional thrust and consequent flank acceleration, as observed in the case of the 2002 Northeast Rift eruption, at least in the volcano’s emerged part. (Figure 6).
And in all of this, what does the tsunami have to do with that? Some tsunamis can be generated by landslides caused by the instability of volcanic slopes, as confirmed by what happened on Stromboli in December 2002. However, the only hypothesis of a tsunami generated by Etna refers to the eventual phenomenon that would be generated. at the time of the formation of the Valle del Bove, about 10,000 years ago, although there is no unambiguous proof of this event. In the current state of knowledge, the tsunamis that hit the east coast of Sicily are exclusively related to seismic activity and not to landslides caused by the instability of Etna (see the Euro-Mediterranean catalog tsunamis).
On the whole theoretical plane, if the hypothetical rapid shift of the entire flank of the volcano occurred, a tsunami of considerable size could be generated, but it is not possible, at the current state of knowledge, to estimate if such a phenomenon could occur. On the other hand, the INGV and the Directorate of Civil Protection have already taken into account the risk of tsunami in the Mediterranean with the activation of the Tsunami Warning Center and a technical table concluded in May 2018, dedicated to the capacity of tsunami generation from fully or partially submarine volcanoes.
Unjustified clamor raised by media speculation about an unlikely tsunami caused by the instability in the Etna sides will, hopefully, stimulating for future studies on the dynamics of the seabed off the coast of Etna.
Source : INGV Vulcani. https://ingvvulcani.wordpress.com/2018/10/18/un-fianco-delletna-si-muove-lateralmente-facciamo-il-punto/?fbclid=IwAR36WqDl6mtrhwX1cqFN74A8LtQyhvN5ttzvg1fjEmp7wnw1f1CSlpOo_rs.
Photos : Gio Giusa.