July 24 , 2018.
Ecuador / Galapagos , Sierra Negra :
Update on eruptive activity.
SUMMARY :
The eruption of the Sierra Negra volcano, begun on June 26 of this year, continues and maintains the emission of lava flows. The intensity of the eruption was variable and several impulses were identified when the activity increased. The eruption was concentrated along 4 cracks that generated various lava flows that cover a total area of 30.4 km2 on the north and west flanks of the volcano. The lava flows produced by crack # 4, which is the only one currently active, reached the sea between July 9th and 10th and continue to enter it. The shoreline of the Elizabeth Bay area has changed and the Ecuadorian territory has increased by about 1 km2. It should be noted that the area where lava flows enter the sea (Elizabeth Bay) is far from any population and agricultural activity and is only accessible by boat.
THERMAL SURVEILLANCE AND INTENSITY OF ERUPTION:
Figure 1 shows the graph of the thermal anomalies (radiated energy) generated during the eruption and detected by infrared sensors of the MIROVA system. These abnormalities may be associated with the intensity of eruptive activity described below:
At the beginning of the eruption, the afternoon of June 26, we see a peak of intensity that decreases rapidly.
Between 1 and 2 July, there is a new peak where the intensity increases and coincides with a new impulse of activity, reported in Special Report No. 12.
On July 7th and 8th, two new pulses were detected related to the increase in the intensity of the eruption, special report n ° 13.
Between July 10th and 13th, the intensity increases with lava flows and higher flows of lava flows, which later decline, reaching the sea.
Currently, the activity shows a new impetus; this is proof that the eruption of the Sierra Negra volcano continues and that the flow of lava flows into the sea.
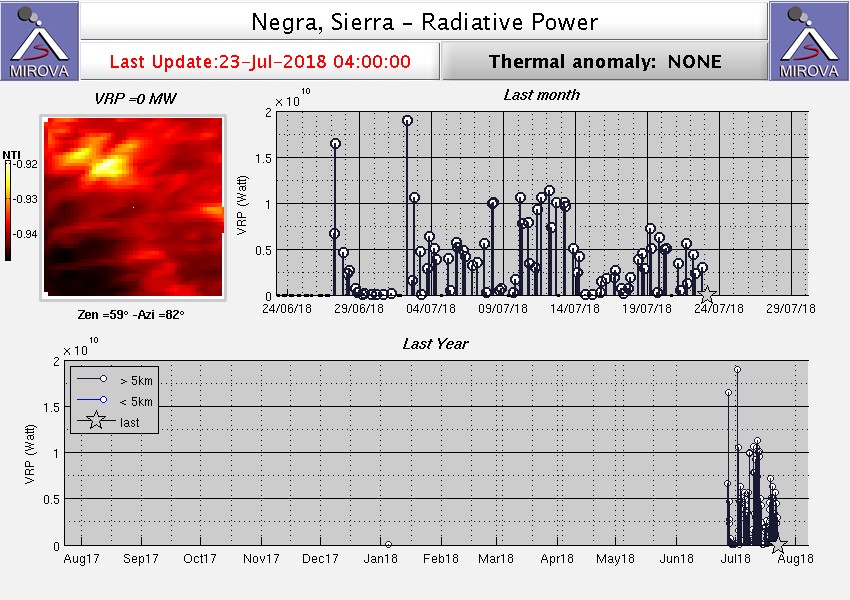
Figure 1: Measurement of heat (radiant energy) generated by the eruption between June 24 and July 23, 2018, provided by the MIROVA satellite system.
In addition, the direct and indirect temperatures of inactive lava flows were measured, ranging from 80 to 200ºC. The measurements were taken during a field campaign conducted between July 11th and 13th of this year.
FOLLOWING THE ERUPTION WITH SATELLITE IMAGES:
Based on the continuous processing of satellite images provided by Sentinel-2 and Landsat-8 from the eruption zone, the IG-EPN made a detailed follow-up of the eruptive process of the Sierra Negra volcano. Thus, since the beginning of the eruption on June 26, it was already possible to detect that it occurred along four different cracks, described below (Figures 2 and 3).
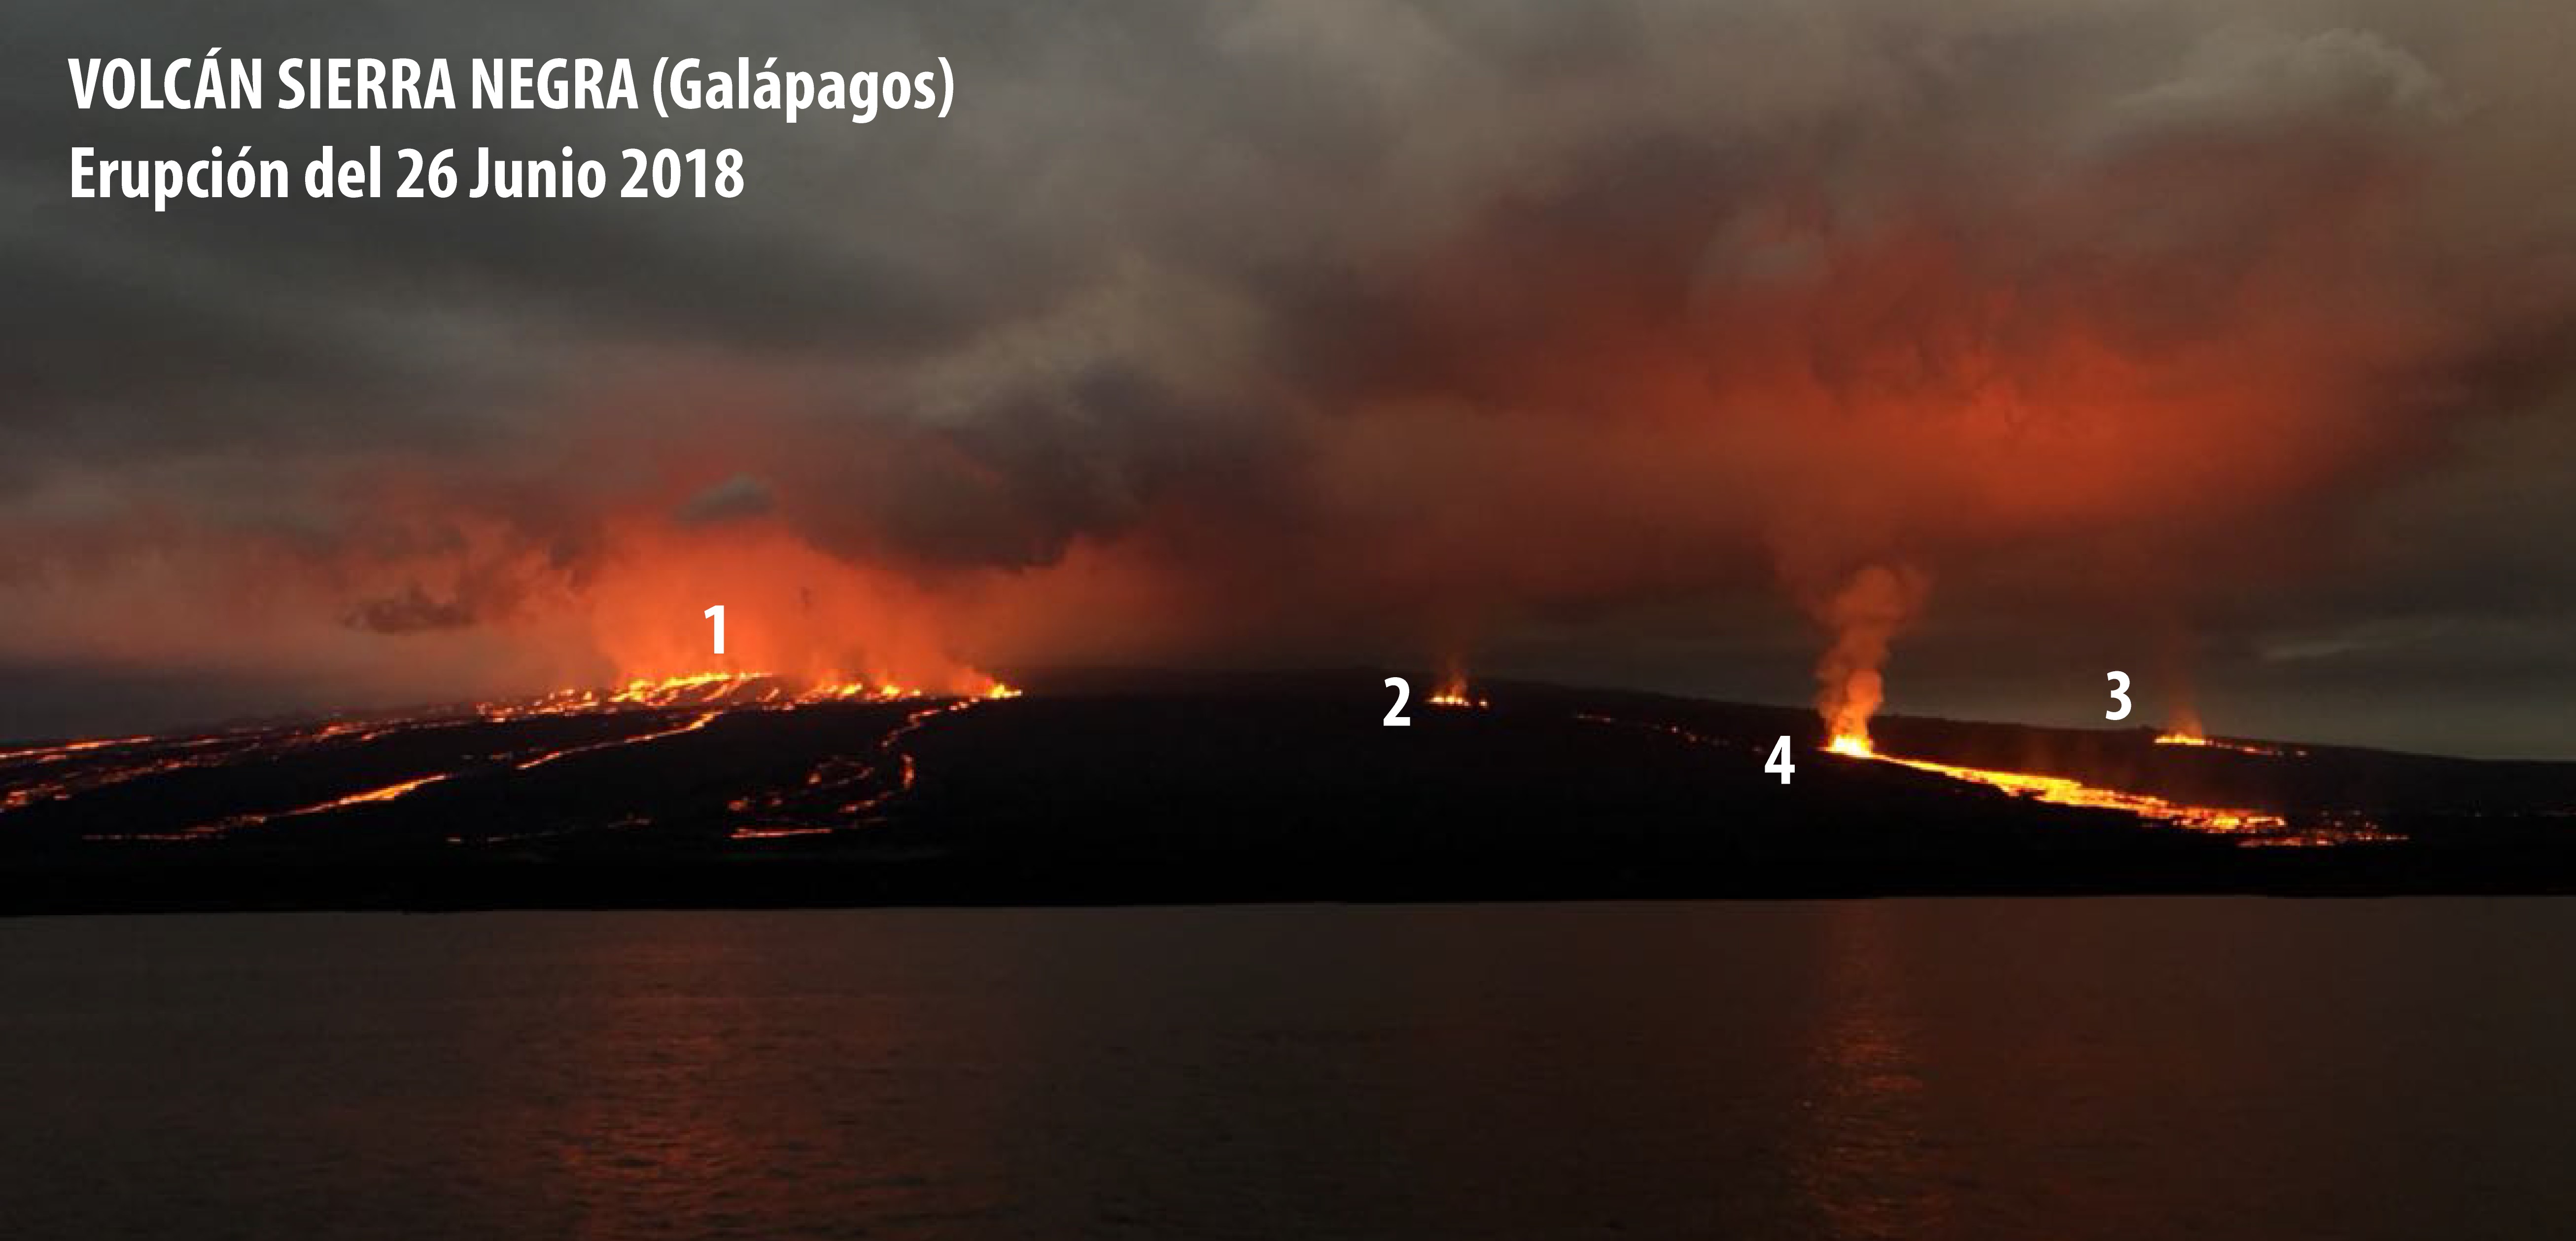
Figure 2: Photograph taken of a ship in Elizabeth Bay of various erupting cracks, on the night of June 26 (Photo retrieved from social networks).
Fissure 1: Opening at the edge of the caldera (1070 m) in the area of Chico volcano (Figure 2.) Aligned in the West-Northwest direction and tangent to the edge of the caldera (Figure 3), it has four kilometers long (4 km) and its lava flows since the beginning of the eruption, inside and outside the caldera, cover an area of 16.1 km2, until June 27 or she has apparently ceased her activities. Discharges outside the caldera had a maximum range of seven kilometers (7 km) downhill without reaching the sea; while those who were indoors reached a maximum distance of 1.7 km (Figure 3).
Fissure 2: Located northwest of the caldera (Figure 2)., About two kilometers below the edge of the caldera (700 meters). It has a length of about 250 meters and has produced lava flows since the beginning of the eruption, covering an area of 2.3 km2 until June 27, when it seems to have completed its activity. It had an extension of about 3 km and its lava did not reach the sea (Fig. 3).
Fissure 3: Located west of the caldera (Figure 2.), about four kilometers below the edge of the caldera (550 meters above sea level). This fissure is about 250 meters long and has been active since the beginning of the eruption, emitting lava flows that covered an area of about 0.3 km2 until June 27, when it apparently ended its activity . The lava flows had an extension of about 2 km and their lava did not reach the sea (Figure 3).
Fissure 4: She was the most active, and since the beginning of the eruption, she has been continually emitting lava flows. It is located on the northwest flank (100 m) 8 km downstream from the caldera (Figure 2). Until July 16, its lavas covered an area of 11.6 km2 which continues to grow at the time of publication of this report (Figure 3). Between 9 and 10 July, lava flows from this fissure reached the ocean and changed the Ecuadorian coast. Until 16 July, the Ecuadorian territory increased by 0.93 km2.
Given the entry of lava into the ocean and the interaction between hot and cold lava, this can be generated by explosions and throws of rock fragments and emissions of large amounts of gas which are a danger for boats that are in the area and for which it is advisable to keep a safe distance.
Until July 16, it was estimated that the lavas emitted in this eruption cover a total area of 30.4 km2, which is comparatively equivalent to the area occupied by the city of Cuenca.
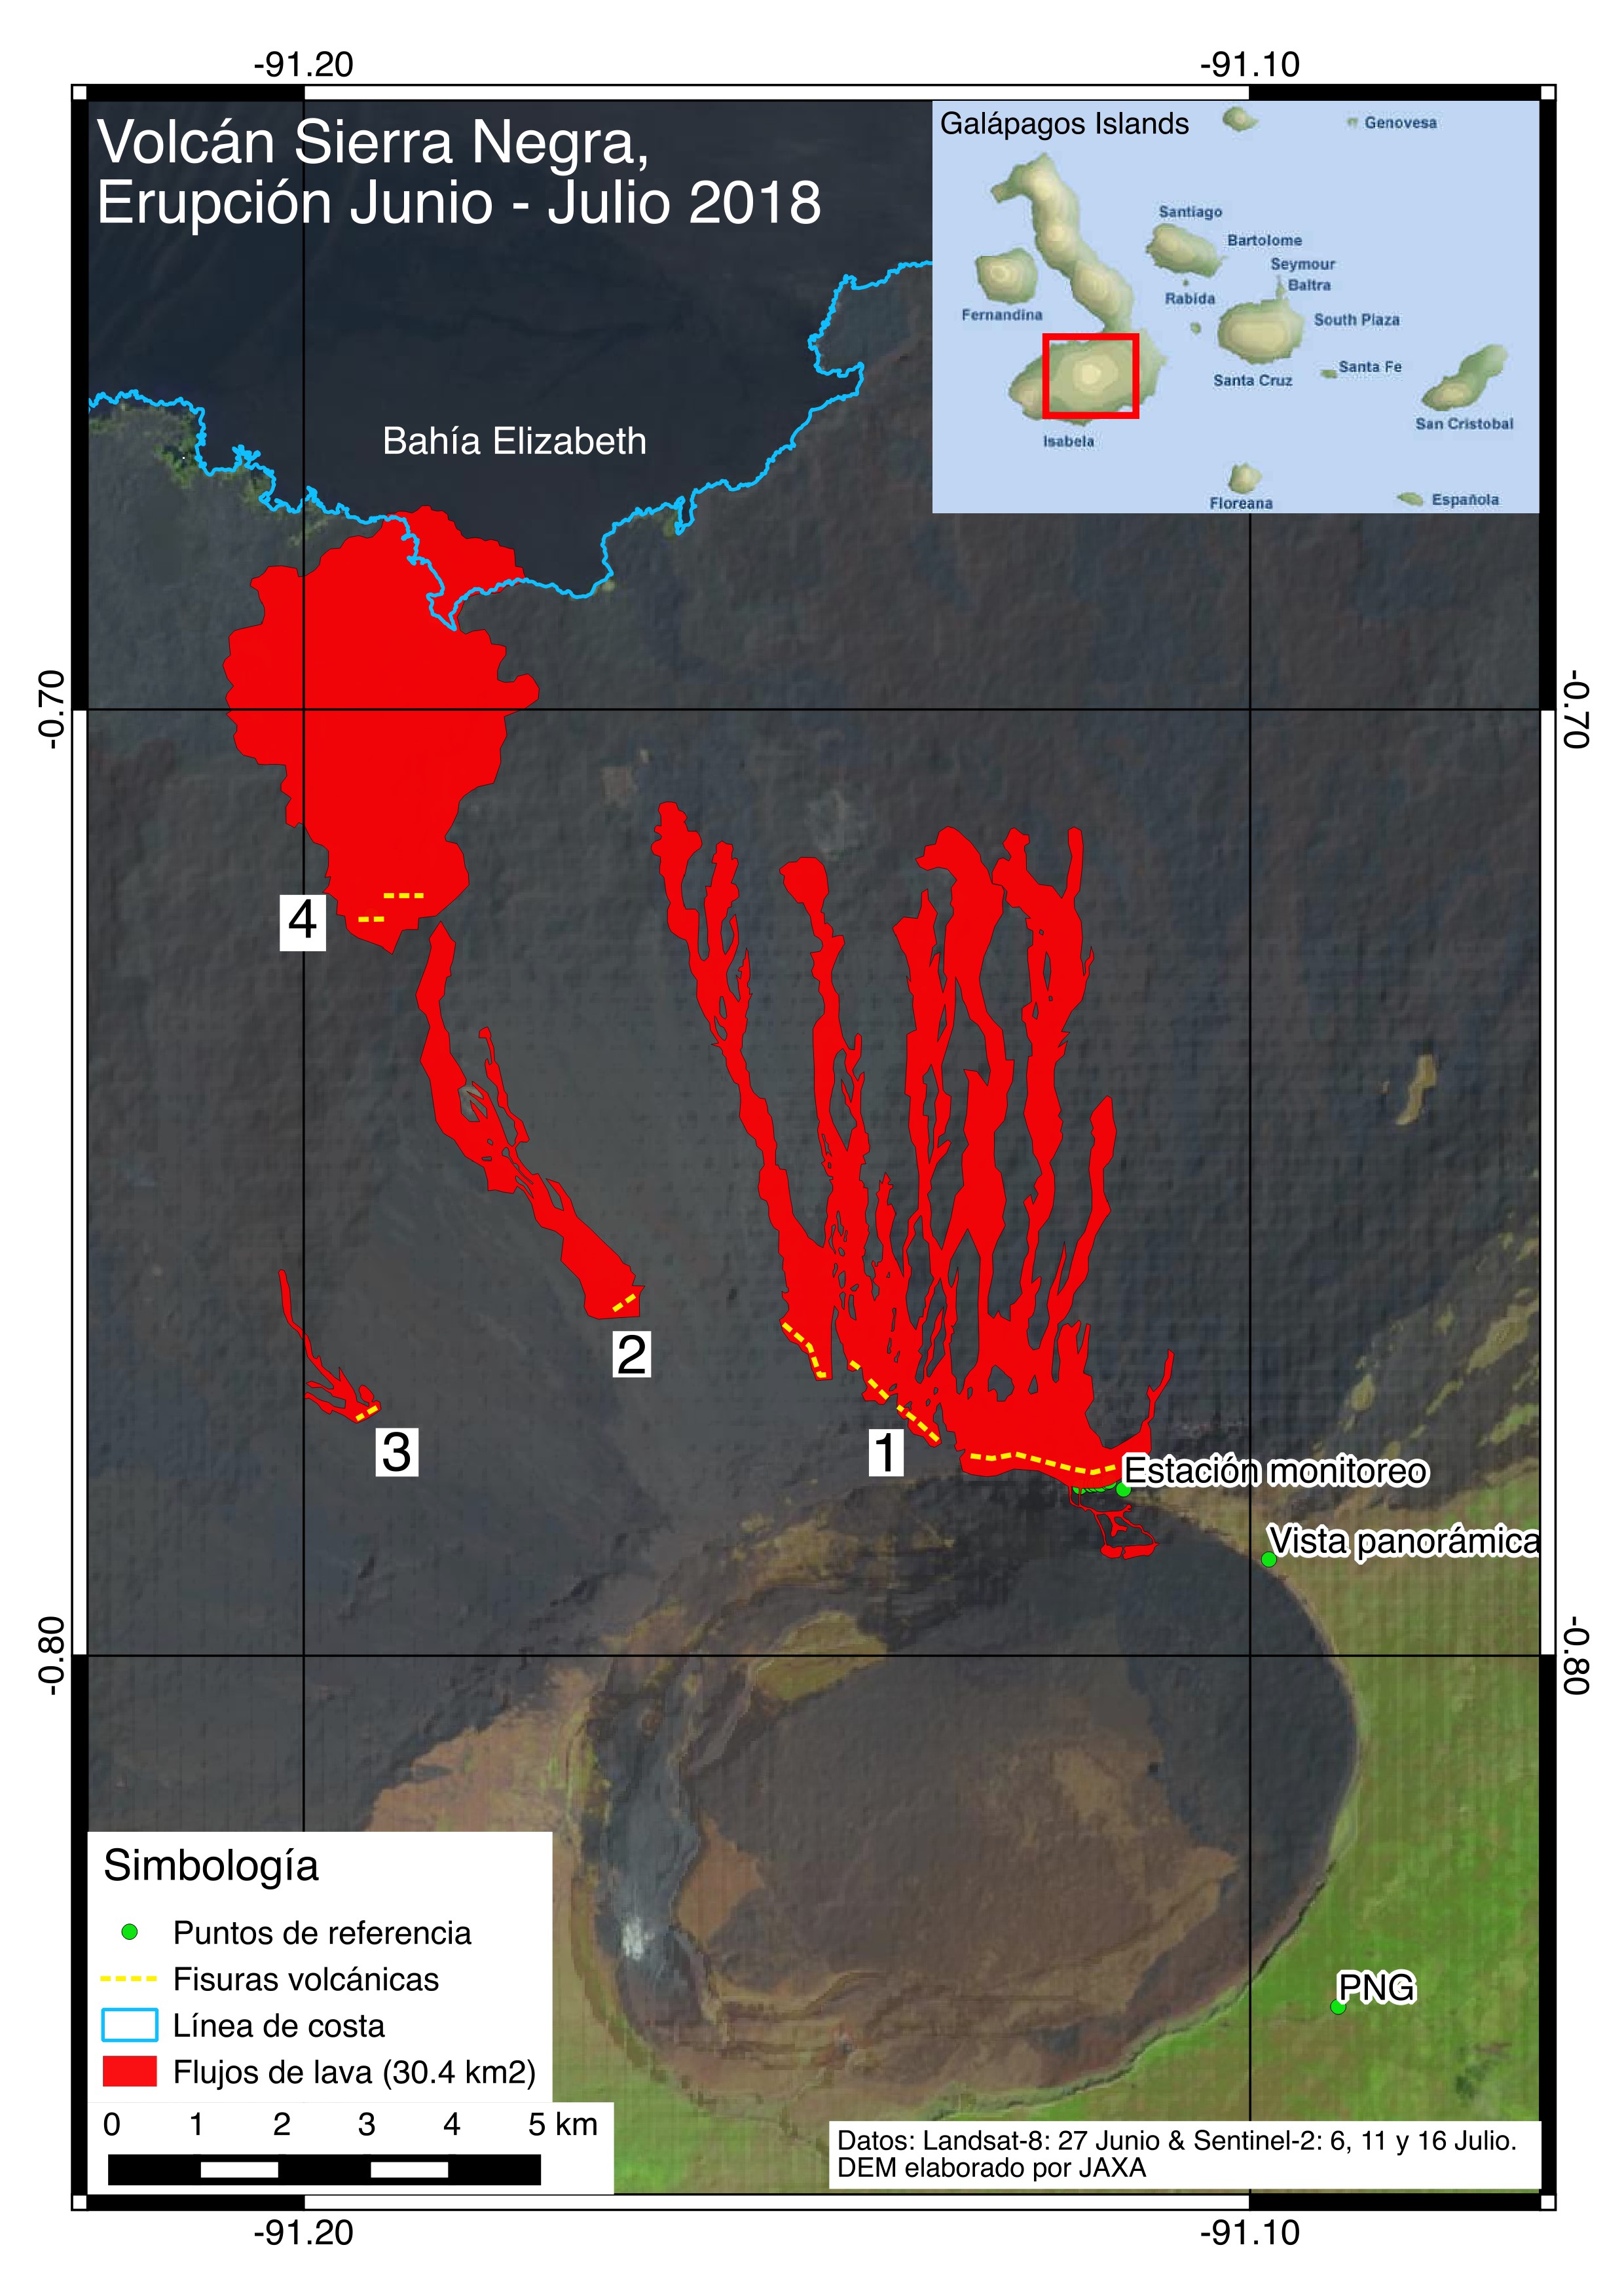
Figure 3: Distribution of lava flows from different fissures during the eruption of Sierra Negra volcano (updated until July 16, 2018).
CONCLUSIONS:
The Sierra Negra volcano eruption began on June 26 this year. The emission of lava flows from the crack Nº4, and reached the sea between 9 July and 10 and continues to enter the ocean, has so far maintained. The coastline changed and the Ecuadorian territory until July 16 increased by about 1 km2.
Once the lava flows have entered the sea, the interaction between hot lava and cold ocean water causes explosions that release rock fragments and emit large amounts of gas that pose a hazard to the ocean. people aboard the boats in the vicinity, it is therefore recommended to avoid approaching these sites and to remain at a prudential safety distance.
The eruptive activity occurred along four fissures on the north and northwest flanks, giving rise to various lava flows covering a total area of approximately 30.4 km2. The eruption began with lava emission through all these cracks; however, the three upper cracks (1, 2 and 3) ceased activity on June 27th. On the other hand, the lowest crack (Nº4) is the most active and maintains the emission of lava flows.
Since the eruption of the Sierra Negra volcano began, the intensity of eruptive activity has been variable and several impulses have been recognized when activity has increased and when it has decreased.
It should be mentioned that the seismic activity continues and that most events have been located under the caldera. Some of them have been reported as felt by the guards of the Galapagos National Park located in the upper part of the volcano (sector of El Cura). For these reports, visit our website www.igepn.edu.ec and social networks.
The Institute of Geophysics of the National Polytechnic School is in permanent communication with the responsible authorities, informing on the evolution of this eruptive period.
Source : IGEPN , PR, FJV, PM, SVV , Institut de géophysique , École nationale polytechnique.
Peru , Sabancaya :
An average of 25 explosions / day was recorded. The earthquakes associated with the rise of the magma (Hybrid types) remain very weak in number and energy.
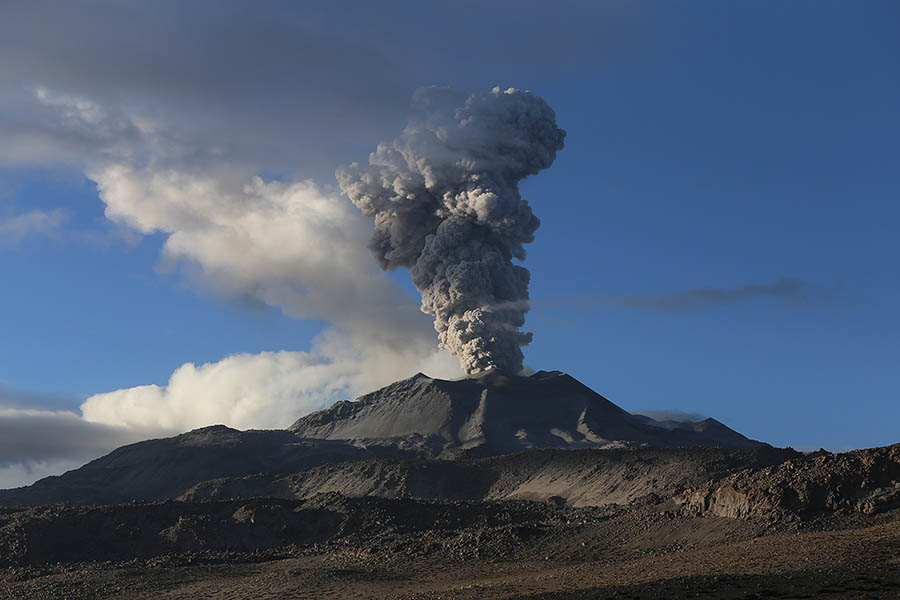
Eruptive columns of gas and ash reached a maximum height of about 2500 m above the crater. The dispersion of these materials occurred within a radius of about 30 km, mainly to the east, south-east and south.
The volcanic gas flow (SO2) recorded on 18 July had a maximum value of 12068 tons / day, a value considered very large.
The SBSE GPS station, during the last week, recorded a negative trend of deformation probably associated with volcanic activity.
A thermal anomaly detected by the MIROVA system was recorded, with a VRP (Radiated Volcano Power) value equal to 4 MW.
In general, eruptive activity maintains moderate levels. No significant changes are expected in the following days.
Source : IGP
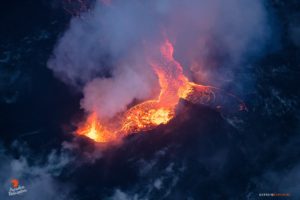
Hawai , Kilauea :
Monday, July 23, 2018, 1:06 PM HST (Monday, July 23, 2018, 23:06 UTC)
19°25’16 » N 155°17’13 » W,
Summit Elevation 4091 ft (1247 m)
Current Volcano Alert Level: WARNING
Current Aviation Color Code: ORANGE
Kīlauea Volcano Lower East Rift Zone
Fissure 8 continues to erupt lava into the channel leading northeastward from the vent. UAV crews found overflows just northwest of Kapoho Cone following a collapse event at the summit at 8:54 last night. The overflows were mostly confined to the existing flow field and stalled before threatening any nearby homes The most vigorous ocean entry is located a few hundred meters northeast of the southern flow margin with a few tiny pahoehoe toes entering the ocean from the Kapoho Bay lobe to the north. The southern margin of the flow remains about 500 m (0.3 mi) from the boat ramp at Isaac Hale Park; however, a new lobe has started from the southern lobe and is active along its southwestern margin slowly heading toward the ocean.
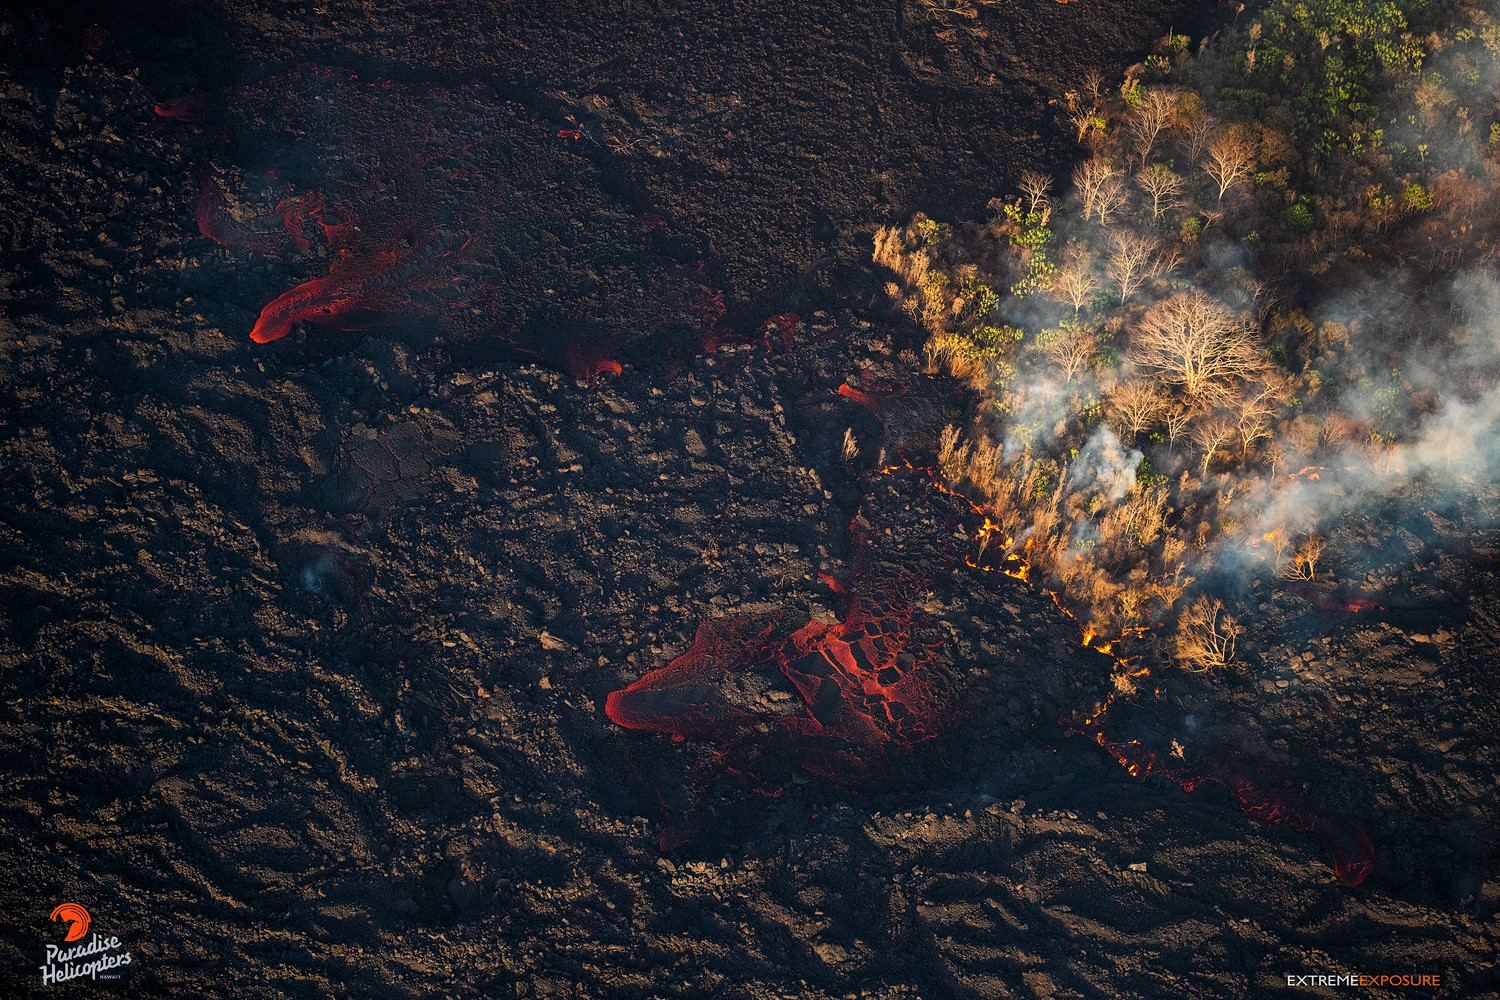
Southern margins of the flow continue to be active, expanding into ag lots and forest
No other fissures are active this morning.
Kīlauea Volcano Summit
The last collapse event occurred at 8:53 PM HST Sunday, July 22. Seismicity dropped following the event and has increased to 20-40 earthquakes per hour by this morning. The next collapse event is expected tomorrow Morning.
Source : HVO.
Photo : Bruce Omori .
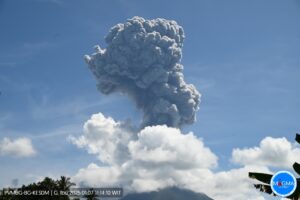
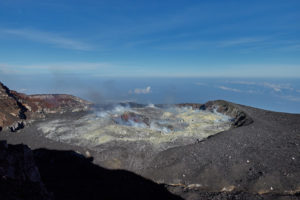
Indonesia , Agung :
VOLCANO OBSERVATORY NOTICE FOR AVIATION – VONA.
Issued: July 24 , 2018
Volcano:Agung (264020)
Current Aviation Colour Code: ORANGE
Previous Aviation Colour Code: orange
Source: Agung Volcano Observatory
Notice Number: 2018AGU56
Volcano Location: S 08 deg 20 min 31 sec E 115 deg 30 min 29 sec
Area: Bali, Indonesia
Summit Elevation: 10054 FT (3142 M)
Volcanic Activity Summary:
Eruption with volcanic ash cloud at 04h52 UTC (12h52 local). Eruption and ash emission is not continuing
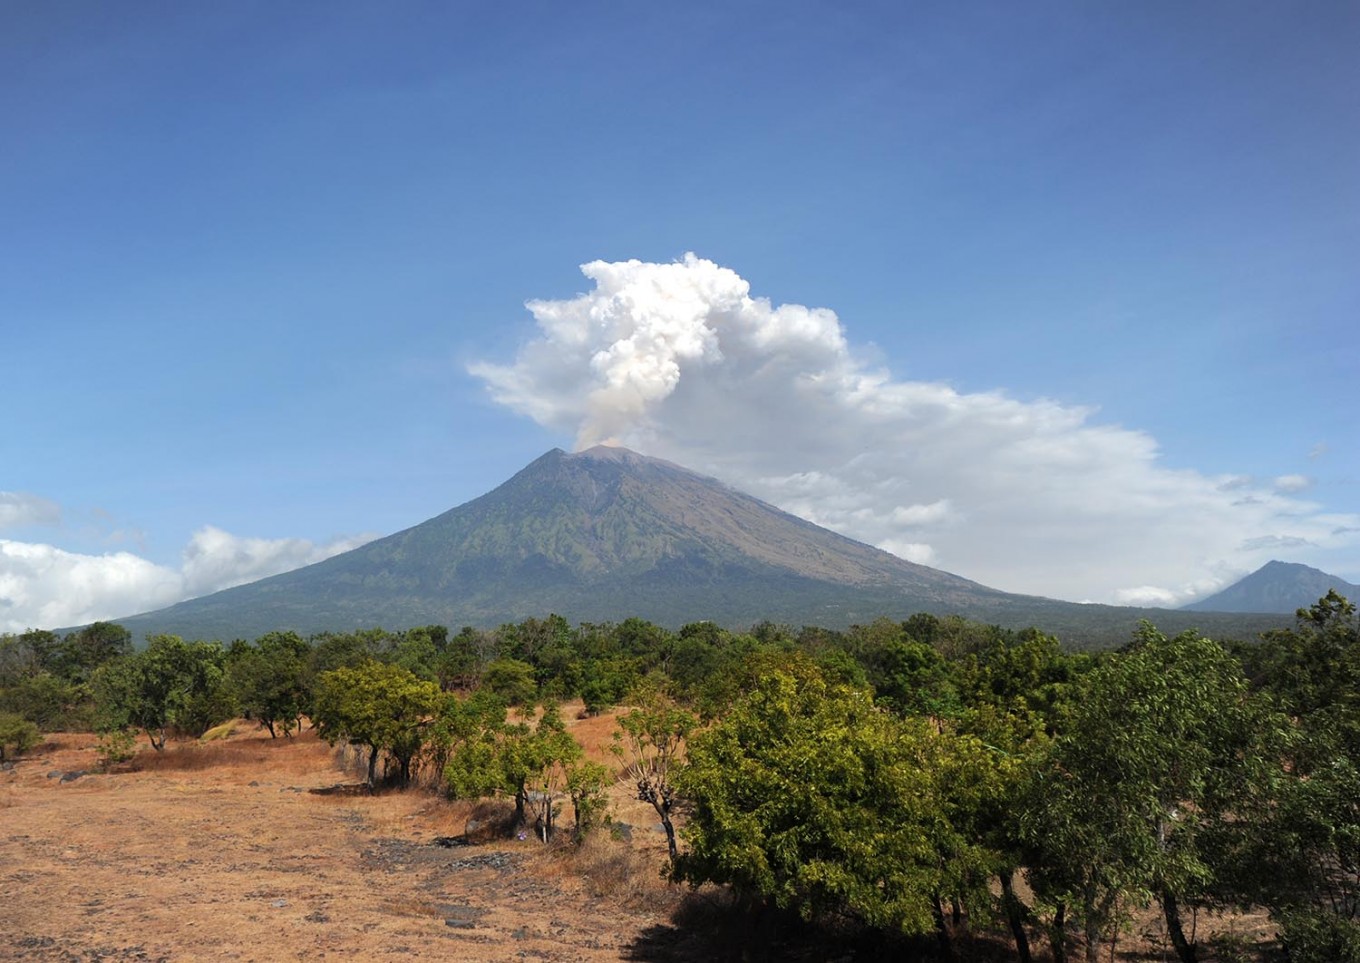
Volcanic Cloud Height:
Best estimate of ash-cloud top is around 14854 FT (4642 M) above sea level, may be higher than what can be observed clearly. Source of height data: ground observer.
Other Volcanic Cloud Information:
Ash-cloud moving to south east
Remarks:
Seismic activity is characterized by low frequency earthquakes.
Source : Magma Indonésie .