January 9 , 2026.
Italy , Stromboli :
WEEKLY BULLETIN, December 29, 2025 to January 4, 2026. (Publication date: January 7, 2026)
ACTIVITY SUMMARY
Based on monitoring data, the following points should be noted:
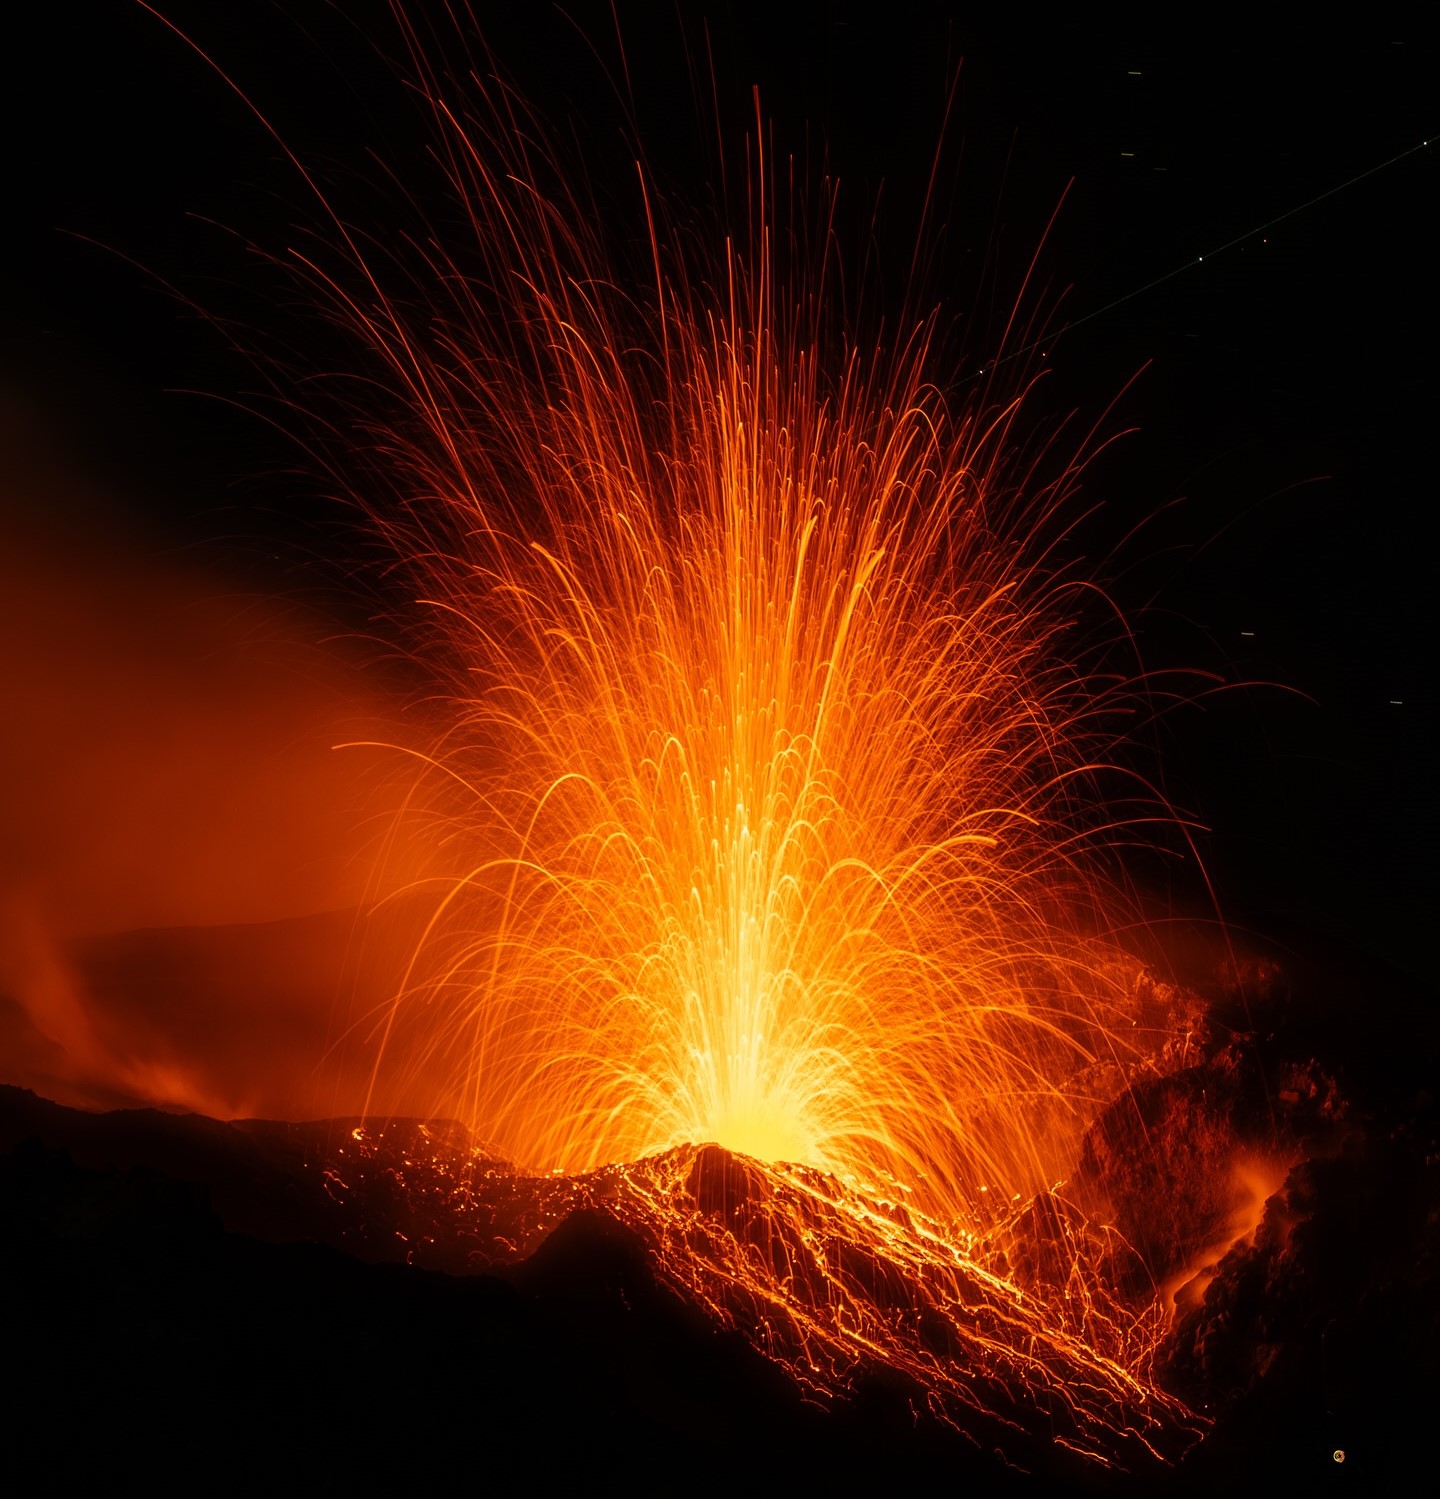
1) VOLCANOLOGICAL OBSERVATIONS: Ordinary Strombolian-type eruptive activity and non-ordinary activity with episodes of lava effusion from the overflow of the North Crater area. Total hourly frequency at a medium level and of low to medium intensity in the North and Central-South Crater areas.
2) SEISMOLOGY: The monitored seismic parameters show no significant changes.
3) GROUND DEFORMATION: The ground deformation monitoring networks have not shown significant changes. The tilt measurement network is still affected by disturbances that compromise its reliability.
4) GEOCHEMISTRY: Low to moderate SO₂ flux.
CO₂ flux from the ground in the Pizzo area (STR02): high values.
C/S ratio in the pen: average values.
Helium isotope ratio (R/Ra) dissolved in the thermal aquifer: no update. Latest data: December 2, 2025: high values (4.44).
CO₂ flux from the ground in the San Bartolo area: high values.
CO₂ flux from the ground in the Scari area: almost stable at approximately 160 g/m²/day.
5) SATELLITE OBSERVATIONS: Thermal activity observed by satellite in the area.
VOLCANOLOGICAL OBSERVATIONS
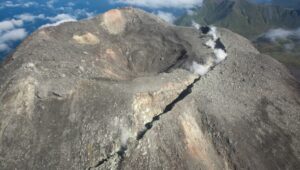
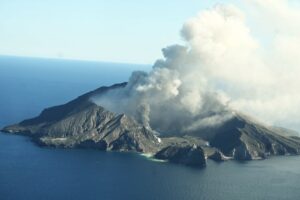
During the observation period, Stromboli’s eruptive activity was characterized by the analysis of images recorded by the INGV-OE monitoring cameras located at an altitude of 190 m and at Punta dei Corvi (SCT-SCV and SPCT, respectively). Explosive activity was primarily produced by five eruptive vents located in the North crater area and by at least two vents located in the Central-South area.
Observations of explosive activity captured by the monitoring cameras
Overall, eruptive activity continues to show a decrease in the hourly frequency of explosions, already observed since the first week of December, stabilizing at an average level, with a predominance of eruptive activity produced by the North (N) area compared to that of the Central-South (CS) area. Regarding the intensity of explosive activity, it remained low to moderate in both areas (ejected material relative to the crater surface, respectively at heights below 80 m and between 80 and 150 m). More specifically, in the North Crater area, explosions were produced by five active vents, two in sector N1 and three in sector N2, with ejected material composed mainly of coarse material (bombs and lapilli). A decrease in ejection activity was observed starting on December 29, 2025. The average frequency of explosions was approximately 7.8 events per hour. In the Central-South Crater area, two vents were observed, exhibiting explosions of fine material mixed with coarse material; the average frequency of explosions was approximately 1.9 events per hour.
Effusive Lava Flow Activity (times in GMT)
During the observation period, the lava flow episode in the North Crater area, which began on December 26, 2025, at 1:50 a.m., ended on December 29, 2025, at 1:00 p.m. This episode, already described in Stromboli Report Bulletin No. 01/2025, was characterized by a very low flow rate and a variable flow rate over time, with periods of suspended lava flows. As with similar episodes, the most advanced flow fronts reached the middle of the Sciara del Fuoco but did not reach the coastline.
Source : INGV.
Photo : Stromboli stati d’animo / Sebastiano Cannavo
Italy / Sicily , Etna :
WEEKLY BULLETIN, December 29, 2025 to January 4, 2026. (Publication date: January 7, 2026)
ACTIVITY SUMMARY
Based on monitoring data, the following points should be noted:
1) VOLCANOLOGICAL OBSERVATIONS: Effusive activity in the Valle del Bove, Strombolian activity, and ash emissions from the Voragine, Bocca Nuova, and Northeast craters.
2) SEISMOLOGY: Low seismic activity due to fracturing. Average amplitude of volcanic tremor with values tending to decrease, generally within the average range.
3) INFRASOUND: Low infrasound activity at the beginning of the week, not measurable in recent days due to weather conditions.
4) GROUND DEFORMATION: Ground deformation monitoring networks have not indicated any significant variations.
5) GEOCHEMISTRY: SO₂ fluxes are high and decreasing.
CO₂ fluxes from the ground (EtnaGas Network): stable at average values.
Partial pressure of dissolved CO₂ in groundwater (EtnaAcque Network): no update.
Helium isotope ratio at peripheral sites: average, decreasing (latest data from December 22).
6) SATELLITE OBSERVATIONS: Over the past week, thermal activity observed by satellite in the summit area has ranged from high (> 100 MW) to very high (> 1000 MW), consistent with effusive activity.
VOLCANOLOGICAL OBSERVATIONS
During the week, Etna’s volcanic activity was monitored through the analysis of images from the INGV – Osservatorio Etneo (INGV-OE) surveillance cameras and satellite imagery,
as well as through direct observations conducted on the ground by INGV-OE staff on January 1, 2, 3, and 4.
The surveillance camera observations were irregular due to unfavorable weather conditions, particularly at the summit.
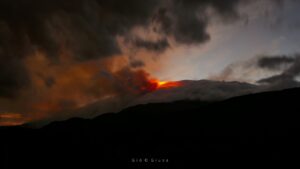
Overall, the observation period was characterized by explosive activity, primarily at the Voragine crater (VOR), and effusive activity in the Valle del Bove starting on January 1.
.
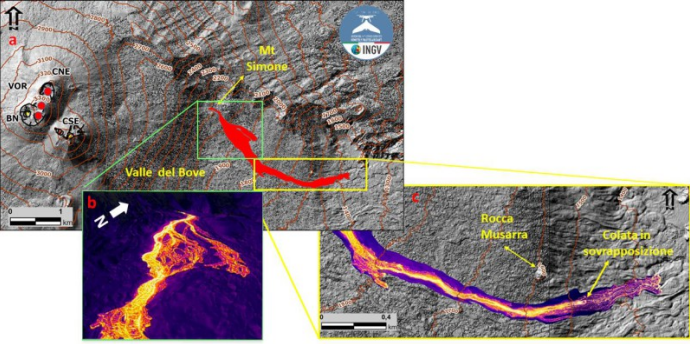
Map of the lava field, created from a SKYSAT satellite image from January 2, 2026, a drone image from January 3, 2026, and a thermal orthomosaic also acquired by drone on January 3, 2026. The shaded relief of the summit area of Mount Etna was obtained by processing drone images acquired in June and October 2025. Geoid contour lines are plotted every 100 meters. CSE = Southeast Crater, CNE = Northeast Crater, VOR = Chasm, BN = Bocca Nuova. The map is updated as of January 3, 2026.
In particular, regarding eruptive activity at the summit craters, observations were very irregular during the week due to unfavorable weather conditions and intense cloud cover over the summit area. On December 29, explosive activity continued with weak ash emissions from vent BN-2 of Bocca Nuova Crater (BN) and Voragine Crater (VOR). The ash emissions dispersed rapidly in the summit area from the vent that opened on December 27 on its upper eastern flank.
Northeast Crater (CNE) produced ash emissions and sporadic, weak lightning during the night. Since December 30, summit activity has been concentrated mainly at Voragine Crater (VOR), which has produced continuous, albeit variable, Strombolian activity and weak ash emissions.
On January 1st, at approximately 4:30 PM UTC, as weather conditions improved, surveillance cameras revealed effusive activity in the Valle del Bove. Based on field observations by INGV staff and satellite imagery, the lava flow was attributed to the opening of at least two eruptive vents just above Mount Simone, at an estimated altitude of approximately 2100 and 2050 meters. The effusive vents exhibited the typical morphology of hornitos, due to intense ejection activity. Around 6:00 PM UTC, the lava field was observed to be structured into several flows, with the most advanced front located immediately south of Rocca Musarra, at an altitude of approximately 1570 meters. On January 2, the lava field was well supplied and the most advanced front had reached an altitude of 1,420 m and a maximum length of about 2.80 km.
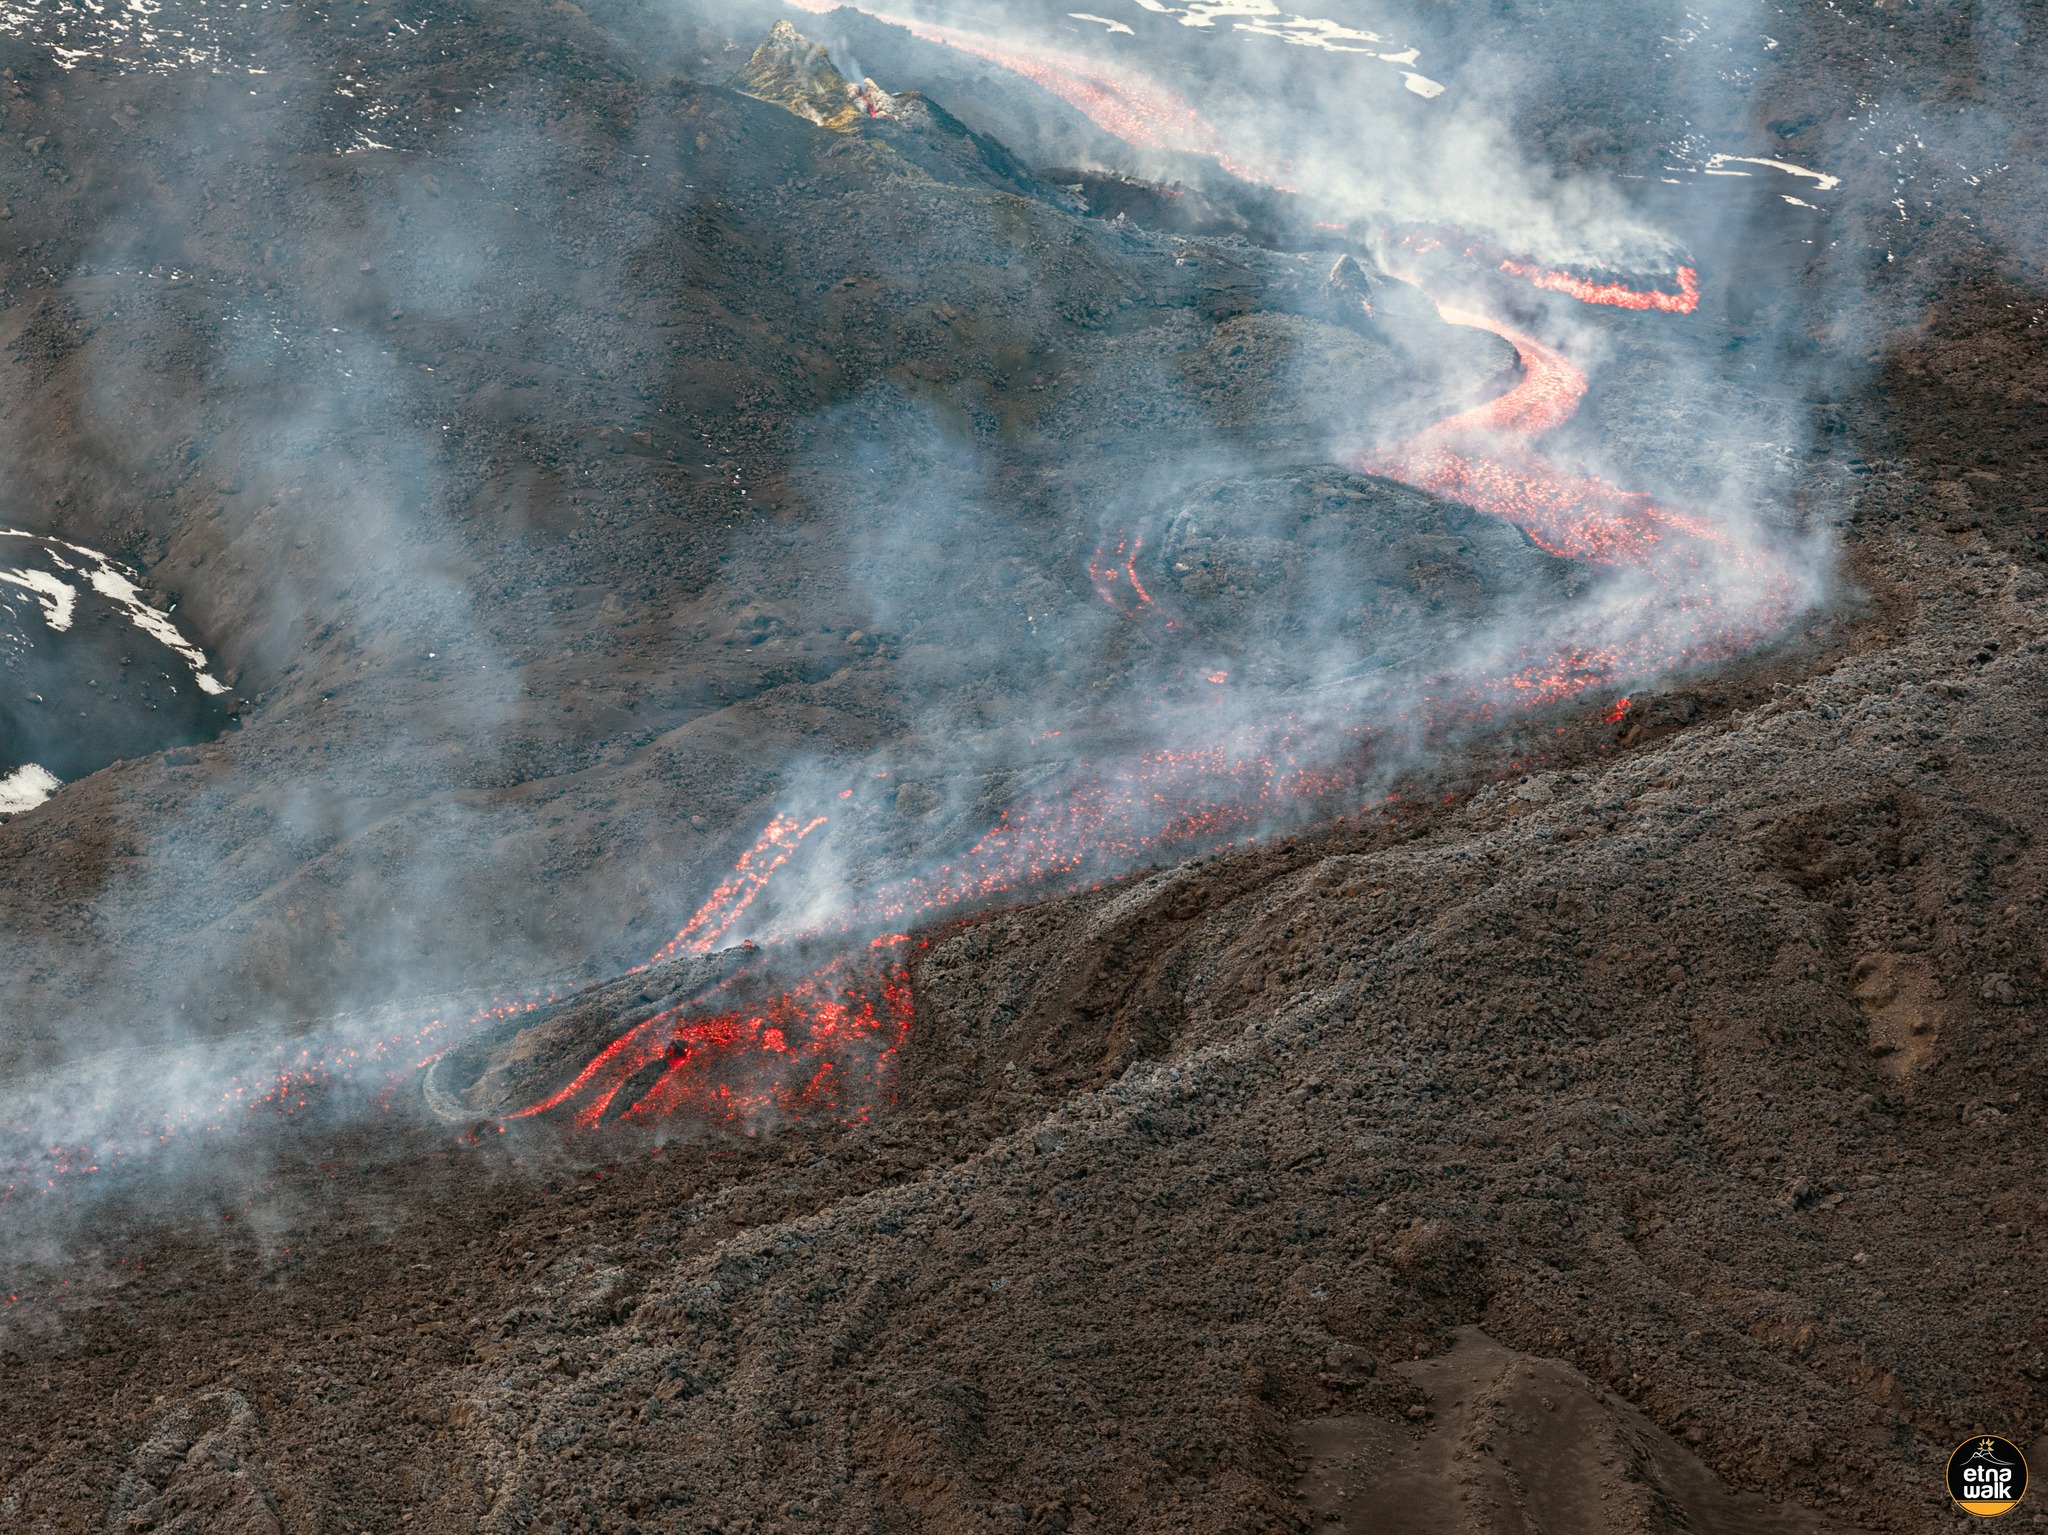
On January 3, the lava field was still being fed, and field surveys conducted by INGV staff using drones showed that the most advanced front was slowly progressing and had stabilized at 1,380 m, approximately 330 m higher than the previous day, reaching a maximum length of 3.14 km. Drone images also revealed that the most active area of the lava field was located further upstream from Rocca Musarra, between 1,800 and 1,700 m above sea level. In this area, the lava field was more extensive due to the development of several lava channels. A main lava flow was observed, superimposed on those of previous days, from which several smaller flows branched off.
Around 11:00 UTC, the front of the overlapping lava flow reached an altitude of approximately 1,600 m above sea level. Analysis of drone imagery estimated that at 11:00 UTC on January 3, the lava field covered an area of 0.55 × 10⁶ m² and had a volume of 2.2 × 10⁶ m³ (with a margin of error of approximately 40%). On January 4, the Valle del Bove lava field was still active, with the lava flow’s front having reached an altitude of 1,380 m above sea level on the third day. It was now stationary and cooling, and the lava flow covered the front, which had descended from 1,600 m above sea level to about 1,400 m above sea level, after traveling an additional 200 to 300 m.
Source : INGV.
Photo : Giuseppe Distefano
Hawaii , Kilauea :
U.S. Geological Survey , Wednesday, January 7, 2026, 10:07 AM HST (Wednesday, January 7, 2026, 20:07 UTC)
19°25’16 » N 155°17’13 » W,
Summit Elevation 4091 ft (1247 m)
Current Volcano Alert Level: WATCH
Current Aviation Color Code: ORANGE
Activity Summary:
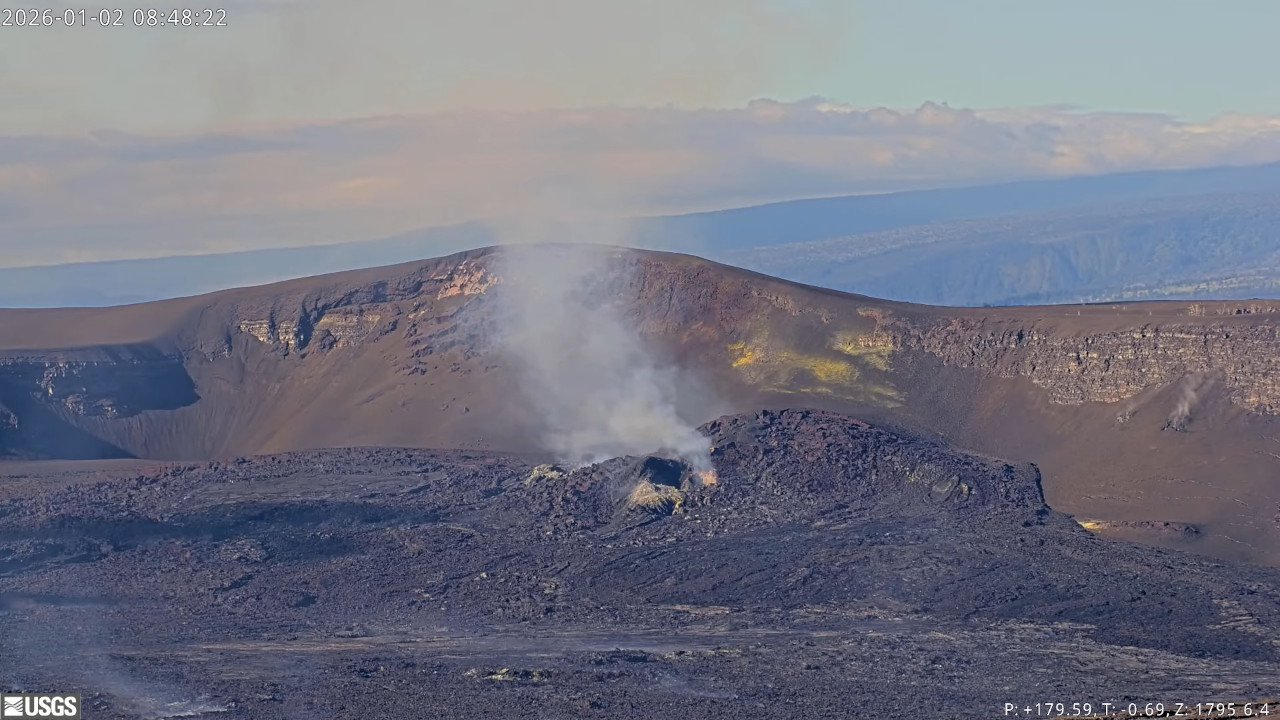
The ongoing Halemaʻumaʻu eruption is paused. Intermittent glow was seen from both vents overnight, with some spattering visible occasionally within the north vent. Kīlauea summit region showed slow inflation on tiltmeter UWD over the past 24 hours. Forecasting models suggest the window for lava fountaining episode 40 is between January 9 and 14. Kīlauea’s East Rift Zone and Southwest Rift Zone remain quiet.
The issue with volcano monitoring data plots not updating on the USGS website has been resolved and monitoring data plots are now up-to-date.
Summit Observations:
Overnight, intermittent glow was observed from both the north and south vents, and spatter was occasionally visible within the north vent. Seismometers are recording low level tremor from the vent region with poorly defined, weak bursts of tremor 10-20 minutes apart.
Since the end of episode 39, the Uēkahuna tiltmeter (UWD) has recorded 20.7 microradians of re-inflation beneath Kīlauea summit. Tilt recorded by UWD has been relatively flat over the past two days, but SDH (Sandhill) and SMC (Summer Camp) show the resumption of increasing tilt at those sites over the past 24 hours..
Volcanic gas emission rates have dropped significantly since the end of episode 39 but probably remain in the range of 1,000 to 5,000 tonnes of sulfur dioxide (SO2) per day, as typically observed during previous eruptive pauses.
Rift Zone Observations:
Rates of seismicity and ground deformation remain very low in the East Rift Zone and Southwest Rift Zone. SO2 emissions from the East Rift Zone remain below the detection limit.
Analysis:
The rapid rebound of inflationary tilt and presence of low-level volcanic tremor after episode 39 indicate that another lava fountaining episode is likely to occur. Magma is high in the vents and early this morning spattering at the north vent increased and was erupting a few of the clasts onto the apron around the vent. Over the past 48 hours, the UWD tiltmeter showed only about half a microradian of that inflation, but SDH (Sandhill) and SMC (Summer Camp) show the resumption of increasing tilt at those sites over the past 24 hours. The UWD tiltmeter may be seeing the effect of heavy rainfall (18 cm or 7 in) in the past few days. The slowing of inflation has pushed the forecast window for the start of episode 40 fountaining back slightly. Forecast models suggest the window for episode 40 is now between January 9 and 14.
Source et photo : HVO.
Indonesia , Semeru :
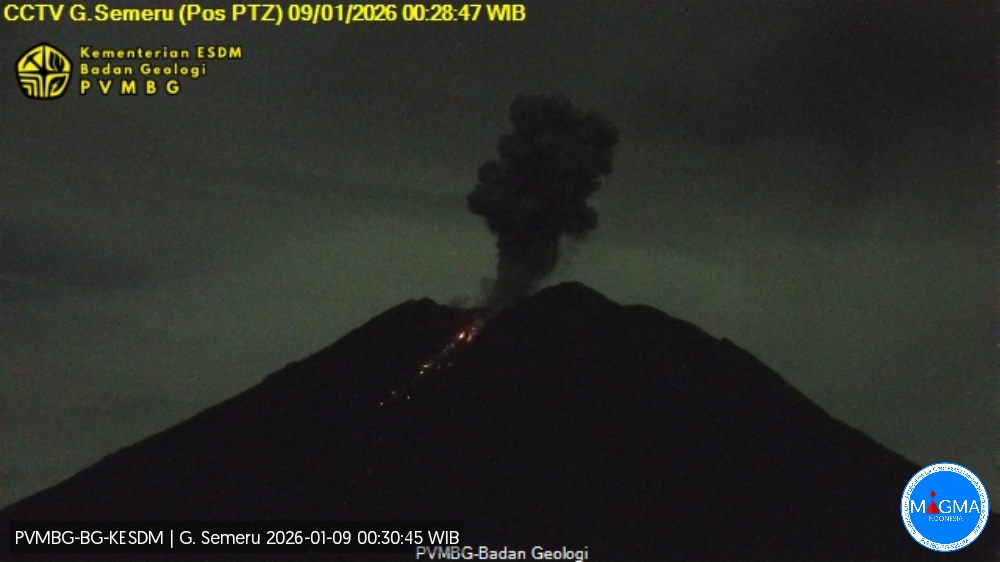
Mount Semeru erupted on Friday, January 9, 2026, at 0:28 a.m. WIB. An ash column was observed approximately 1,000 meters above the summit (at an altitude of about 4,676 meters). This column, white to gray in color and of moderate intensity, was drifting northward. At the time of writing, the eruption was still ongoing.
VOLCANO OBSERVATORY NOTICE FOR AVIATION – VONA
Issued : January 8 , 20260108/1728Z
Volcano : Semeru (263300)
Current Aviation Colour Code : ORANGE
Previous Aviation Colour Code : orange
Source : Semeru Volcano Observatory
Notice Number : 2026SMR068
Volcano Location : S 08 deg 06 min 29 sec E 112 deg 55 min 12 sec
Area : East java, Indonesia
Summit Elevation : 11763 FT (3676 M)
Volcanic Activity Summary :
Eruption with volcanic ash cloud at 17h28 UTC (00h28 local).
Volcanic Cloud Height :
Best estimate of ash-cloud top is around 14963 FT (4676 M) above sea level or 3200 FT (1000 M) above summit. May be higher than what can be observed clearly. Source of height data: ground observer.
Other Volcanic Cloud Information :
Ash cloud moving to north. Volcanic ash is observed to be white to gray. The intensity of volcanic ash is observed to be medium.
Remarks :
Eruption recorded on seismogram with maximum amplitude 22 mm and maximum duration 121 second.
Source et photo : Magma Indonésie .
Colombia , Puracé – Los Coconucos volcanic chain :
Popayán, January 8, 2026, 9:00 AM
Regarding the monitoring of activity in the Los Coconucos volcanic chain, the Colombian Geological Survey (SGC), an agency under the Ministry of Mines and Energy, reports the following:
Since the publication of yesterday’s extraordinary bulletin and continuing to this day, earthquakes related to fluid movements within the volcanic edifice have continued to occur. These are long-period (LP) tremor (TR) earthquakes. These earthquakes were located beneath the crater of the Puracé volcano, at depths of less than 1 km, and were associated with the internal dynamics of volcanic gases and their release into the atmosphere. Among these seismic signals, one (1) was linked to an ash emission that dispersed primarily to the Northwest, following the wind direction, reaching an altitude of 500 meters above the summit of the volcano.

Furthermore, low-magnitude seismic activity associated with rock fracturing continued to be recorded. These earthquakes were primarily located beneath the Piocollo volcano, at depths of 1 to 2 km. Sulfur dioxide (SO₂) emissions into the atmosphere and elevated temperatures in the crater area of the Puracé volcano, linked to gas emissions from within the volcano, persist. Degassing continues through fissures in the craters of the Curiquinga and Piocollo volcanoes, although no ash emissions have been detected. As long as the orange alert level remains in effect, temporary fluctuations in volcanic activity are possible, meaning that activity may sometimes decrease compared to previous days or weeks. However, this does not necessarily imply that the volcano has returned to a stable level of activity. To return to the yellow alert level (greater stability), a reasonable period of time is needed to assess all monitored parameters and determine any trend indicating a return to this level..
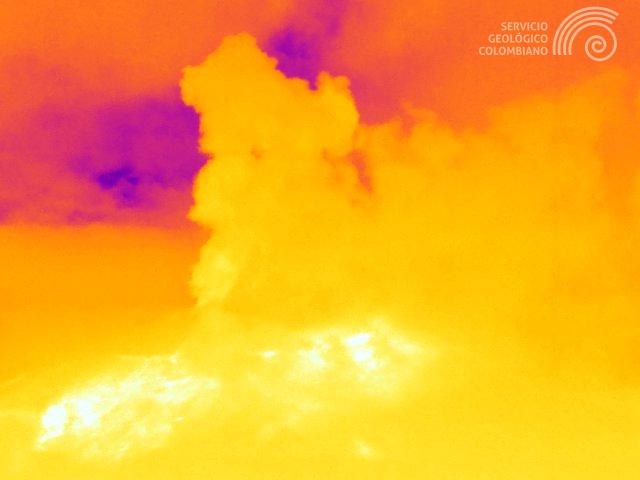
A thermal imaging camera from MinaIR, located 2.2 km north of the Puracé volcano, shows an ash emission recorded on January 8, 2026, at 2:11 a.m. (local time).
Given the above, the Geological Survey of Colombia (SGC) recommends staying away from the craters of the Puracé, Piocollo, and Curiquinga volcanoes, as well as their surrounding areas. We suggest closely monitoring the situation through special bulletins and information published on our official channels, and following the instructions of local and departmental authorities and the National Unit for Disaster Risk Management (UNGRD).
The volcanic activity level remains at orange alert: Volcano exhibiting significant variations in monitored parameters.
Source et Photo : SGC.