July 2 , 2025.
Italy / Sicily , Etna :
WEEKLY BULLETIN, from June 23, 2025 to June 29, 2025 (publication date: July 1, 2025)
ACTIVITY STATUS SUMMARY
Based on monitoring data, the following points are highlighted:
1) VOLCANOLOGICAL OBSERVATIONS: Variable degassing activity in the summit craters.
2) SEISMOLOGICAL OBSERVATIONS: Absence of seismic activity due to fracturing with Ml >=2.0. Tremor amplitude is mainly medium to low.
3) INFRASOUND: Medium to low infrasound activity.
4) GROUND DEFORMATION: Ground deformation monitoring networks have not recorded any significant variations.
5) GEOCHEMISTRY: Average SO₂ flux
CO₂ flux from the ground (Etna Gas Network): decreasing from average to low values.
Dissolved CO2 in groundwater (Etna Acque Network): no update.
Helium isotope ratio at peripheral sites: no update, latest data correspond to average values (June 4).
6) SATELLITE OBSERVATIONS: Thermal activity observed by satellite in the summit area was generally low in intensity, with some moderate thermal anomalies.
Map of the June 19 lava flow superimposed on the shaded relief of the Etna summit area, obtained by processing drone images acquired on June 4. Geoidic contour lines are plotted every 100 meters. CSE = Southeast Crater, CNE = Northeast Crater, VOR = Voragine, BN = Bocca Nuova.
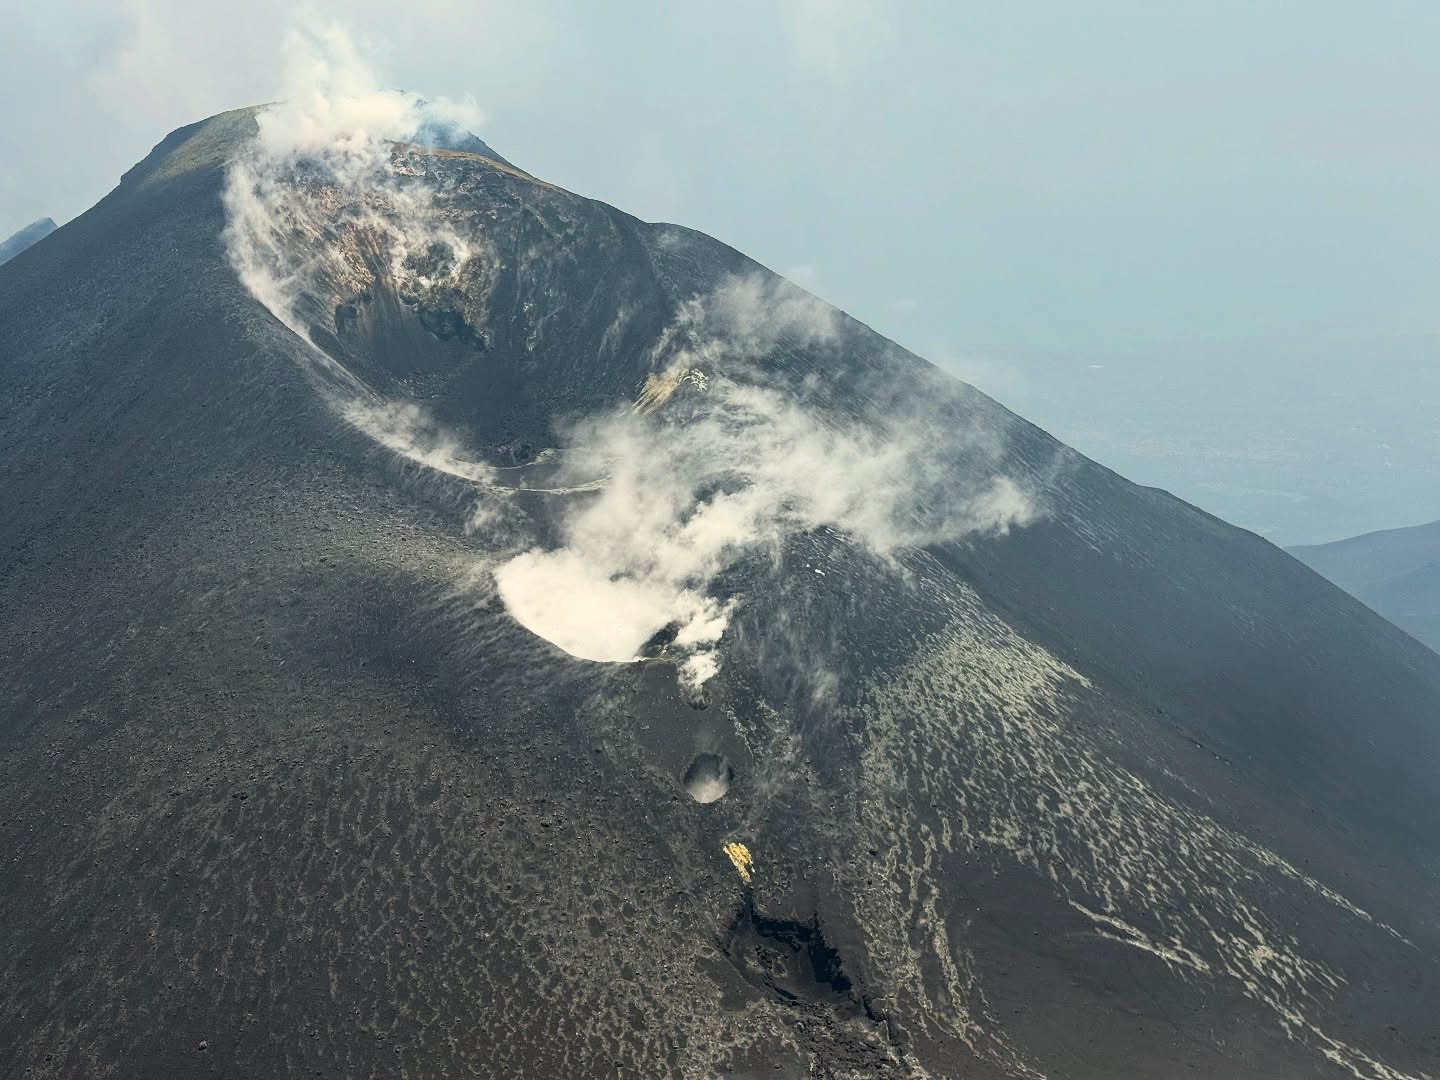
VOLCANOLOGICAL OBSERVATIONS
Monitoring of Mount Etna’s volcanic activity was carried out using image analysis from the INGV surveillance camera network, Osservatorio Etneo (INGV-OE).
During the week in question, the summit craters were affected by degassing at varying rates.
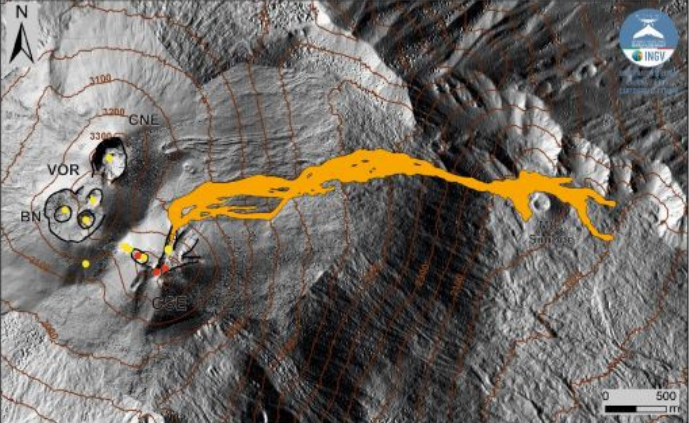
Map of the June 19th lava flow superimposed on the shaded relief of the summit area of Mount Etna, obtained by processing drone images acquired on June 4th. Geoidic contours are plotted every 100 meters. CSE = Southeast Crater, CNE = Northeast Crater, VOR = Voragine, BN = Bocca Nuova.
The map of the June 19th lava flow has been improved compared to the one published in the previous bulletin thanks to the processing of drone images acquired on June 24th. The flow reached an altitude of 1900 m, with a total length of 4.1 km, a surface area of 6.8 × 10⁵ m², and a volume of 1.4 × 10⁶ m³. This volume is preliminary and may contain an error of 40%.
Source : INGV
Photos : Fabrizio Zuccarello , INGV .
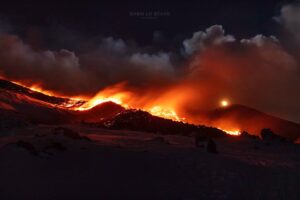
Italy , Stromboli :
WEEKLY BULLETIN, from June 23, 2025 to June 29, 2025 (publication date: July 1, 2025)
SUMMARY OF ACTIVITY STATUS
Based on monitoring data, the following points are highlighted:
1) VOLCANOLOGICAL OBSERVATIONS: During the period studied, ordinary Strombolian eruptive activity accompanied by spattering was observed in the northern zone. The total hourly frequency of explosions fluctuated around average values (7 to 11 events/hour). The intensity was low and medium in both the northern and central-southern crater areas.
2) SEISMOLOGICAL: The monitored seismological parameters do not show any significant variations.
3) GROUND DEFORMATION: Ground deformation monitoring networks did not measure any significant variations. 4) GEOCHEMISTRY: SO2 flux: at a medium level and moderately increasing. CO2 flux from the soil in the Pizzo area (STR02) at high values.
C/S ratio in the plume: at medium values.
Helium isotope ratio (R/Ra) dissolved in the thermal aquifer: No update.
Soil CO2 flux in the San Bartolo area: No update.
Soil CO2 flux in the Scari area: medium to high values.
5) SATELLITE OBSERVATIONS: Thermal activity observed by satellite in the summit area was generally of low intensity, with some isolated thermal anomalies of moderate level.
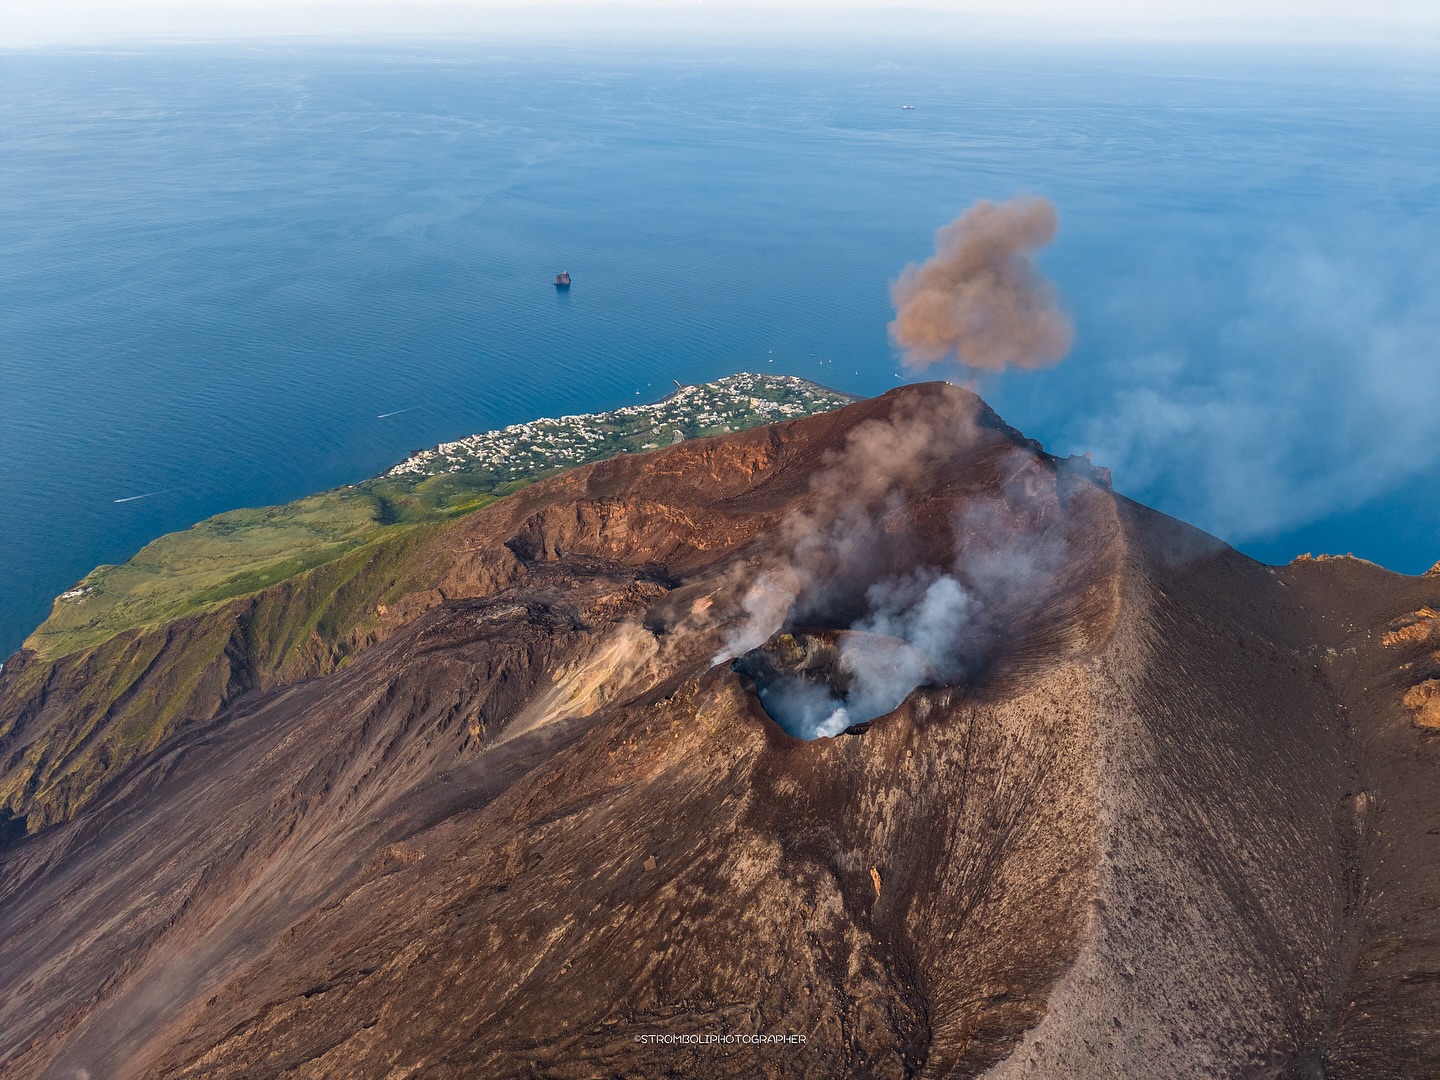
VOLCANOLOGICAL OBSERVATIONS
During the observation period, Stromboli’s eruptive activity was characterized by analyzing images recorded by INGV-OE surveillance cameras located at an altitude of 190 m (SCT-SCV) and at Punta dei Corvi (SPCT). Explosive activity was mainly produced by four eruptive vents located in the North Crater area and by at least two vents located in the Central-South Crater area.
Observations of explosive activity recorded by surveillance cameras
In the North (N) Crater area, four active vents were observed, producing low-intensity explosive activity (the eruptive products reached a height of less than 80 m) and sometimes moderate-intensity explosive activity (the height of the products ranged from 80 to 150 m). Furthermore, on June 23 and 24, weak eruptions were observed in the N1 sector. The eruptive products consisted mainly of coarse materials (bombs and lapilli). The average explosion frequency ranged from 7 to 11 events/hour.
In the South-Central (SC) zone, explosive activity was absent for most of the observed period, and only a few low-intensity explosions with the emission of fine materials were occasionally observed. The average explosion frequency ranged from 0 to 1 event/hour.
Source : INGV
Photo : Stromboli stati d’animo / Sebastiano Cannavo
Alaska , Iliamna :
AVO/USGS Volcanic Activity Notice
Current Volcano Alert Level: NORMAL
Previous Volcano Alert Level: UNASSIGNED
Current Aviation Color Code: GREEN
Previous Aviation Color Code: UNASSIGNED
Issued: Tuesday, July 1, 2025, 11:41 AM AKDT
Source: Alaska Volcano Observatory
Notice Number: 2025/A406
Location: N 60 deg 1 min W 153 deg 5 min
Elevation: 10016 ft (3053 m)
Area: Cook Inlet-South Central
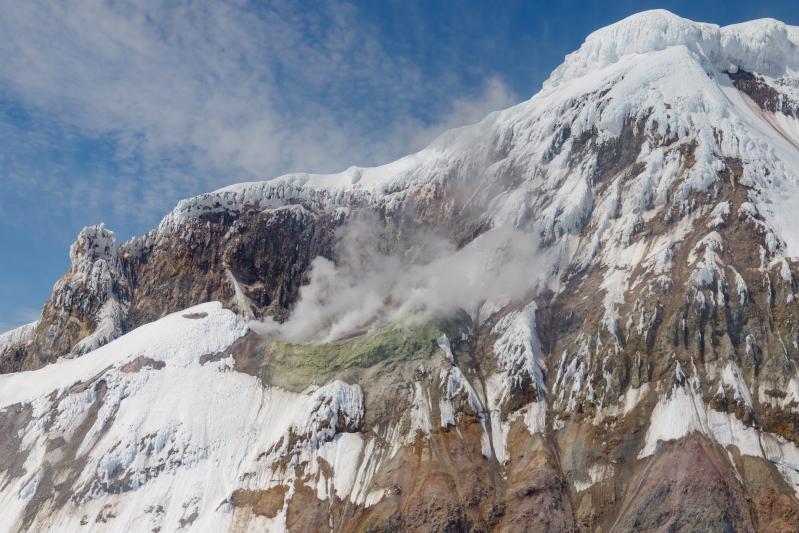
liamna Volcano fumarole field imaged during the June 2024 gas survey.
Volcanic Activity Summary:
Repairs to the seismic network were completed last week and there is now sufficient data available to monitor activity at Iliamna Volcano. The Aviation Color Code and Volcano Alert Level are being changed to GREEN/NORMAL from UNASSIGNED/UNASSIGNED.
Recent Observations:
[Volcanic cloud height] NA
[Other volcanic cloud information] NA
Remarks:
Iliamna Volcano is located on the western side of lower Cook Inlet in the Lake Clark National Park. Iliamna is a snow-covered stratovolcano which rises 10,020 feet above sea level. Although steam plumes occur on its eastern flanks, there has been no historic volcanic activity at Iliamna. Iliamna is located 225 km (140 miles) southwest of Anchorage and 113 km (70 miles) southwest of Homer.
Source : AVO.
Photo : Mota, Rui / AVO / USGS.
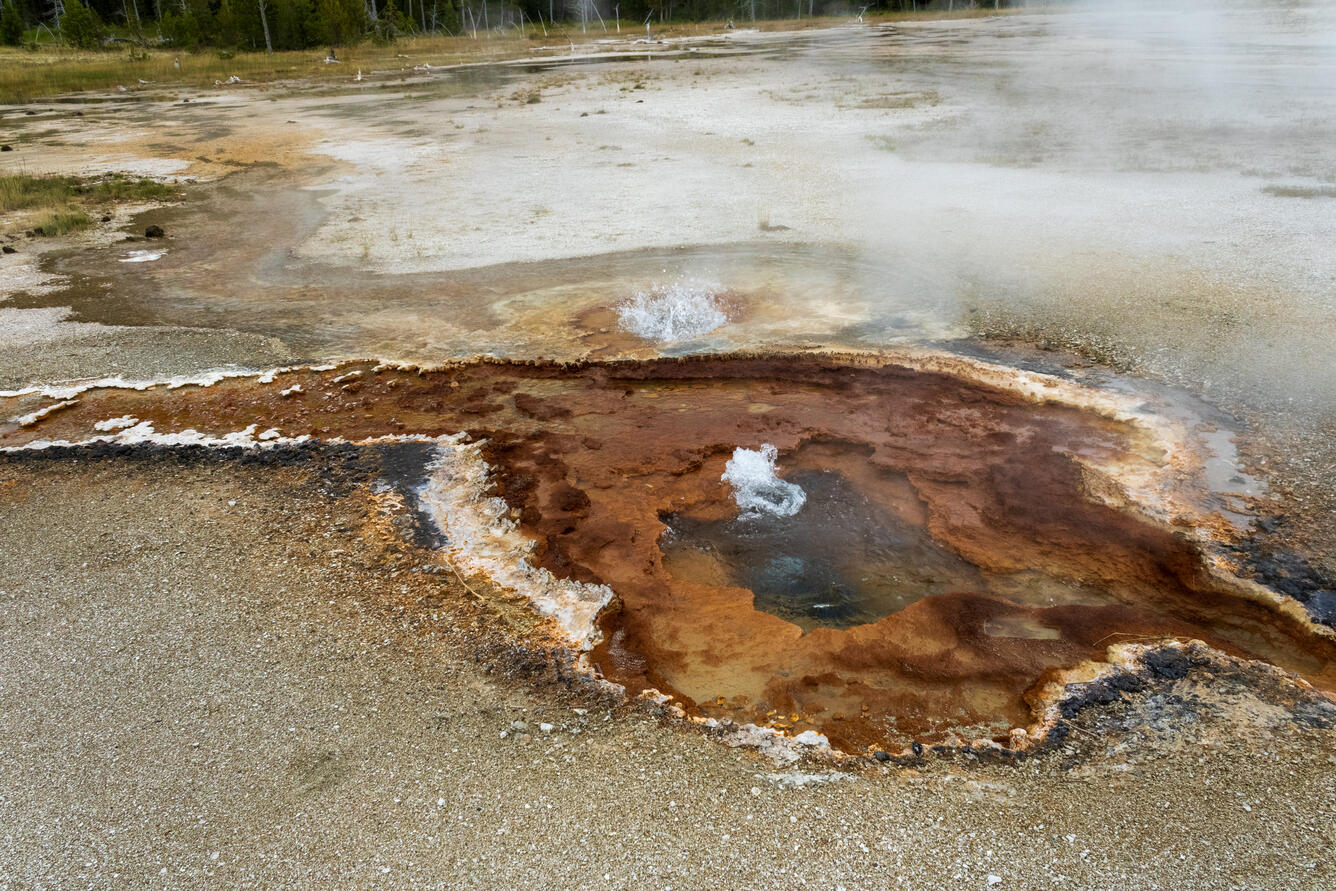
United – States , Yellowstone :
YELLOWSTONE VOLCANO OBSERVATORY MONTHLY UPDATE , U.S. Geological Survey
Tuesday, July 1, 2025, 10:27 AM MDT (Tuesday, July 1, 2025, 16:27 UTC)
44°25’48 » N 110°40’12 » W,
Summit Elevation 9203 ft (2805 m)
Current Volcano Alert Level: NORMAL
Current Aviation Color Code: GREEN
Summary
Yellowstone Caldera activity remains at background levels, with 60 located earthquakes in June (largest = M2.7). Deformation measurements indicate that the annual summertime pause in long-term caldera subsidence started in June. Another small eruption of Black Diamond Pool in Biscuit Basin was recorded by a webcam on June 12 at 6:25 a.m. MDT.
Recent Work and News
Minor eruptions are occurring at Steamboat Geyser, indicating that it may have a major eruption in the days or weeks to come. So far in 2025, there have been two major eruptions there.
The new webcam at Biscuit Basin, installed in mid-May 2025 to track activity at Black Diamond Pool (where a hydrothermal explosion occurred last summer), continues to send static images . Image analysis indicated changes in the pool on the morning of June 12, and downloaded video captured a small eruption from the pool at 6:25 a.m. MDT—the second eruption from Black Diamond Pool that has been captured on video by this camera system.
During June, Yellowstone Volcano Observatory scientists conducted field work to better understand the glacial and geologic history of the region, and engineers began work to install two new seismic monitoring stations in the park—one at Biscuit Basin, and one near Slough Creek in the northeast part of the park. In July, additional maintenance and installation work related to monitoring stations is planned.
Seismicity
During June 2025, the University of Utah Seismograph Stations, responsible for the operation and analysis of the Yellowstone Seismic Network, located 60 earthquakes in the Yellowstone National Park region. The largest event of the month was a micro earthquake of magnitude 2.7 located about 5 miles north-northwest of West Yellowstone, Montana, on June 4 at 2:50 p.m. MDT.
There were no swarms identified during the month of June.
Yellowstone earthquake activity remains at background levels.
Ground Deformation
Continuous GPS stations in Yellowstone Caldera recorded the onset of the annual summertime pause in subsidence or transition to slight uplift, which is caused by seasonal changes related to snowmelt and groundwater conditions. Since October, the net caldera subsidence has been about 3 centimeters (1.2 inches). This pattern and rate of subsidence, with pauses or slight reversals during summer months, continues a trend that started in 2015–2016. No significant deformation has been measured near Norris Geyser Basin over the past few months.
Source : YVO
Photo : Cinnamon Spouter / USGS .
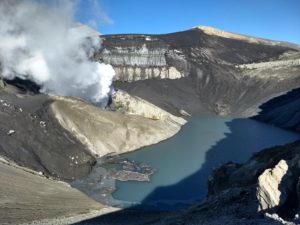
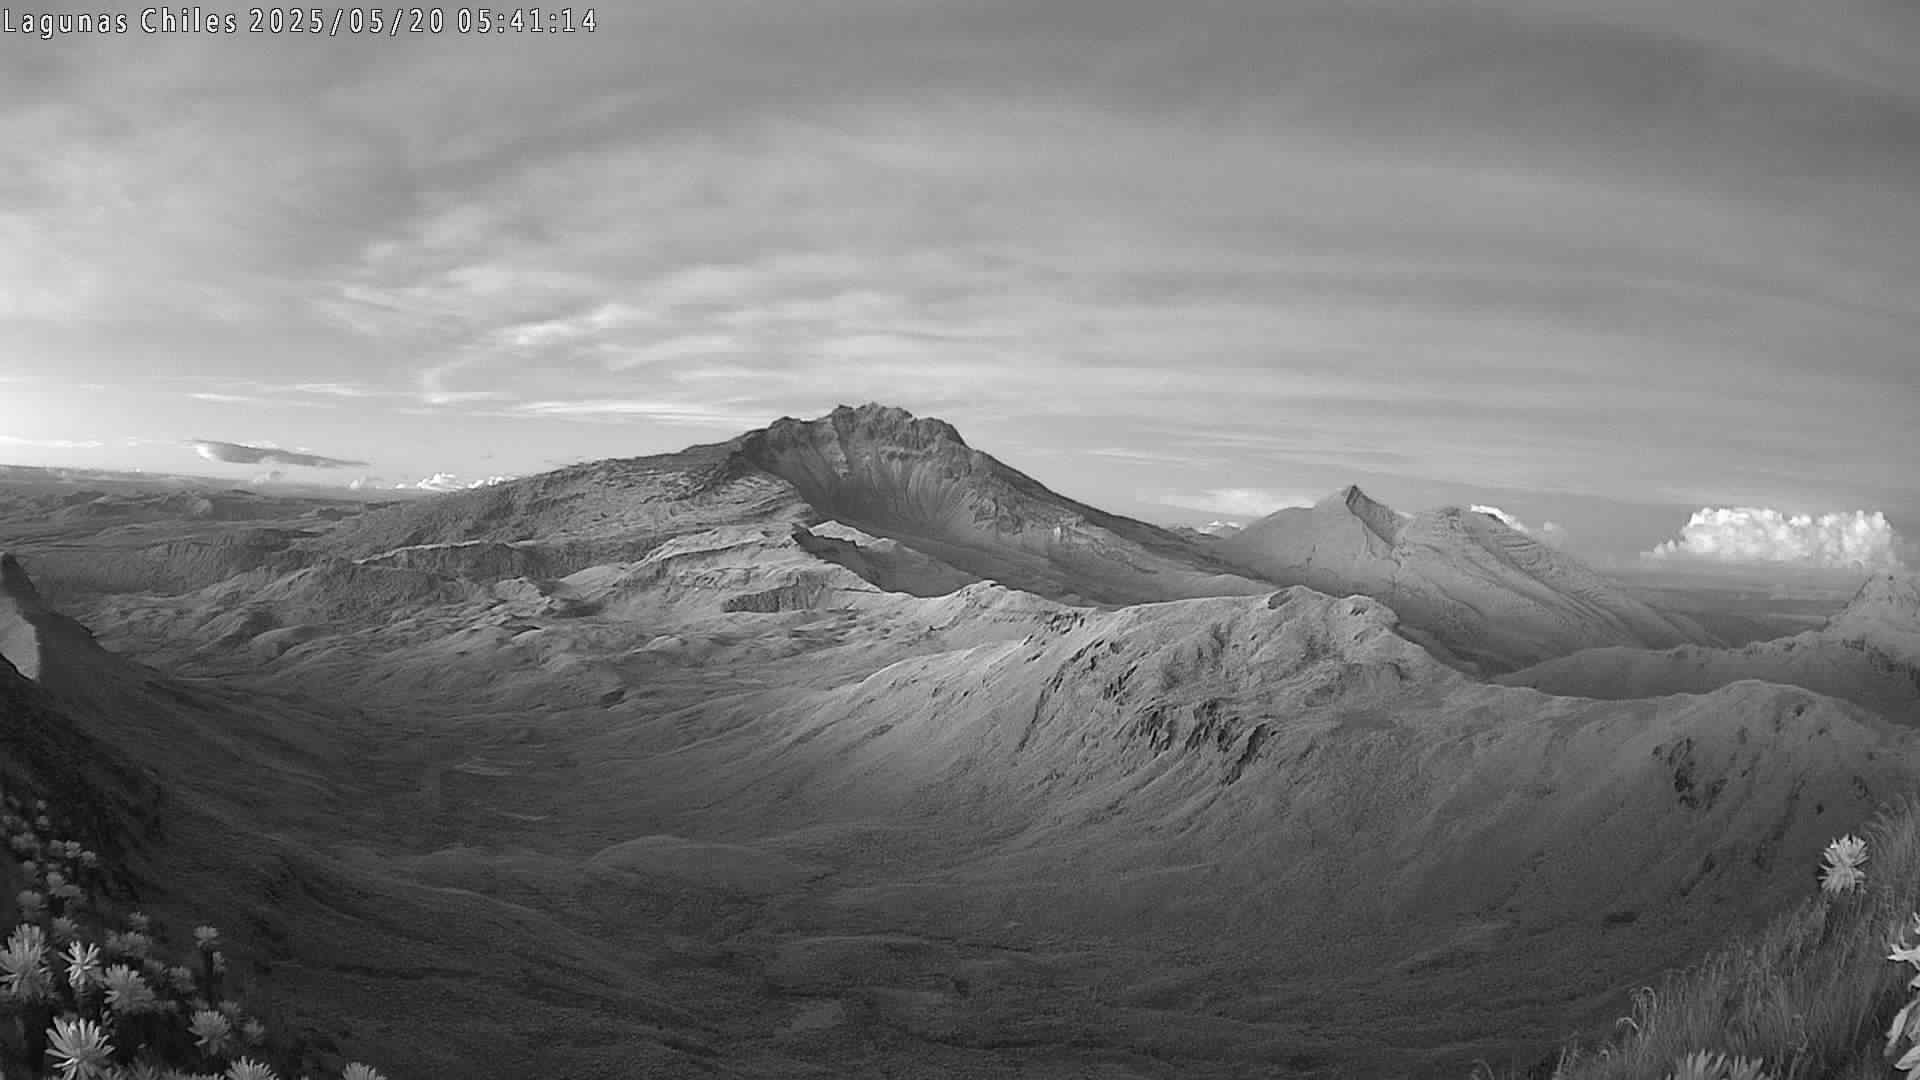
Colombia , Chiles / Cerro Negro :
Following monitoring of the activity of the Chiles-Cerro Negro volcanic complex (CVCCN), the Colombian Geological Survey (SGC), an entity affiliated with the Ministry of Mines and Energy, reports that:
From June 24 to 30, 2025, the main variations in the monitored parameters compared to the previous week were as follows:
● A decrease in seismic occurrence and energy release was recorded. Seismicity associated with rock fractures continues to predominate within the volcanic complex.
● The seismicity was located in a location similar to that reported last week, primarily approximately 2 km apart, in an area equidistant from the summits of Cerro Negro and Chiles, aligned from south to north, with a depth of between 2 and 6 km from the summit of Chiles (4,700 m above sea level) and a maximum magnitude of 1.2. Other earthquakes were located throughout the Chiles Volcanic Region, at distances of up to 12 km, at depths between 6 and 18 km from the summit of Chiles (4,700 m above sea level), and with a maximum magnitude of 1.2. No felt earthquakes were reported.
Satellite sensors and ground stations measuring crustal deformation continue to show changes related to inflationary processes in the volcanic area.
Based on the assessment and correlation of monitored parameters, the SGC recommends closely monitoring developments through weekly bulletins and other information published through our official channels, as well as instructions from local and departmental authorities and the National Disaster Risk Management Unit (UNGRD).
Volcanic activity remains on alert. Yellow: Active volcano with changes in the baseline behavior of monitored parameters and other manifestations.
Source et photo : SGC .