May 21 , 2022.
Italy / Sicily , Etna :
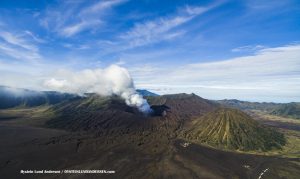
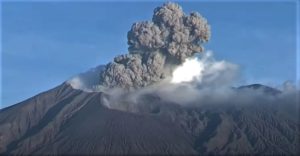
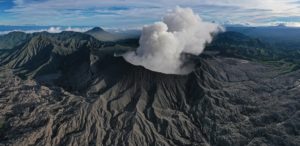
Communique on the activity of Etna, May 20, 2022, 19:01 (17:01 UTC).
The National Institute of Geophysics and Volcanology, Osservatorio Etneo, announces that from 15:30 UTC a new effusive vent opened on the north side of the Southeast Crater, at an altitude of approximately 3250 m, immediately at Northwest of the mouth which opened on May 12. A small lava flow is currently emitted from the new vent towards the northeast. At the same time, the lava flow from the mouth of May 12 continues, whose lava fronts are deposited in the Valle del Leone.
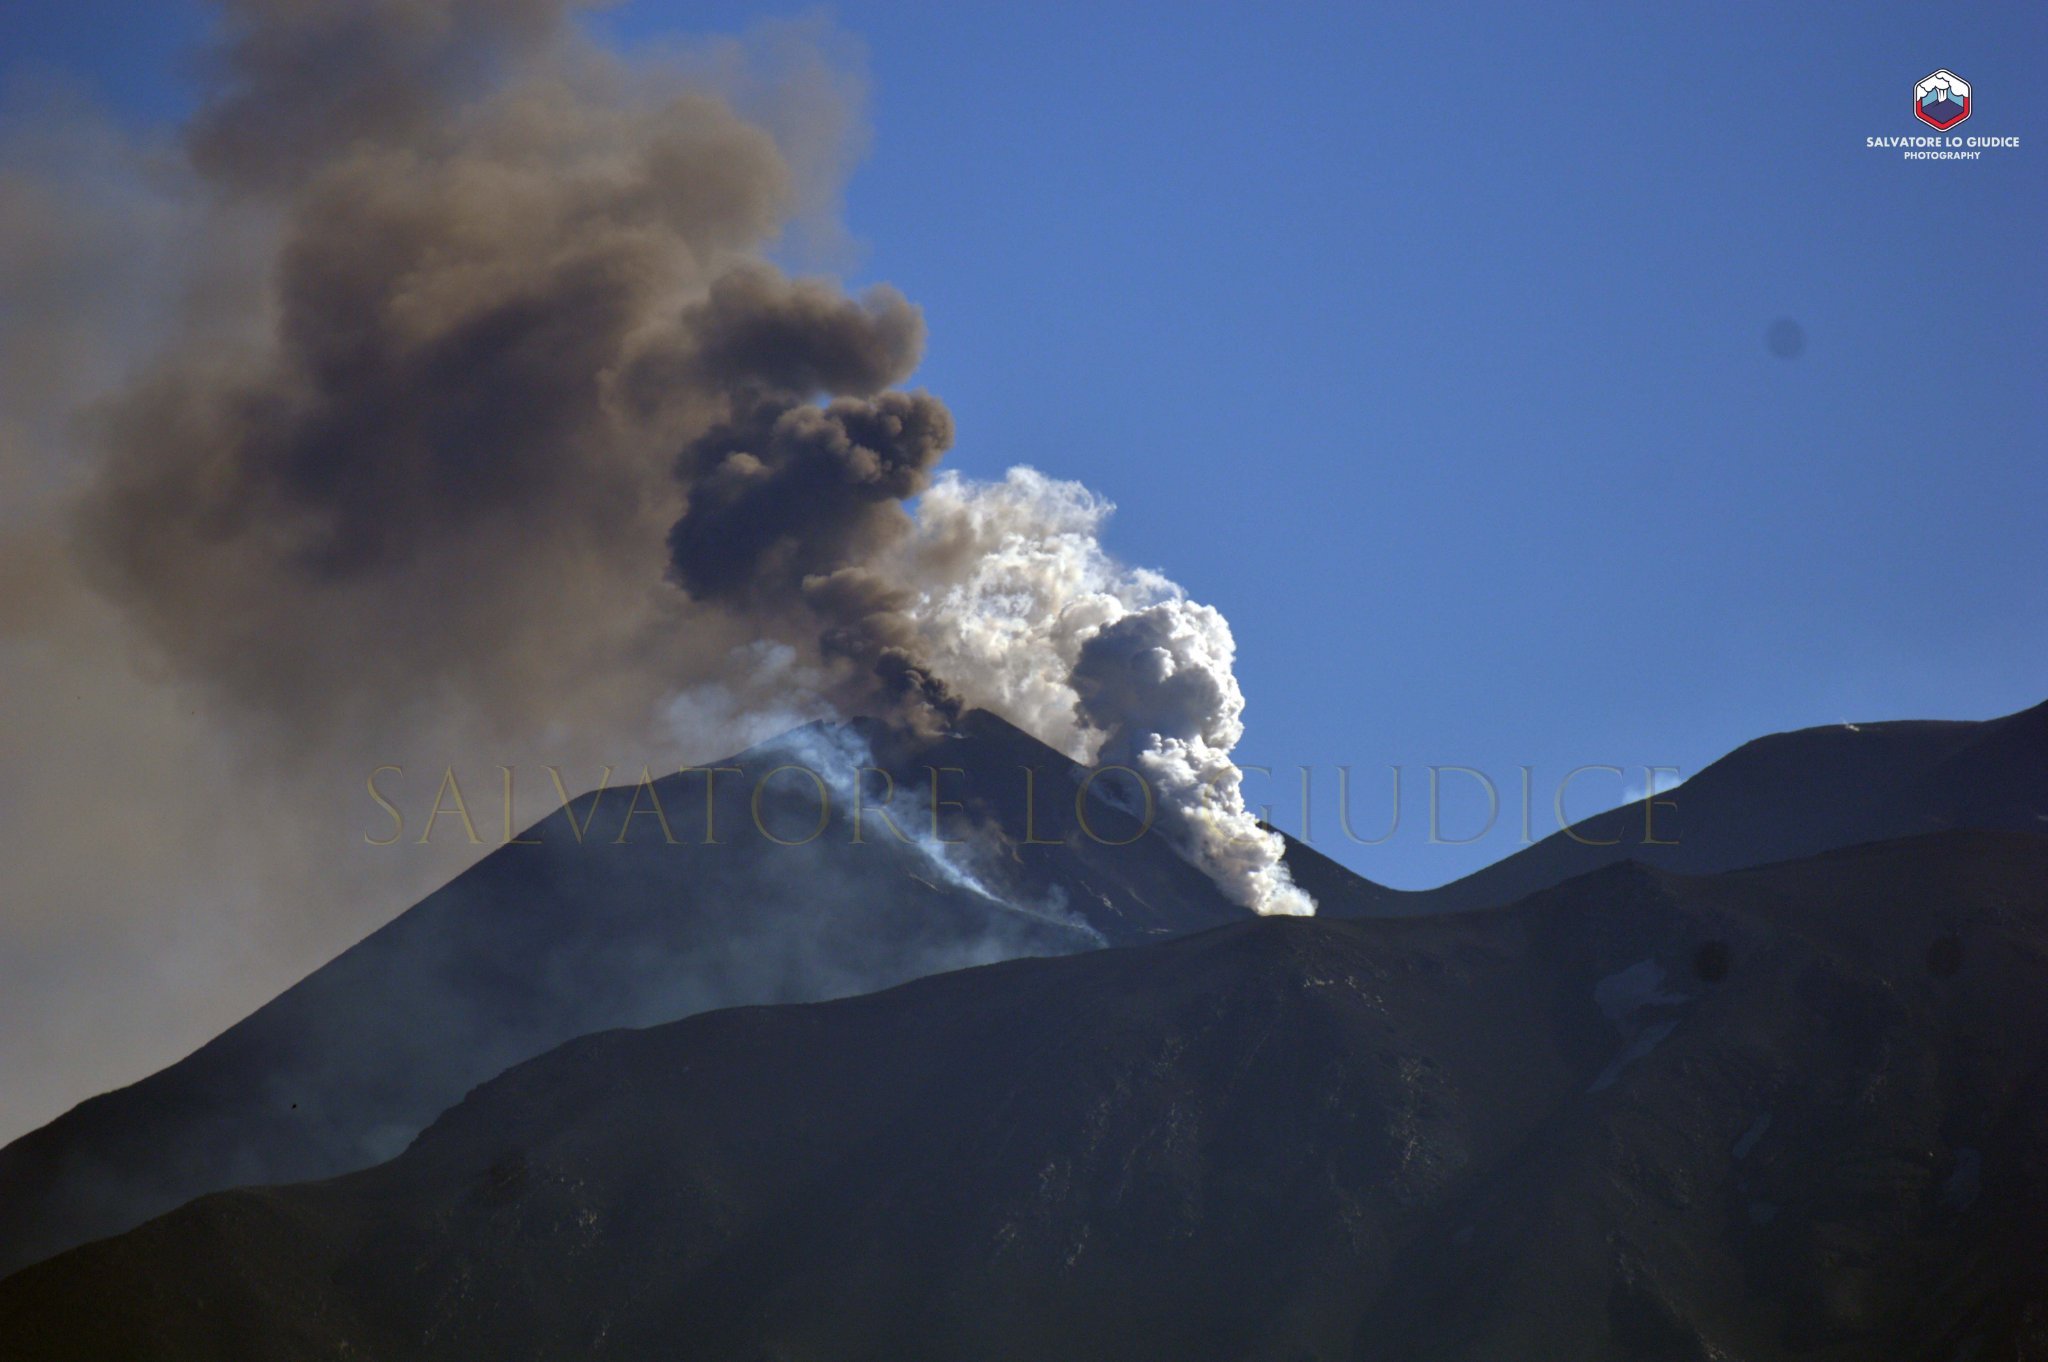
Finally, the Southeast Crater continues to be affected by an explosive Strombolian activity, of variable intensity, which from 15:30 UTC is accompanied by a discontinuous emission of diluted ash which disperses towards the Southwest. This ash emission ended at 4:40 p.m. UTC.
From the seismic point of view, the average amplitude of the volcanic tremor, while showing large fluctuations in its trend, remains in the range of high values.
The source of the volcanic tremor is located under the Southeast Crater, at a depth of about 3000m. The infrasonic activity of the Southeast Crater is quite sustained both in the number and in the energy of the infrasonic transients.
The signals acquired by the GNSS and inclinometric networks do not show any significant variations related to the phenomenology in place.
Further updates will be communicated soon.
Source : INGV.
Photos : Salvatore Lo Giudice via ingv ,INGV.
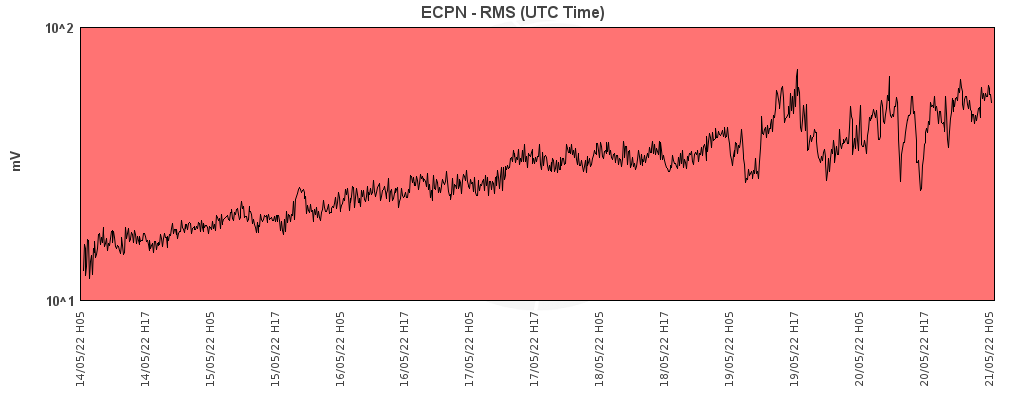
Chile , Nevados de Chillan :
The technical alert level is maintained at YELLOW TECHNICAL ALERT: Changes in the behavior of volcanic activity.
Seismology
Volcano-tectonic (VT) seismicity recorded a total of 50 events caused by brittle rupture processes; the most energetic event had a local magnitude (ML) equal to 1.9, located 4.4 km east southeast (ESE) of the volcanic edifice, with a depth of 4.3 km from the Mountain peak. This seismicity, which was spatially and temporally linked in the previous phases of this eruptive cycle with changes in the deformation of the volcanic edifice, remains at low levels compared to periods of greater activity.
Long period (LP), explosion (EX) and tremor (TR) seismicity continued to be recorded, associated with fluid dynamics within the volcanic system. 904 LP-type earthquakes were classified, including 217 linked to explosions at surface level, due to the presence of acoustic waves and/or gaseous emissions, often with the addition of particulate matter. The size of the largest LP earthquake estimated from the reduced displacement parameter (DR) reached a value equal to 156 cm2. Regarding TR type seismicity, 329 episodes were identified, the most important of which reached a DR of 111 cm2. The daily energy levels calculated for earthquakes associated with fluid movement remained within a range considered low compared to periods of greater volcanic activity, with a greater presence of tremor-type seismicity; In addition, no high energy LP type earthquake associated with explosions with emission of pyroclastic flows was recorded.
Fluid Geochemistry
Data on sulfur dioxide (SO2) emissions obtained by optical differential absorption spectroscopy (DOAS) equipment, corresponding to the Philippi and Chillán stations, installed 1.5 km to the South-South-East (SSE) and 2.7 km east-southeast (ESE) of the active crater, respectively, showed an average value of 466 ± 54 t/d, with a maximum daily value of 802 t/d, recorded on 7 may. A decrease in SO2 levels has been observed, however, they are still above baseline levels, which is consistent with the presence of Dome 4 housed inside the active Nicanor crater.
Satellite thermal anomalies
Three thermal alerts were recorded in the area associated with the volcanic complex during the period, with a maximum Volcanic Radiative Power (VRP) of 11 MW on May 4, a value considered moderate according to data processed by the Middle Infrared Observation of Volcanic Activity. (MIROVA, http://www.mirovaweb.it/).
At the same time, according to the analytical processing of satellite images (Sentinel 2-L2A in combination of false color bands), luminance anomalies were observed on May 3, 5, 8, 10, 3 and 15.
Surveillance cameras
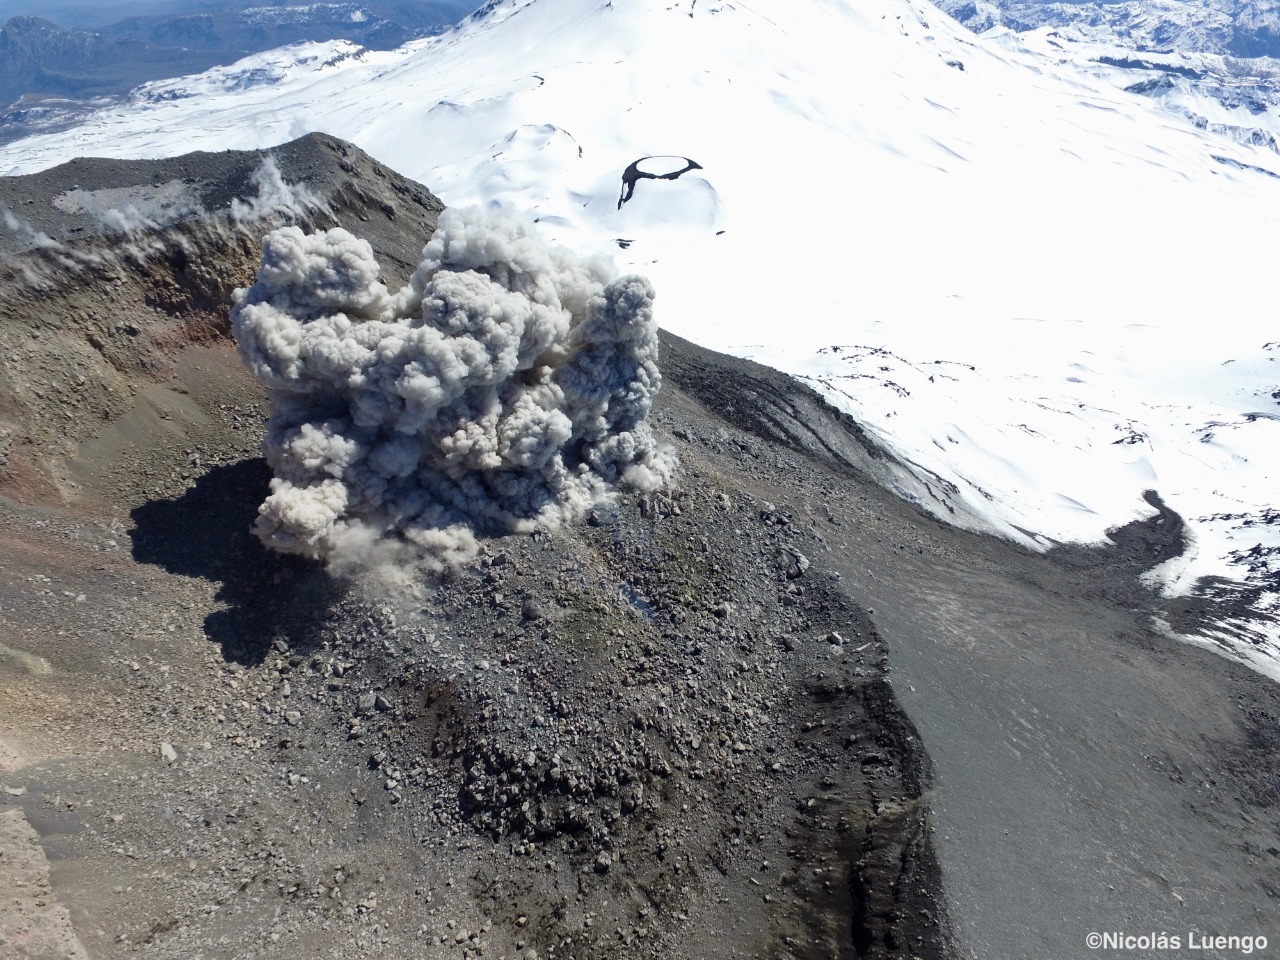
Explosive surface activity was recorded from the active crater, with the generation of eruptive columns dominated by water vapor and occasional columns with moderate pyroclastic content. However, on May 16, an energetic explosion was recorded compared to what had been observed in the previous days. The column reached 900 m in height generating pyroclastic flows in directions to the South-East, North-East and West, reaching up to 400 m from the edge of the crater.
Regarding the incandescence, it remained at moderate to low levels, subject to the crater and with a maximum height of 200 m.
From analysis with Planet Scope OrthoTile, Sentinel 2 L2A and Skysat satellite images, the permanence of a dome-like effusive body nestled in the Nicanor crater (dome 4), whose area is 1626 m2, is observed, without significant variations from the area estimated in the previous Skysat image of the 15th. Detailed in the very high resolution Skysat image, it reveals the existence of numerous fissures and emission centers located in an East-West line, in the south and south-west part of dome 4, just on the edge of it. Explosive activity and also passive outgassing were concentrated in these aforementioned sources, a feature also observed from surveillance cameras. Additionally, an area of material accumulation is identified on the northeast rim of the active crater, apparently unconsolidated, interpreted as a product of explosive activity. In contrast, Sentinel 2 L2A false-color images indicate an area of anomalous thermal radiation, coinciding with Dome 4 and measuring 2000 m2.
Source : Sernageomin.
Read the full article : https://rnvv.sernageomin.cl/rnvv/TI_Santiago_prod/reportes_LB/2022/RAV_20220520_%C3%91uble_v9.pdf
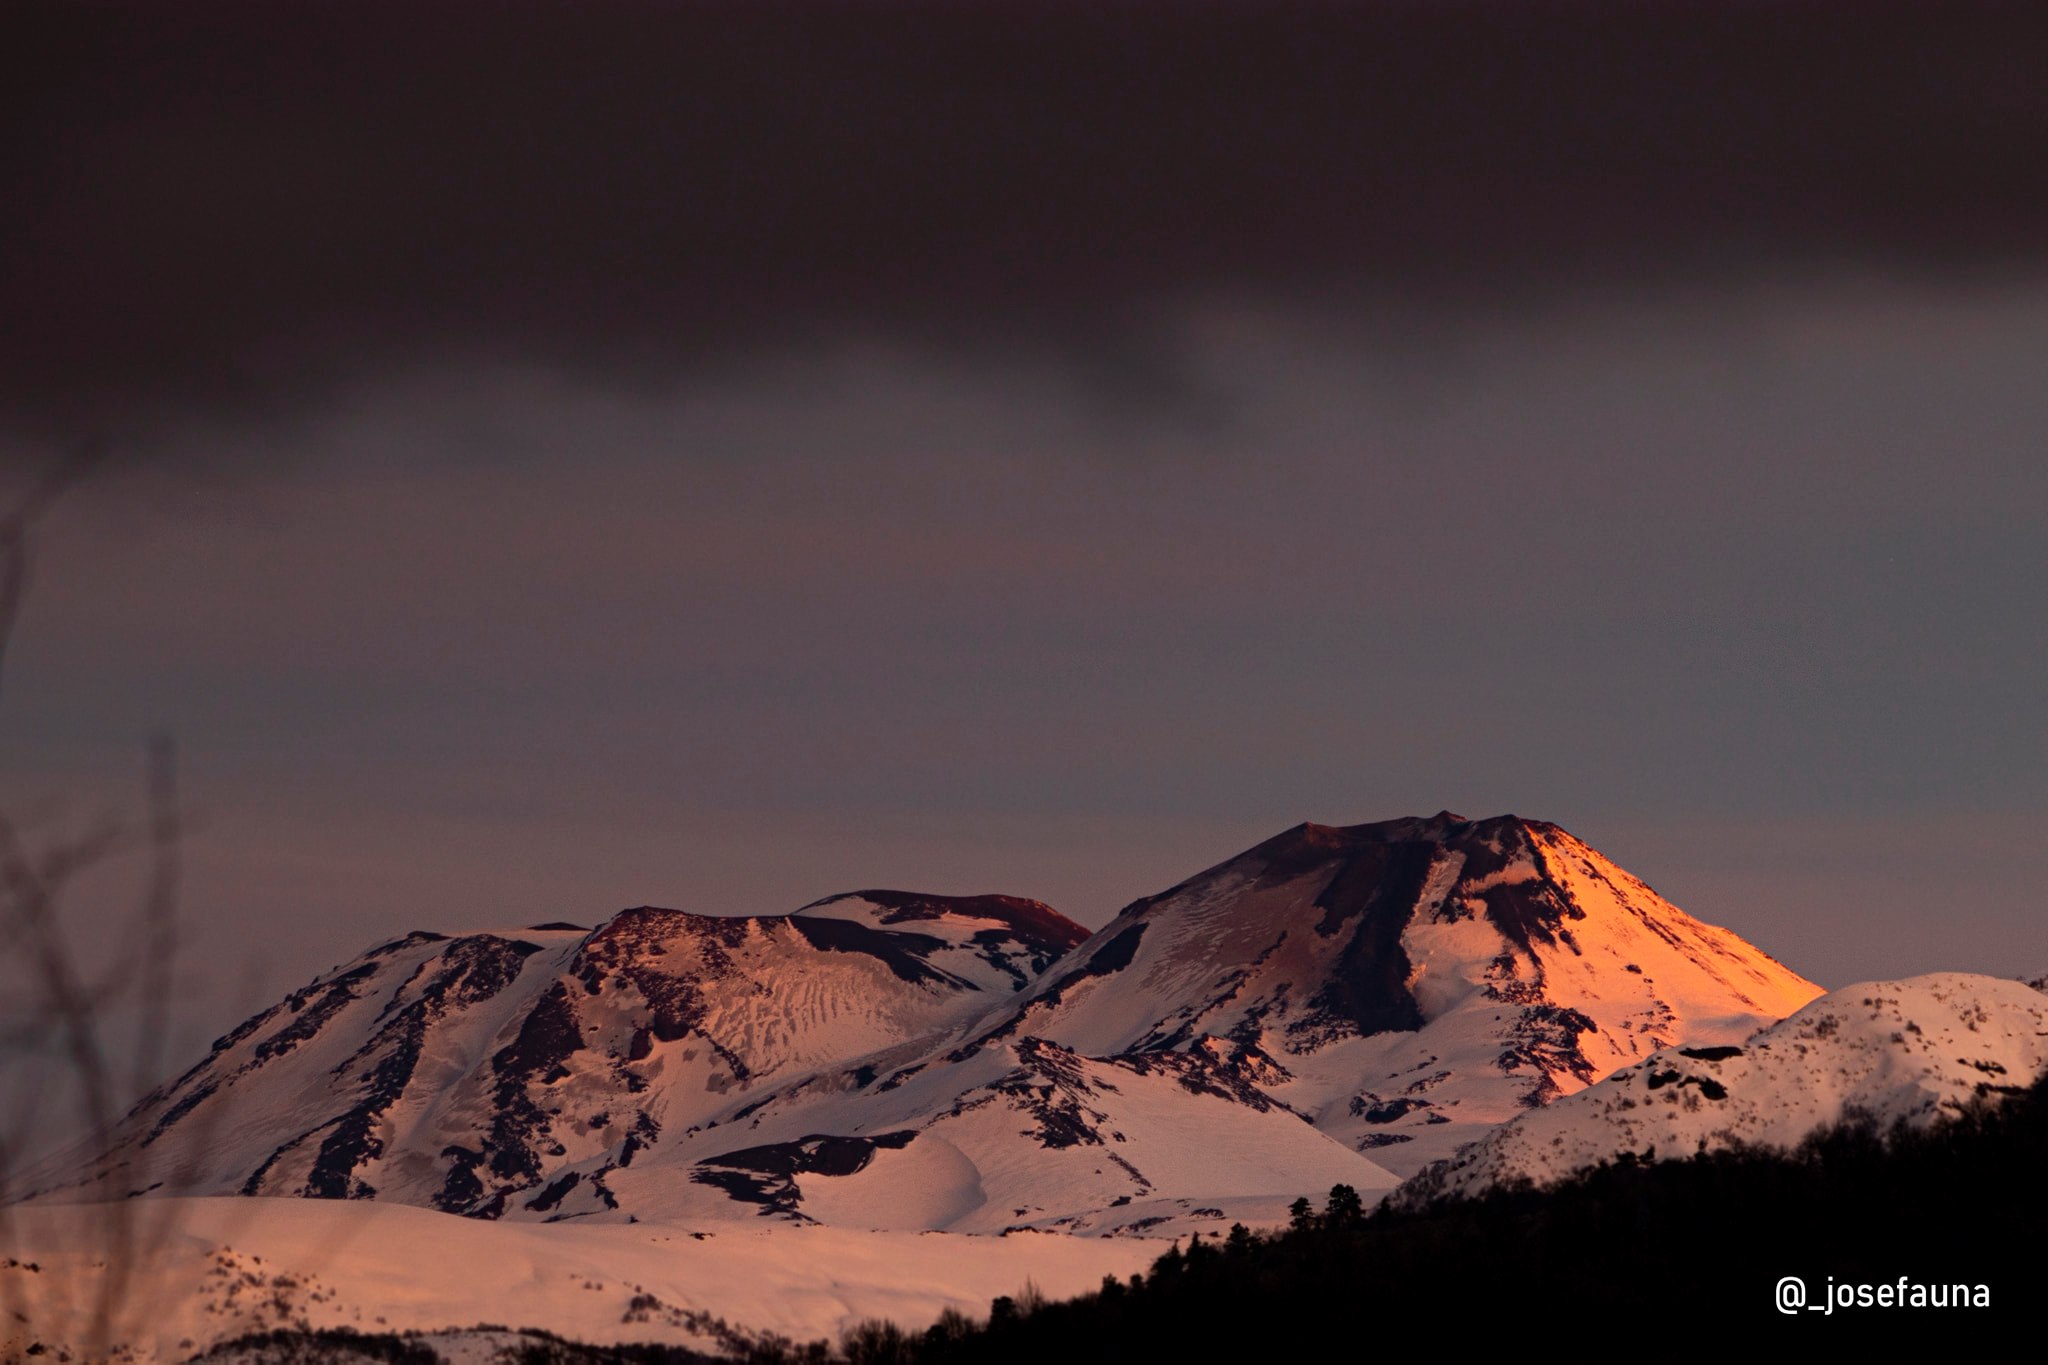
Photos : Nicolas Luengo (archive) , Josefauna .
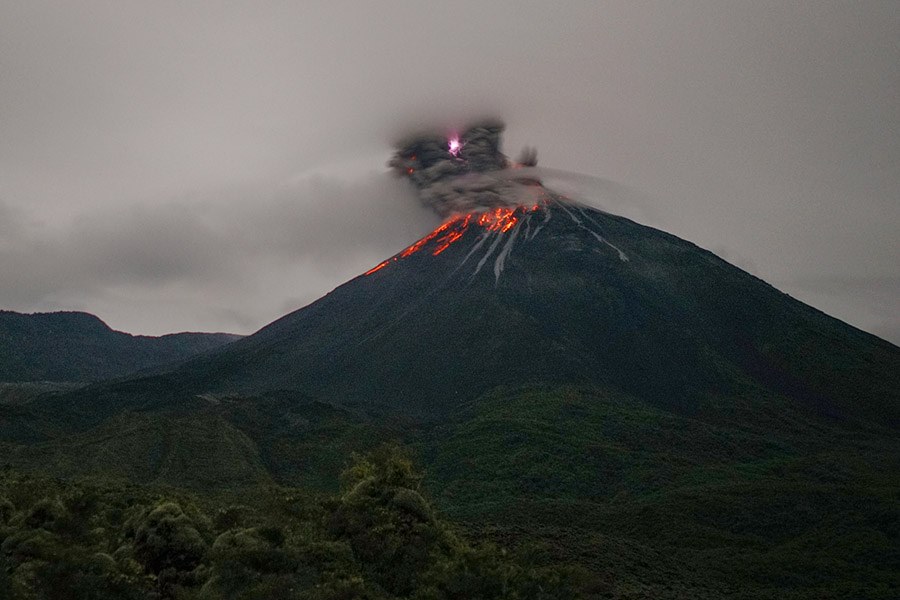
Ecuador , Reventador :
DAILY REPORT OF THE STATE OF THE REVENTADOR VOLCANO, Friday May 20, 2022.
Information Geophysical Institute – EPN.
Surface Activity Level: High, Surface Trend: No change.
Internal activity level: Moderate, Internal trend: No change.
Seismicity: From May 19, 2022, 11:00 a.m. to May 20, 2022, 11:00 a.m.:
Explosion (EXP) 25
Long Periods (LP) 35
Emission Tremors (TREMI ) 4
Harmonic Tremors (TRAM): 7
Rains / Lahars:
No rain was recorded in the area.
Emission / ash column:
The Washington VAAC issued 3 gas and ash emission alerts with heights of 988 meters above crater level in a west and northwest direction.
Other Monitoring Parameters:
The FIRMS system records 13 thermal alerts and the MIROVA system records 2 moderate thermal alerts in the last 24 hours.
Observation:
The volcano remained cloudy, which is why it was not possible to observe activity at surface level.
Alert level: Orange.
Source : IGEPN
Photos : Martin Rietze (archive) .
Alaska , Pavlof :
55°25’2″ N 161°53’37 » W,
Summit Elevation 8261 ft (2518 m)
Current Volcano Alert Level: WATCH
Current Aviation Color Code: ORANGE
Pavlof Volcano continues to erupt from the east vent near the volcano’s summit. Seismic tremor and elevated surface temperatures were observed throughout the week and are consistent with low-level eruption and effusion of short lava flows on the upper flank. No explosions or ash emissions were observed in satellite or webcam images this week.
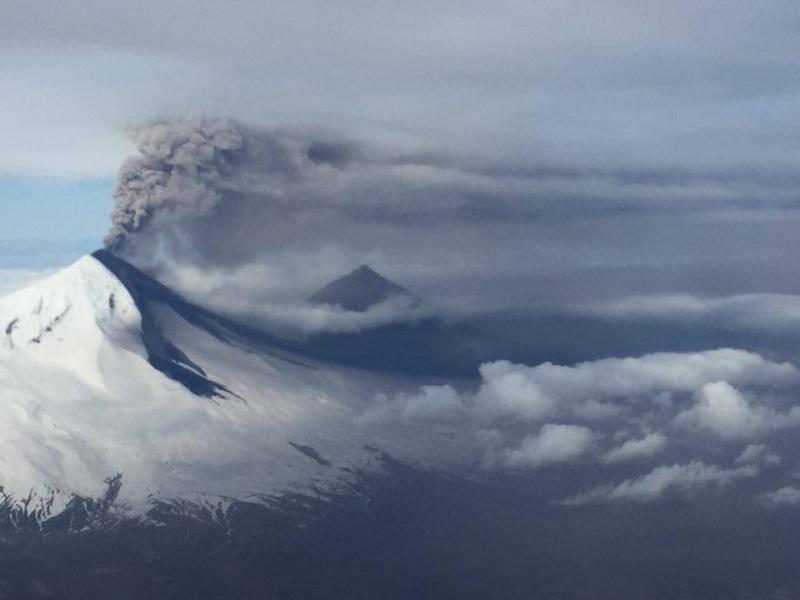
Periods of lava spatter and fountaining from the vent on the volcano’s upper east flank have been occurring since mid-November 2021. This activity has built a small cone and sent flows down the flank that melt the snow and ice and produce variable amounts of meltwater. The meltwater typically incorporates loose debris on the flank of the volcano and forms thin (less than 2 m thick) lahars. The lahar deposits extend down the east-southeast flank for several kilometers, not quite to the base of the volcano.
Previous eruptions of Pavlof indicate that the level of unrest can change quickly and the progression to more significant eruptive activity can occur with little or no warning.
Pavlof is monitored by local seismic and infrasound sensors, satellite data, web cameras, and remote infrasound and lightning networks.
Source : AVO.
Photo : Torres, Austin ( archive).
Hawaii , Kilauea :
19°25’16 » N 155°17’13 » W,
Summit Elevation 4091 ft (1247 m)
Current Volcano Alert Level: WATCH
Current Aviation Color Code: ORANGE
Activity Summary:
The summit eruption of Kīlauea Volcano, within Halemaʻumaʻu crater, continued over the past 24 hours. All recent lava activity has been confined to the crater, and current data indicate that this scenario is likely to continue. No significant changes have been noted in the summit or East Rift Zone.
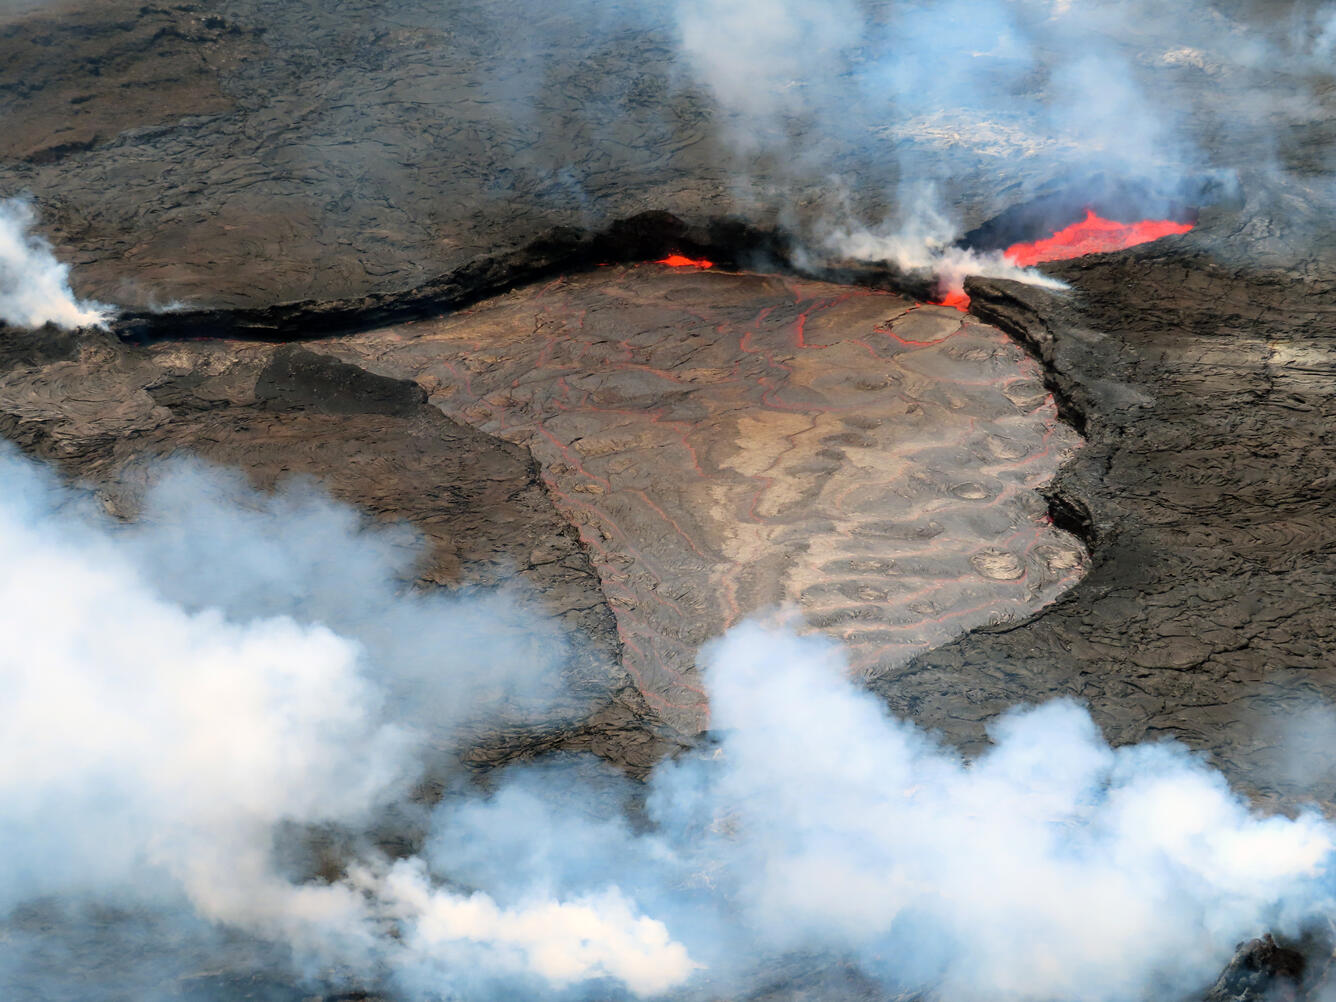
A view of the active lava lake within Halema‘uma‘u, taken during a Kīlauea summit monitoring field shift on the morning of May 18, 2022. The active lake is draining into the small pond on the right of the photograph. Spattering along the margins of the lake is common, seen here in the center of the photograph. This activity is accompanied by loud whooshing and roiling noises that are sometimes audible from the Keanakāko‘i public overlook.
Halemaʻumaʻu crater Lava Lake Observations:
Eruption of lava from the Halemaʻumaʻu western vent into the active lava lake and onto the crater floor has continued over the past 24 hours. The active lava lake has shown continuous surface activity, with lake level remaining relatively high, with some minor fluctuations in level. Lava ooze-out activity continued yesterday with almost continuous expansive ooze-outs along the western edge of the lake, which slightly diminished around 4:30 this morning. Overflight measurements on May 10, 2022 indicated that the crater floor had seen a total rise of about 106 meters (348 feet) and that 77 million cubic meters (20 billion gallons) of lava had been effused since the beginning of this eruption on September 29, 2021.
Summit Observations:
Summit tiltmeters showed nearly flat tilt since May 12, 2022. A sulfur dioxide (SO2) emission rate of approximately 2,800 tonnes per day (t/d) was measured on May 12, 2022.
Source : HVO
Photo : USGS/ L. Gallant.