May 09 , 2019.
Italy / Sicily , Etna :
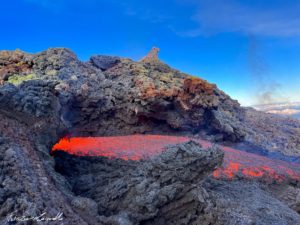
After a few months of rest, the magma reappears in the craters at the top of Etna: update of May 8, 2019.
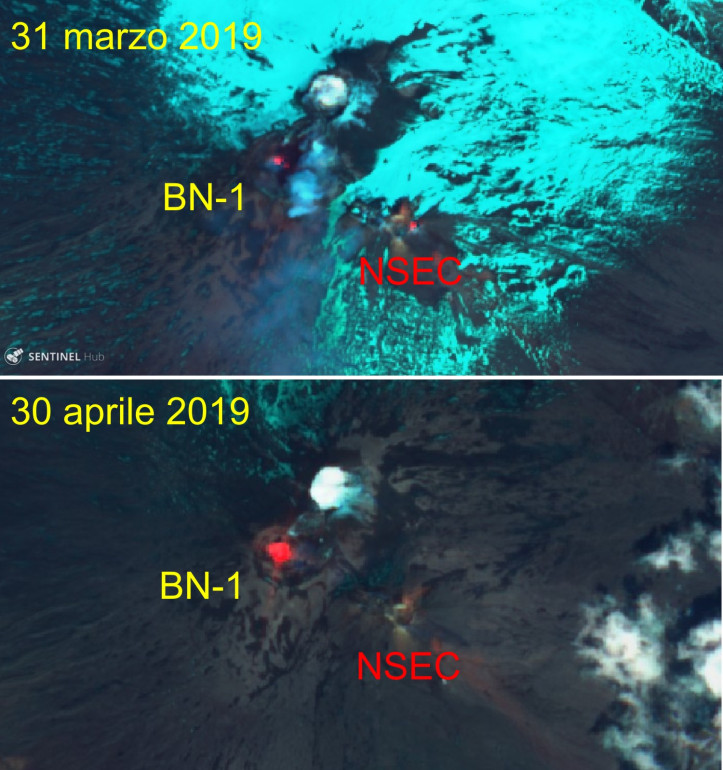
After a few months of relative calm, the typical signs of the volcano’s awakening in the craters of the summit of Etna are again observed. In mid-March 2019, noises created by strombolian explosions began to be heard deep in the Bocca Nuova ducts , the largest crater on the summit. From the end of March, the satellite thermal sensor images revealed thermal anomalies (Figure 1), corresponding to the depression of the western crater of Bocca Nuova (BN-1) and, intermittently and in all less accentuated case, at the eastern mouth of the New Southeast Crater.
Figure 1. – Images of the Sentinel-2 satellite, highlighting the thermal anomalies detected in the craters of the Etna summit on March 31 and April 30, 2019. There is a clear increase in the thermal anomaly at the BN level. -1 (western depression of the crater of Bocca Nuova), while the thermal anomaly of the eastern vent of the New Southeast Crater (NSEC) is no longer visible in the image of April 30.
During the last days of April 2019, emissions of incandescent bombs were observed, exceeding the height of the edge of the crater to fall back into the mouth itself. Finally, on the morning of May 1, newly emitted slags were found outside the edge of the crater, which had not been observed since the morning of December 27, 2018.
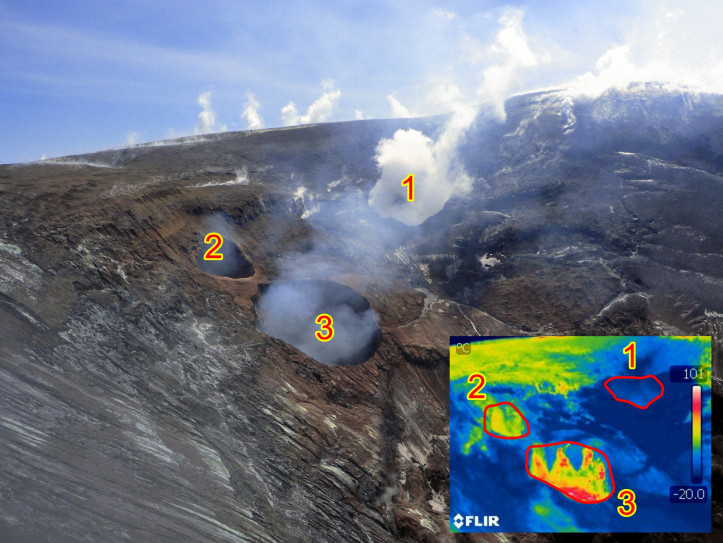
This most recent activity was not just about Bocca Nuova. In fact, the crater of Voragine first formed two small collapsing craters (January 12 and April 18, 2019, respectively) that began to emit glowing gases (Figure 2). Since April 20, these two mouths have also generated sporadic and modest explosions with ash emission, which determined their gradual widening until the two mouths are welded to each other, forming a single depression more great.
Figure 2. – Northeast part of the Voragine crater with the three collapse mouths respectively formed on August 7, 2016 (1), January 12, 2019 (2) and April 18, 2019 (3). Corresponding thermal image at bottom right, showing higher temperatures at vent 3; while that of 7 August 2016, which has been emitting gases at very high temperatures for more than a year, now emits only low-temperature vapors. The images were taken by Stefano Branca, INGV-OE, on April 19, 2019.
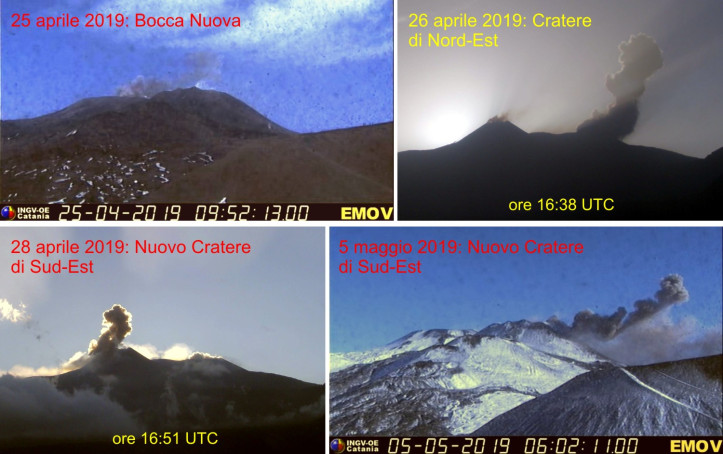
On April 26th, the Northeast Crater, which between January and February 2019 had abundantly emitted dense gaseous plumes and very rich in ash, also generated small Strombolian explosions which, shortly after (April 28th), also began. to touch the eastern vent of the New Southeast Crater. From May 2, activity intensified slightly in the New Southeast Crater, which produced small puffs of ash sometimes mixed with glowing pyroclastic materials. Some scenes from these events are shown in Figure 3.
Figure 3. – Explosive events in the summit craters of Etna between late April and early May 2019, taken by the surveillance cameras of the INGG-Osservatorio Etneo. The images of April 25 (top left) and May 5 (bottom right) were recorded by the Montagnola camera (EMOV), located 3 km south of the craters of the summit. The other two images come from the high resolution camera located in Monte Cagliato (EMCH), 8.3 km east of the summit craters.
These phenomena mark the resumption of eruptive activity on the craters at the top of Etna, after a little over two months of relative calm, marked almost exclusively by gas emissions. To a certain extent, this recalls what happened from June to July 2018, when there was a gradual reactivation of the summit craters after about a year of calm. Be that as it may, the current eruptive activity at the top is Etna’s most characteristic and frequent occurrence, which is why the current revival of the volcano is perfectly normal.
Article written by Boris Behncke and Marco Neri, using data obtained from the monitoring networks of the INGV.
Photos : Stefano Branca , INGV.
Kamchatka , Sheveluch :
VOLCANO OBSERVATORY NOTICE FOR AVIATION (VONA).
Issued: May 8 , 2019
Volcano:Sheveluch (CAVW #300270)
Current aviation colour code:ORANGE
Previous aviation colour code:orange
Source:KVERT
Notice Number:2019-91
Volcano Location:N 56 deg 38 min E 161 deg 18 min
Area:Kamchatka, Russia
Summit Elevation:10768.24 ft (3283 m), the dome elevation ~8200 ft (2500 m)
Volcanic Activity Summary:
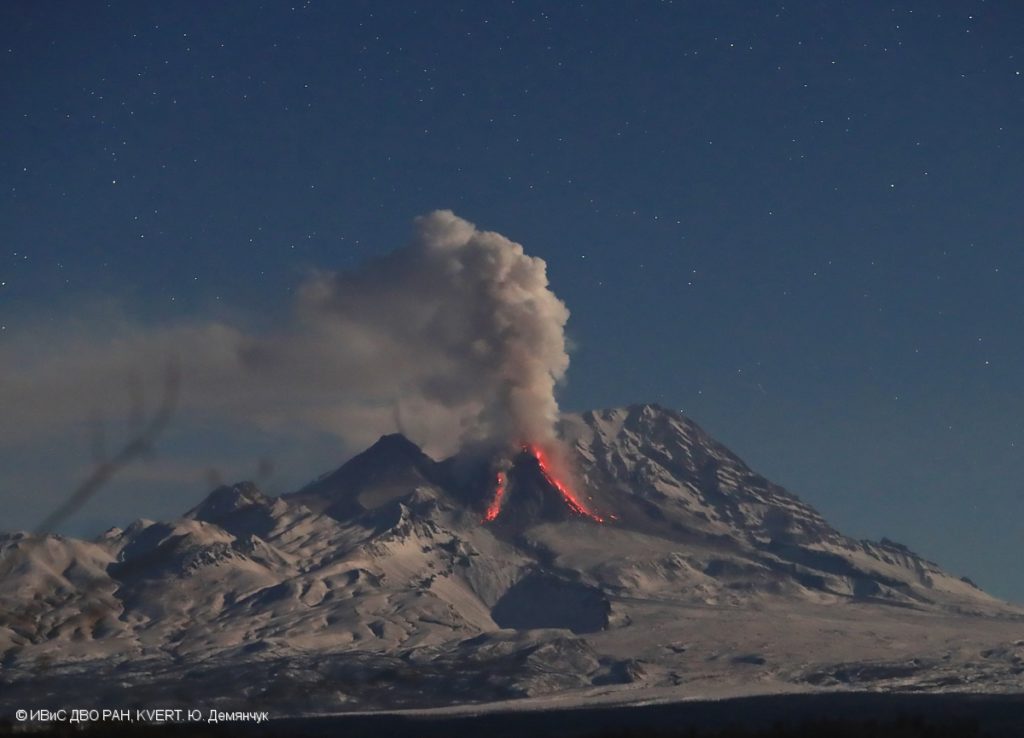
A growth of the lava dome continues (a viscous lava blocks extrude out on the northern part of it), a strong fumarolic activity and an incandescence of the dome blocks and hot avalanches accompanies this process. According to video and satellite data, a gas-steam plume containing some amount of ash on the height about 4.5 km a.s.l. continues to extend to south-southeast of the volcano.
Explosive-extrusive eruption of the volcano continues. Ash explosions up to 32,800-49,200 ft (10-15 km) a.s.l. could occur at any time. Ongoing activity could affect international and low-flying aircraft.
Volcanic cloud height:
14760 ft (4500 m) AMSL Time and method of ash plume/cloud height determination: 20190508/2305Z – Video data
Other volcanic cloud information:
Distance of ash plume/cloud of the volcano: 22 mi (35 km)
Direction of drift of ash plume/cloud of the volcano: SSE / azimuth 149 deg
Time and method of ash plume/cloud determination: 20190508/2212Z – NOAA 18 (4m5)
Source : Kvert .
Photo : Yu. Demyanchuk. IVS FEB RAS, KVERT.
Democratic Republic of Congo , Nyiragongo :
1.52°S, 29.25°E
Elevation 3470 m
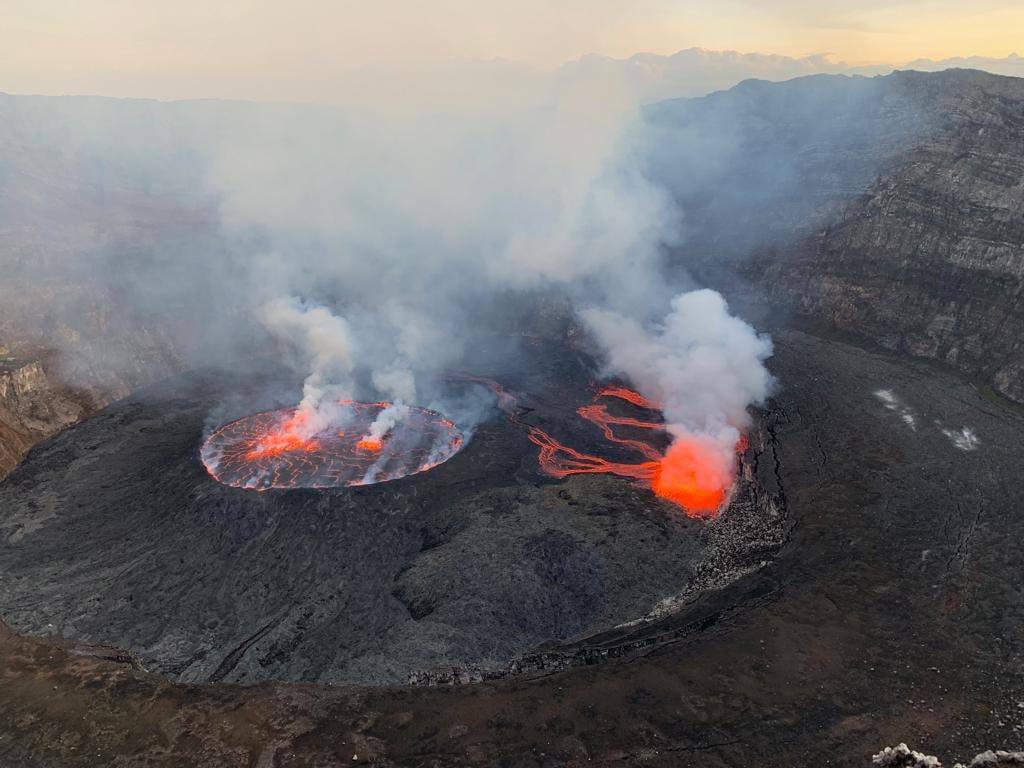
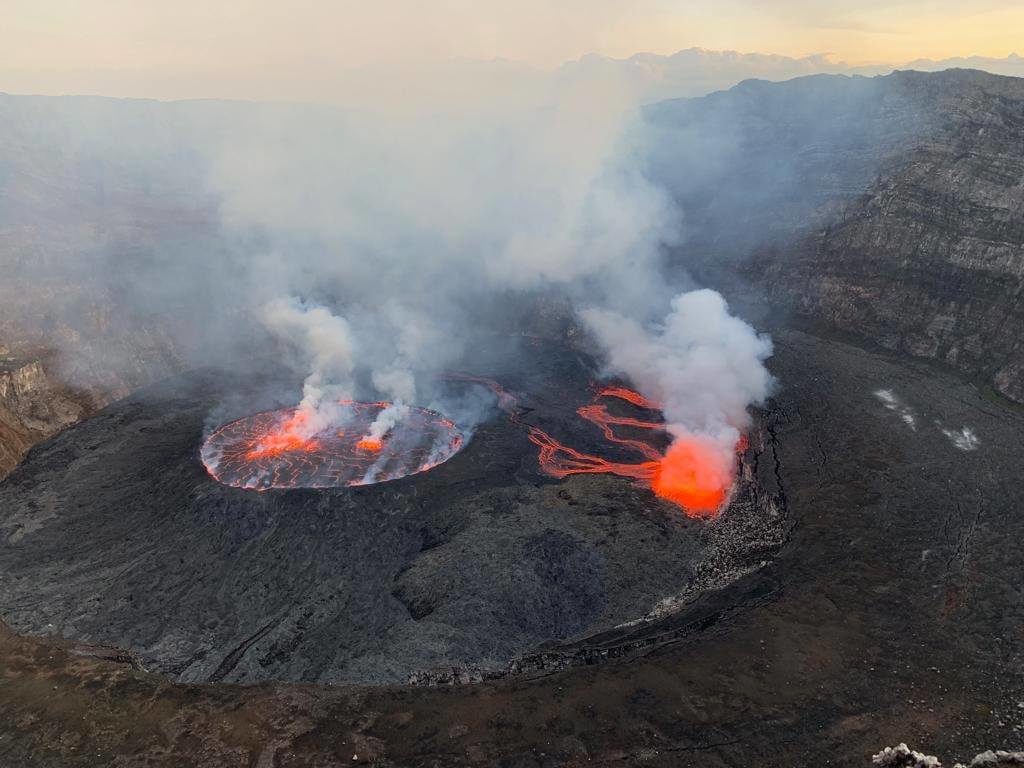
The Volcanological Observatory of Goma (OVG) reported that during 1-28 April Nyiragongo’s lava lake continued to be active, extending the episode of ongoing activity to almost 17 years. A secondary cone which had formed on 29 February 2016 was also active, as well as three other vents surrounding it. Sulfur dioxide emissions reached a high of at least 5,000 tonnes per day, greater than March highs of 2,900 tonnes per day, but still below the alert threshold.
One of Africa’s most notable volcanoes, Nyiragongo contained a lava lake in its deep summit crater that was active for half a century before draining catastrophically through its outer flanks in 1977. In contrast to the low profile of its neighboring shield volcano, Nyamuragira, 3470-m-high Nyiragongo displays the steep slopes of a stratovolcano. Benches in the steep-walled, 1.2-km-wide summit crater mark levels of former lava lakes, which have been observed since the late-19th century. Two older stratovolcanoes, Baruta and Shaheru, are partially overlapped by Nyiragongo on the north and south. About 100 parasitic cones are located primarily along radial fissures south of Shaheru, east of the summit, and along a NE-SW zone extending as far as Lake Kivu. Many cones are buried by voluminous lava flows that extend long distances down the flanks, which is characterized by the eruption of foiditic rocks. The extremely fluid 1977 lava flows caused many fatalities, as did lava flows that inundated portions of the major city of Goma in January 2002.
Source: Volcanological Observatory of Goma (OVG) , GVP.
Photo : 17 Avril 2019 , Nyiragongo expédition via Sherine France .
Japan , Asosan :
32.884°N, 131.104°E
Elevation 1592 m
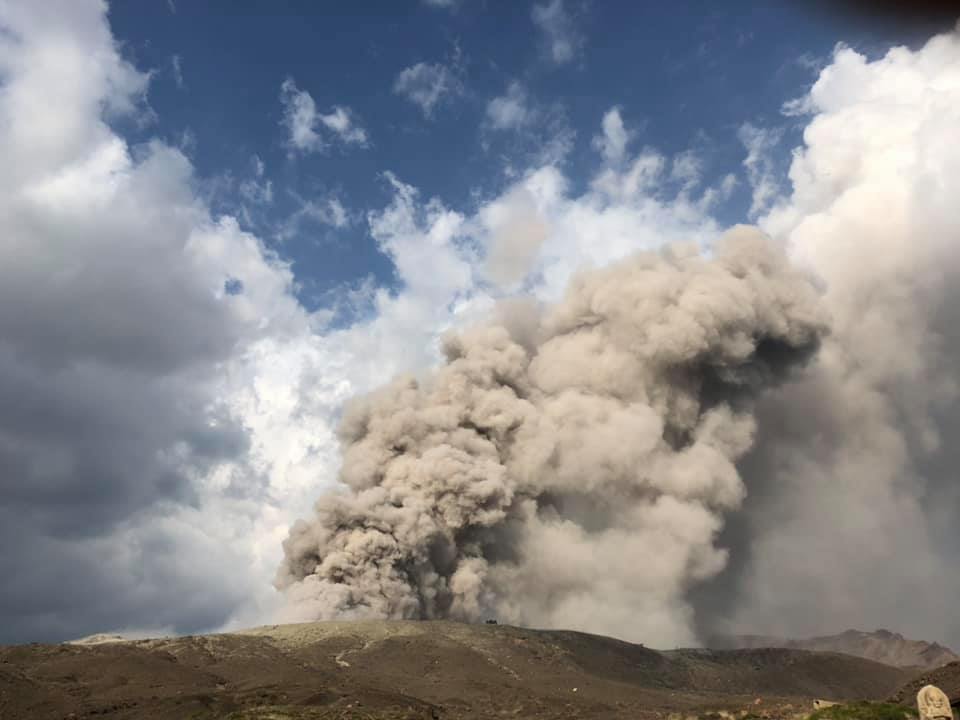
JMA reported that sulfur dioxide emissions at Asosan’s Nakadake Crater continued to be very high at 3,200 tons per day on 2 May. At night during 2-3 May webcams recorded weak incandescence from the crater. At 1540 on 3 May a very small eruption produced an off-white plume that rose 600 m above the crater rim. Later that day, at 1948, an ash plume rose 2 km and, according to the Tokyo VAAC, drifted S. Emissions from eruptive events continued until 0620 on 5 May, rising to 500 m. Afterwards white plumes rose as high as 1.1 km, at least through 7 May. Crater incandescence continued to be visible.
During a field survey on 4 May ashfall was confirmed in areas downwind including parts of Takamori (7 km SSE), Minamiaso village (8 km SW), and Yamato (24 km SSW). Sulfur dioxide emissions were 4,000 tons per day on 4 May, and 3,100 tons per day on 6 May. The Alert Level remained at 2 (on a scale of 1-5).
Sources: Japan Meteorological Agency (JMA), Tokyo Volcanic Ash Advisory Center (VAAC), GVP.
Photo : Chihiro Fujii , 03 Mai 2019 , via Sherine France.

