October 27 , 2021.
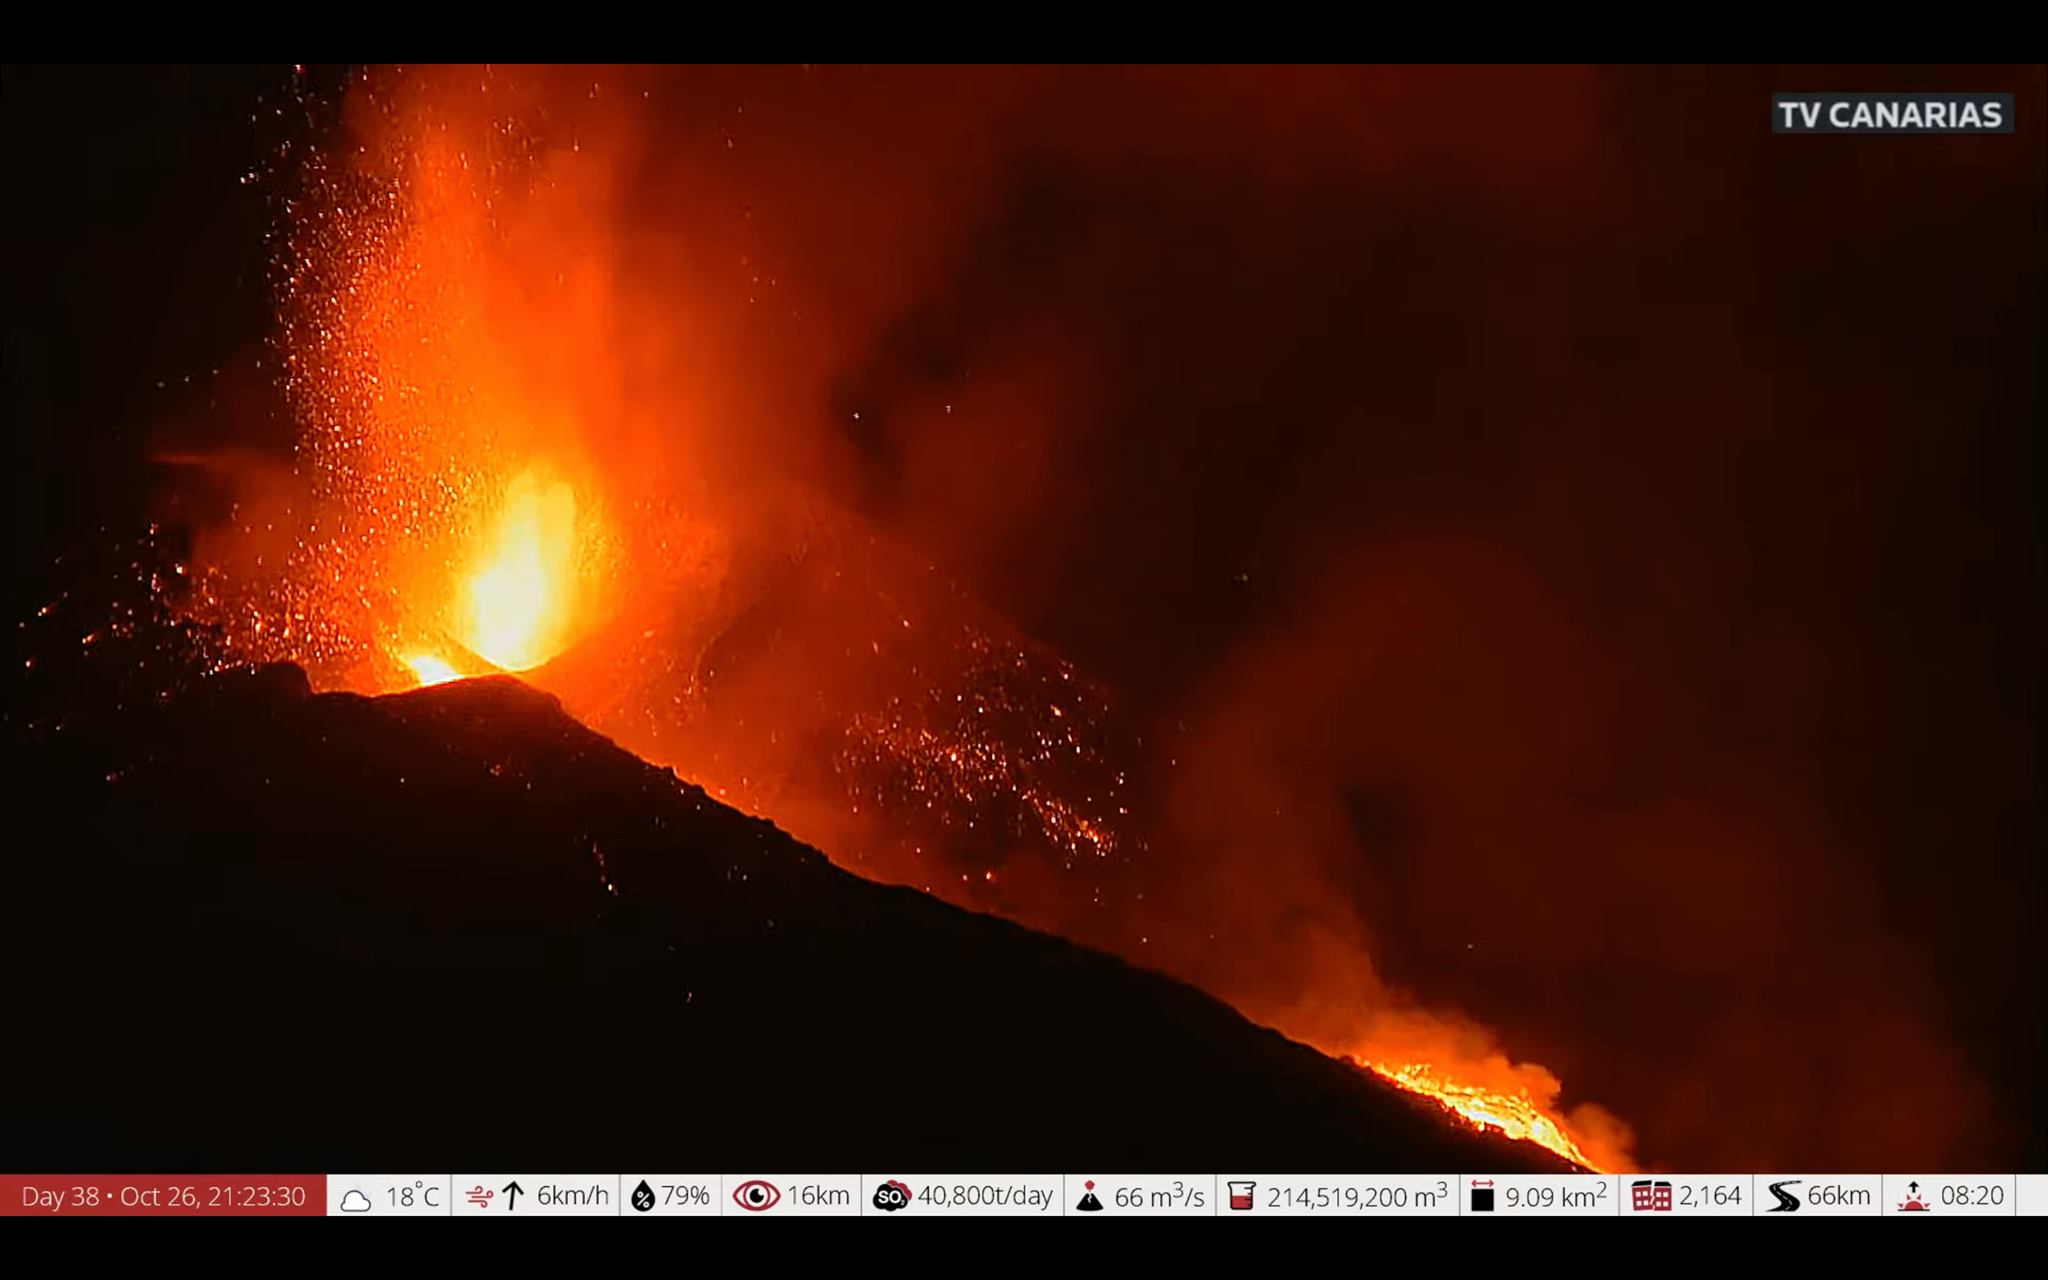
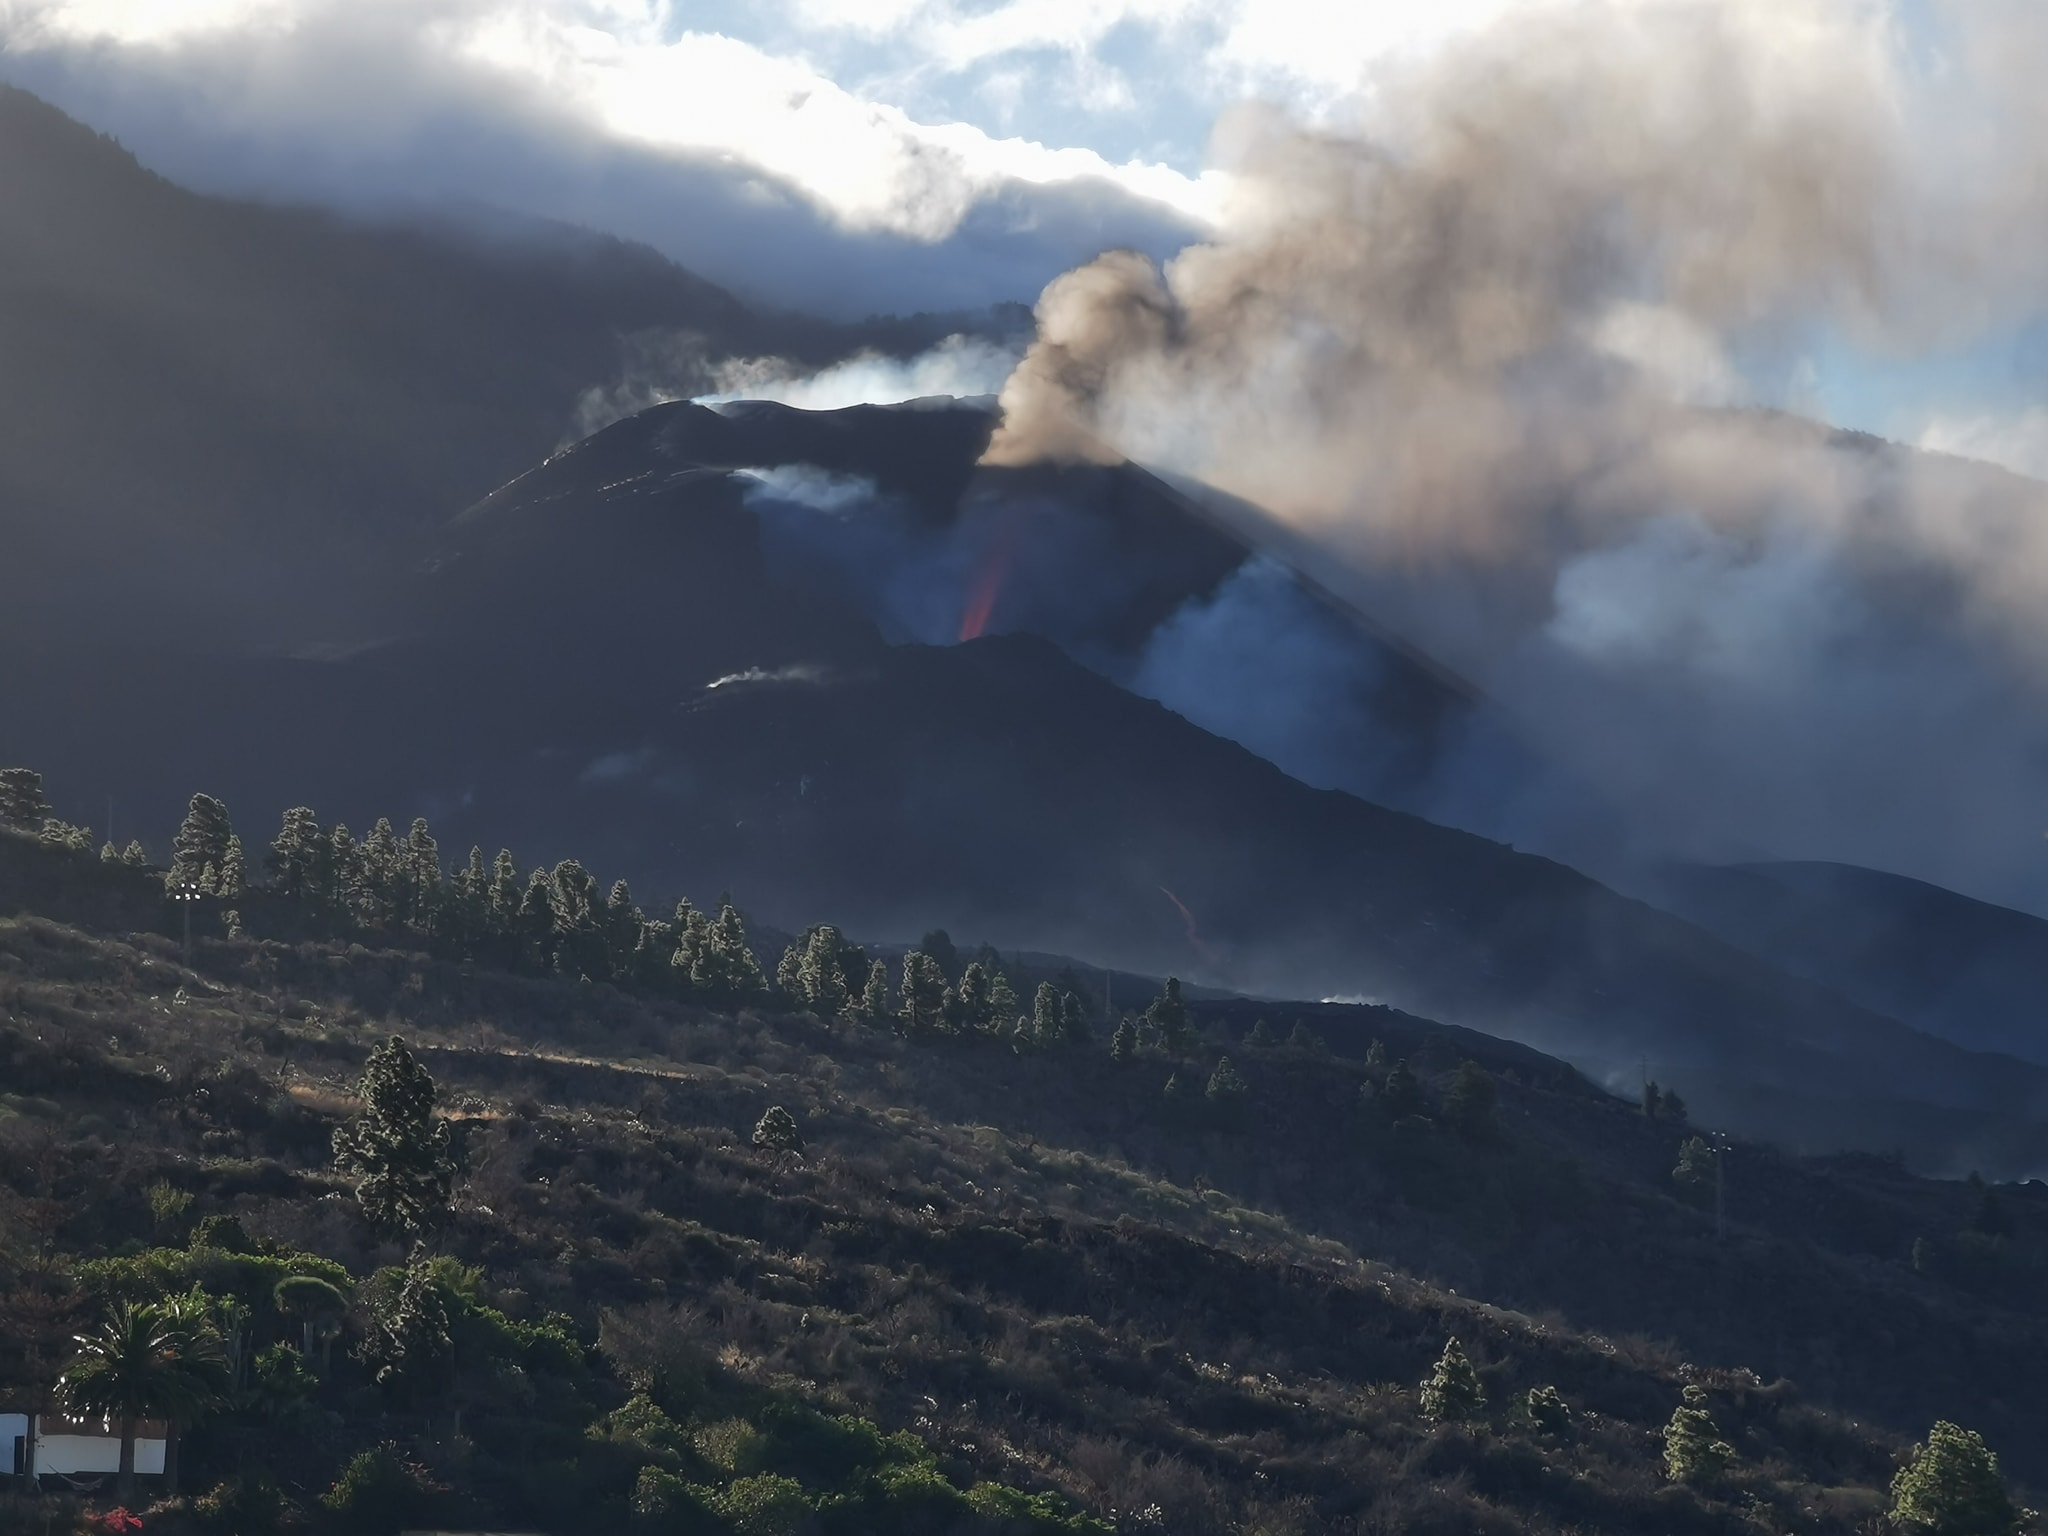
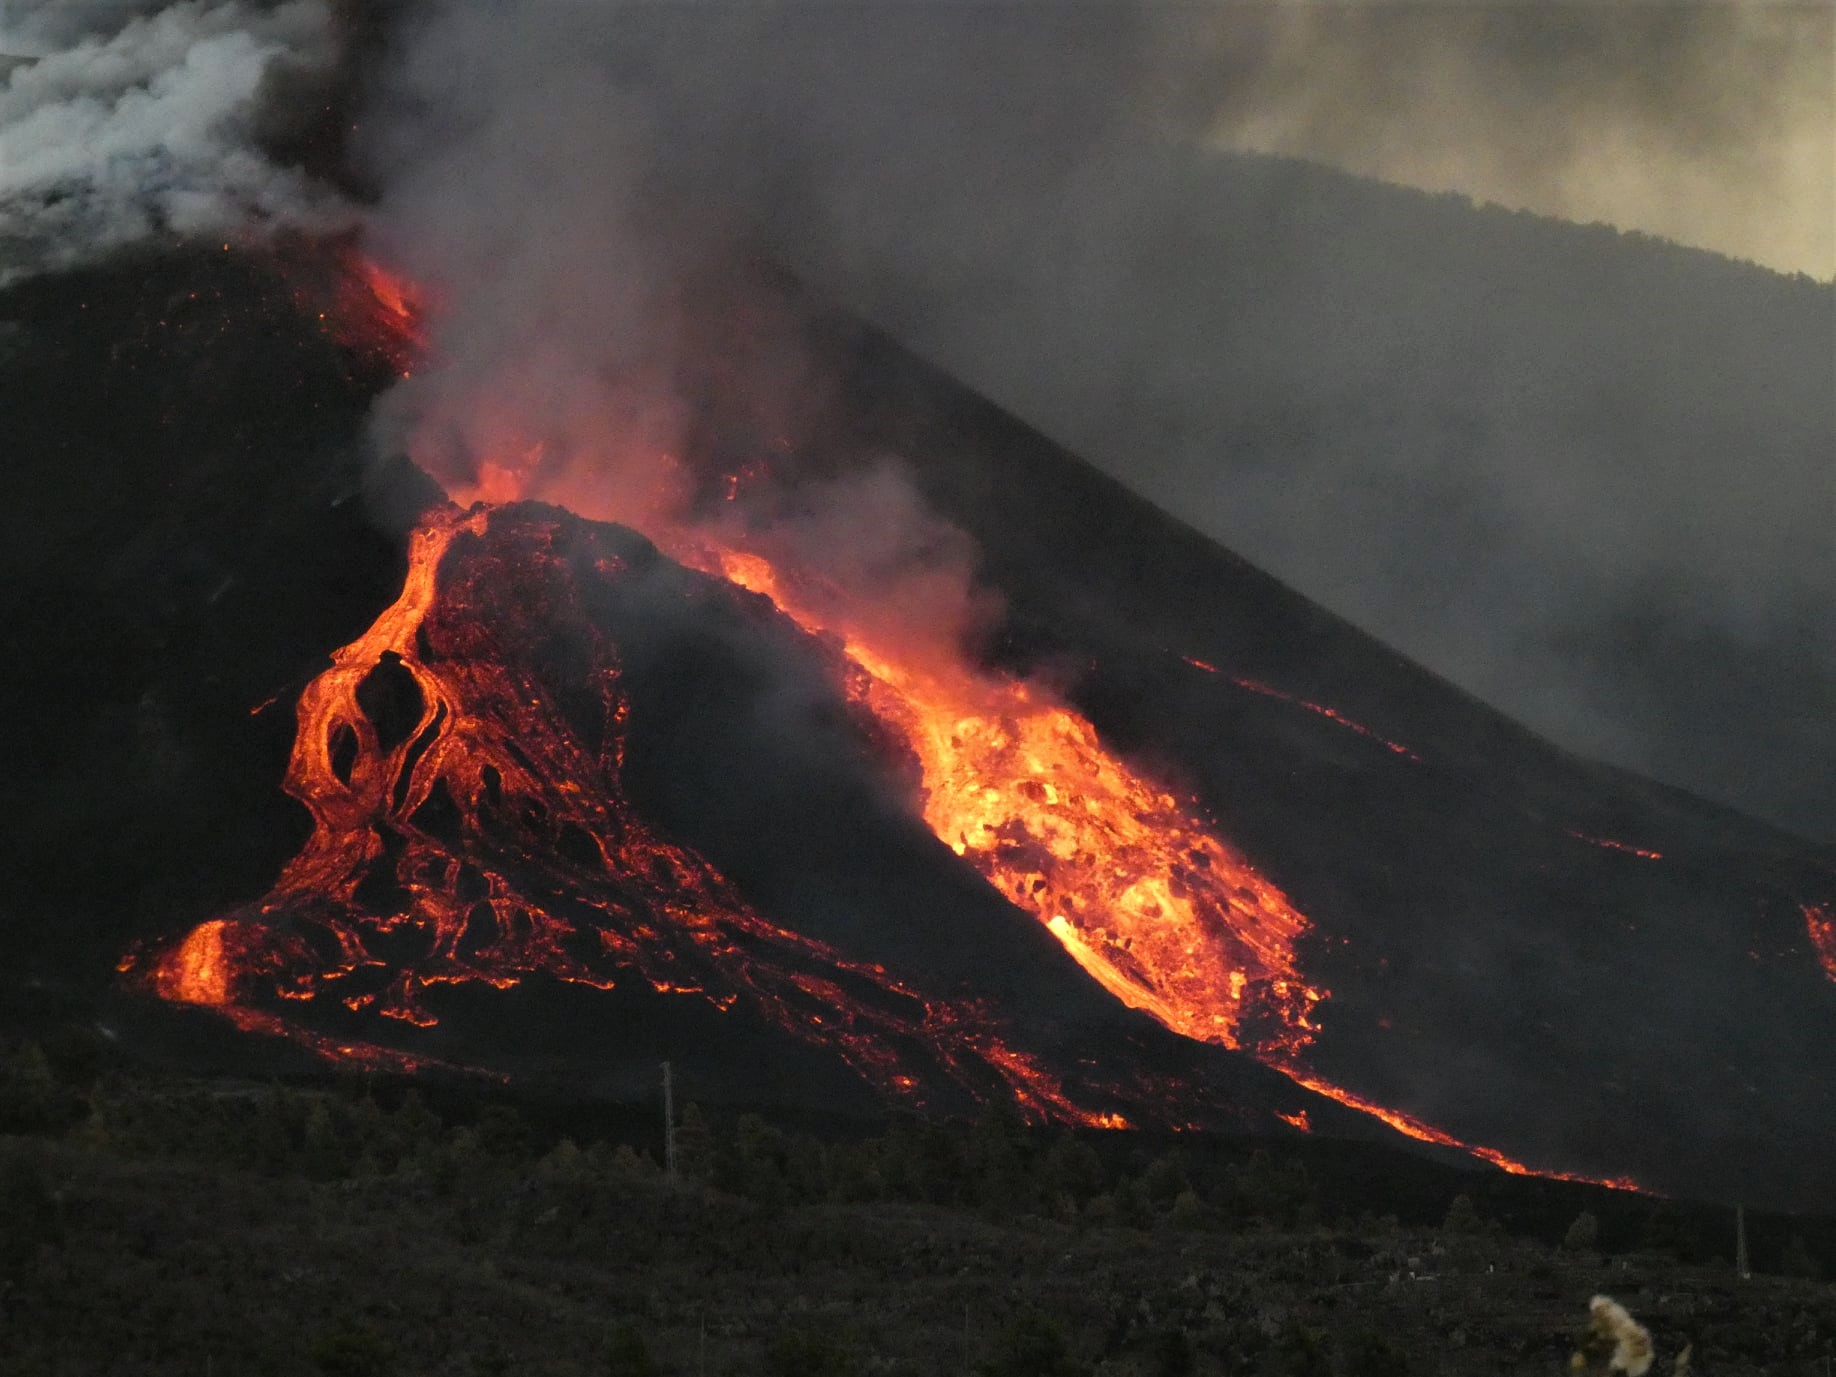
Spain / La Palma , Cumbre Vieja :
October 26, 2021, 08:00 UTC. Eruptive activity continues on La Palma.
Since the last declaration, 184 earthquakes have been located in the area affected by the volcanic reactivation of Cumbre Vieja, 17 of these earthquakes were felt by the population, the maximum intensity being in the epicentral zone IV (EMS98) for 4 earthquakes. Of all localized earthquakes, 80 have a magnitude equal to or greater than 3.0 mbLg.
The earthquake that occurred at 6:05 am (UTC) today was the largest (4.2 mbLg) during the reporting period.
Five earthquakes were located at depths of about 30 km, the rest of the hypocenters of the period are located at a shallower depth, about 12 km.
The amplitude of the volcanic tremor signal was maintained at high average levels, with intensifying pulses.
The emission cloud at 08:00 UTC reaches 2000 m.
The island’s network of permanent GNSS stations shows an elevation of more than 10 cm from yesterday and a southerly deformation at station LP03, which is closest to the eruptive centers.
On the other hand, at the most distant stations, a slight deflation is maintained, possibly linked to deep seismicity.
With the high daily emission rate of sulfur dioxide (SO2) and the strong tremors observed on the volcano of La Palma, what is clear says the volcanologist of the Sociological Center for Scientific Research (CSIC) Vicente Soler, it is that the eruption that began on September 19 « will not end tomorrow ». The volcano is still very active, said Vicente Soler, who commented that the collapse of part of the volcano’s crater that occurred on Sunday afternoon was « spectacular ».
He also referred to the seismicity at depth, which over the past night has been lower than in previous days, and noted that there were « ups and downs » in this regard. He pointed out that the high daily sulfur dioxide emission rate of over 5,000 tons is something that needs to be taken into account, because being so high means there is a large amount of magma growing in the shallow end of the volcano. Vicente Soler explained that sulfur dioxide comes from the shallower degassing of magma.
As for the tremor, which had a « high » on Sunday, he said it continues to rise from the previous 15 days. The tremor is « simply » the vibration produced by the magma which climbs the 2 or 3 kilometers in which it was stored before the eruption until it is evacuated, that is to say it This is the sound of the supply duct of the rash. Vicente Soler acknowledged that the ideal would be for there to be little seismicity and reiterated that with such a high rate of daily sulfur dioxide emission and with increasing tremors, the eruption will not end tomorrow. although there is little seismic movement.
The volcanologist from CSIC pointed out that the magma has in the volcano of La Palma the « open field » and is concerned that there will be strong earthquakes with the eruption in progress, because it means that something is wrong. not fully in phase with the eruption.
Images from the Canary Islands Volcanological Institute show another collapse in the cone of the Cumbre Vieja volcano, recorded around 6:50 p.m. Tuesday. The collapse occurred in the inner part of the cone, which collapsed on itself, momentarily blocking the lava outlet. The collapse follows the series of collapses that were recorded on Monday that led to the release of a large amount of lava, dragging large boulders with them. An hour after the collapse, the height of the lava fountain reached 600 meters, according to the Canary Islands Volcanological Institute. The technical director of Pevolca, Miguel Ángel Morcuende, communicated that on Tuesday afternoon there was an earthquake of magnitude 4.8 with epicenter in La Palma which was felt in other islands of the archipelago such than Tenerife and La Gomera. The earthquake occurred 34 kilometers below the surface and is part of the eruptive process that the island is experiencing.
Source : IGN es. El Pais .
Photos : TV Canarias , Micha Fürer.
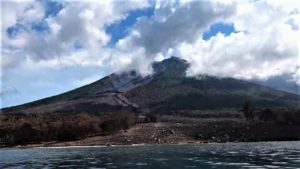
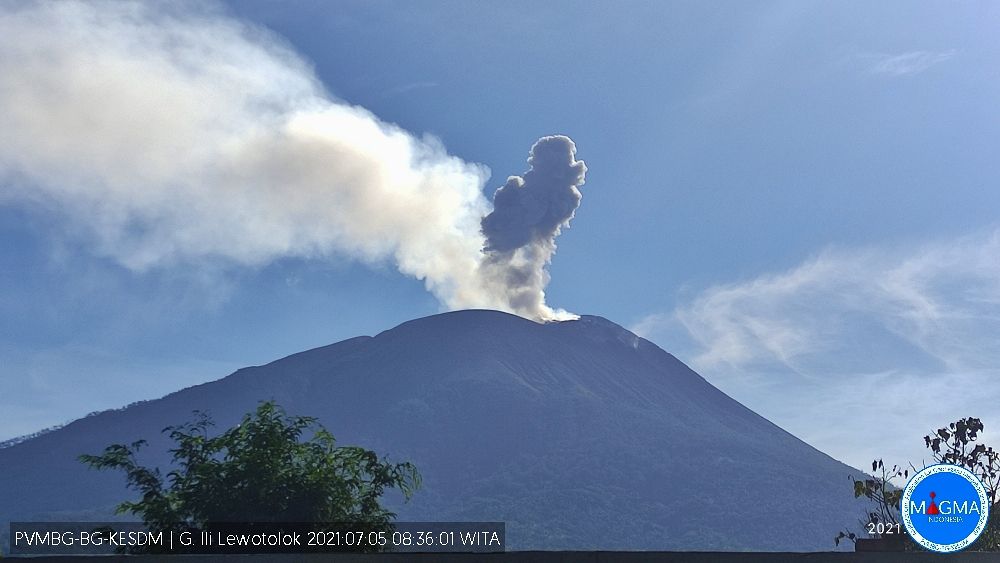
Indonesia , Ili Lewotolok :
VOLCANO OBSERVATORY NOTICE FOR AVIATION – VONA
Issued : October 27 , 2021
Volcano : Ili Lewotolok (264230)
Current Aviation Colour Code : ORANGE
Previous Aviation Colour Code : orange
Source : Ili Lewotolok Volcano Observatory
Notice Number : 2021LEW53
Volcano Location : S 08 deg 16 min 19 sec E 123 deg 30 min 18 sec
Area : East Nusa Tenggara, Indonesia
Summit Elevation : 4554 FT (1423 M)
Volcanic Activity Summary :
Eruption with volcanic ash cloud at 03h25 UTC (11h25 local). Eruption and ash emission is not continuing.
Volcanic Cloud Height :
Best estimate of ash-cloud top is around 7754 FT (2423 M) above sea level, may be higher than what can be observed clearly. Source of height data: ground observer.
Other Volcanic Cloud Information :
Ash-cloud moving to West
Remarks :
Seismic activity is characterized by continuous volcanic tectonic earthquake
Level of activity at level III (SIAGA) since November 29, 2020 at 1:00 p.m. WITA.
The volcano was clearly visible until it was covered in fog. The smoke from the crater is white, gray / black with moderate to strong intensity, about 50-700 meters high from the summit. The eruption was accompanied by a low to moderate rumble and a low explosion sound. The weather is sunny to rainy, the wind is weak in the South-East and West. The air temperature is around 25-34.3 ° C.
According to the seismographs of October 26, 2021, it was recorded:
4 eruption / explosion earthquakes
32 earthquakes of emissions
9 harmonic tremors
104 non-harmonic tremors
1 hybrid earthquake
1 shallow volcanic earthquake
3 deep volcanic earthquakes
1 distant tectonic earthquake
4 Continuous tremors, amplitude 0.5-37 mm (predominantly 10 mm)
Sources : Magma Indonésie , PVMBG.
Photos : @InfoBencan/twitter/volcanodiscovery , PVMBG ( archive).
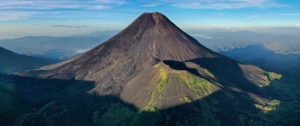
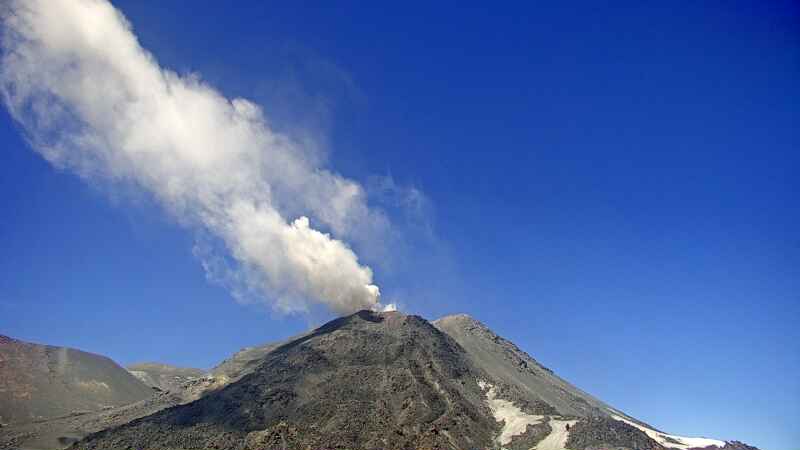
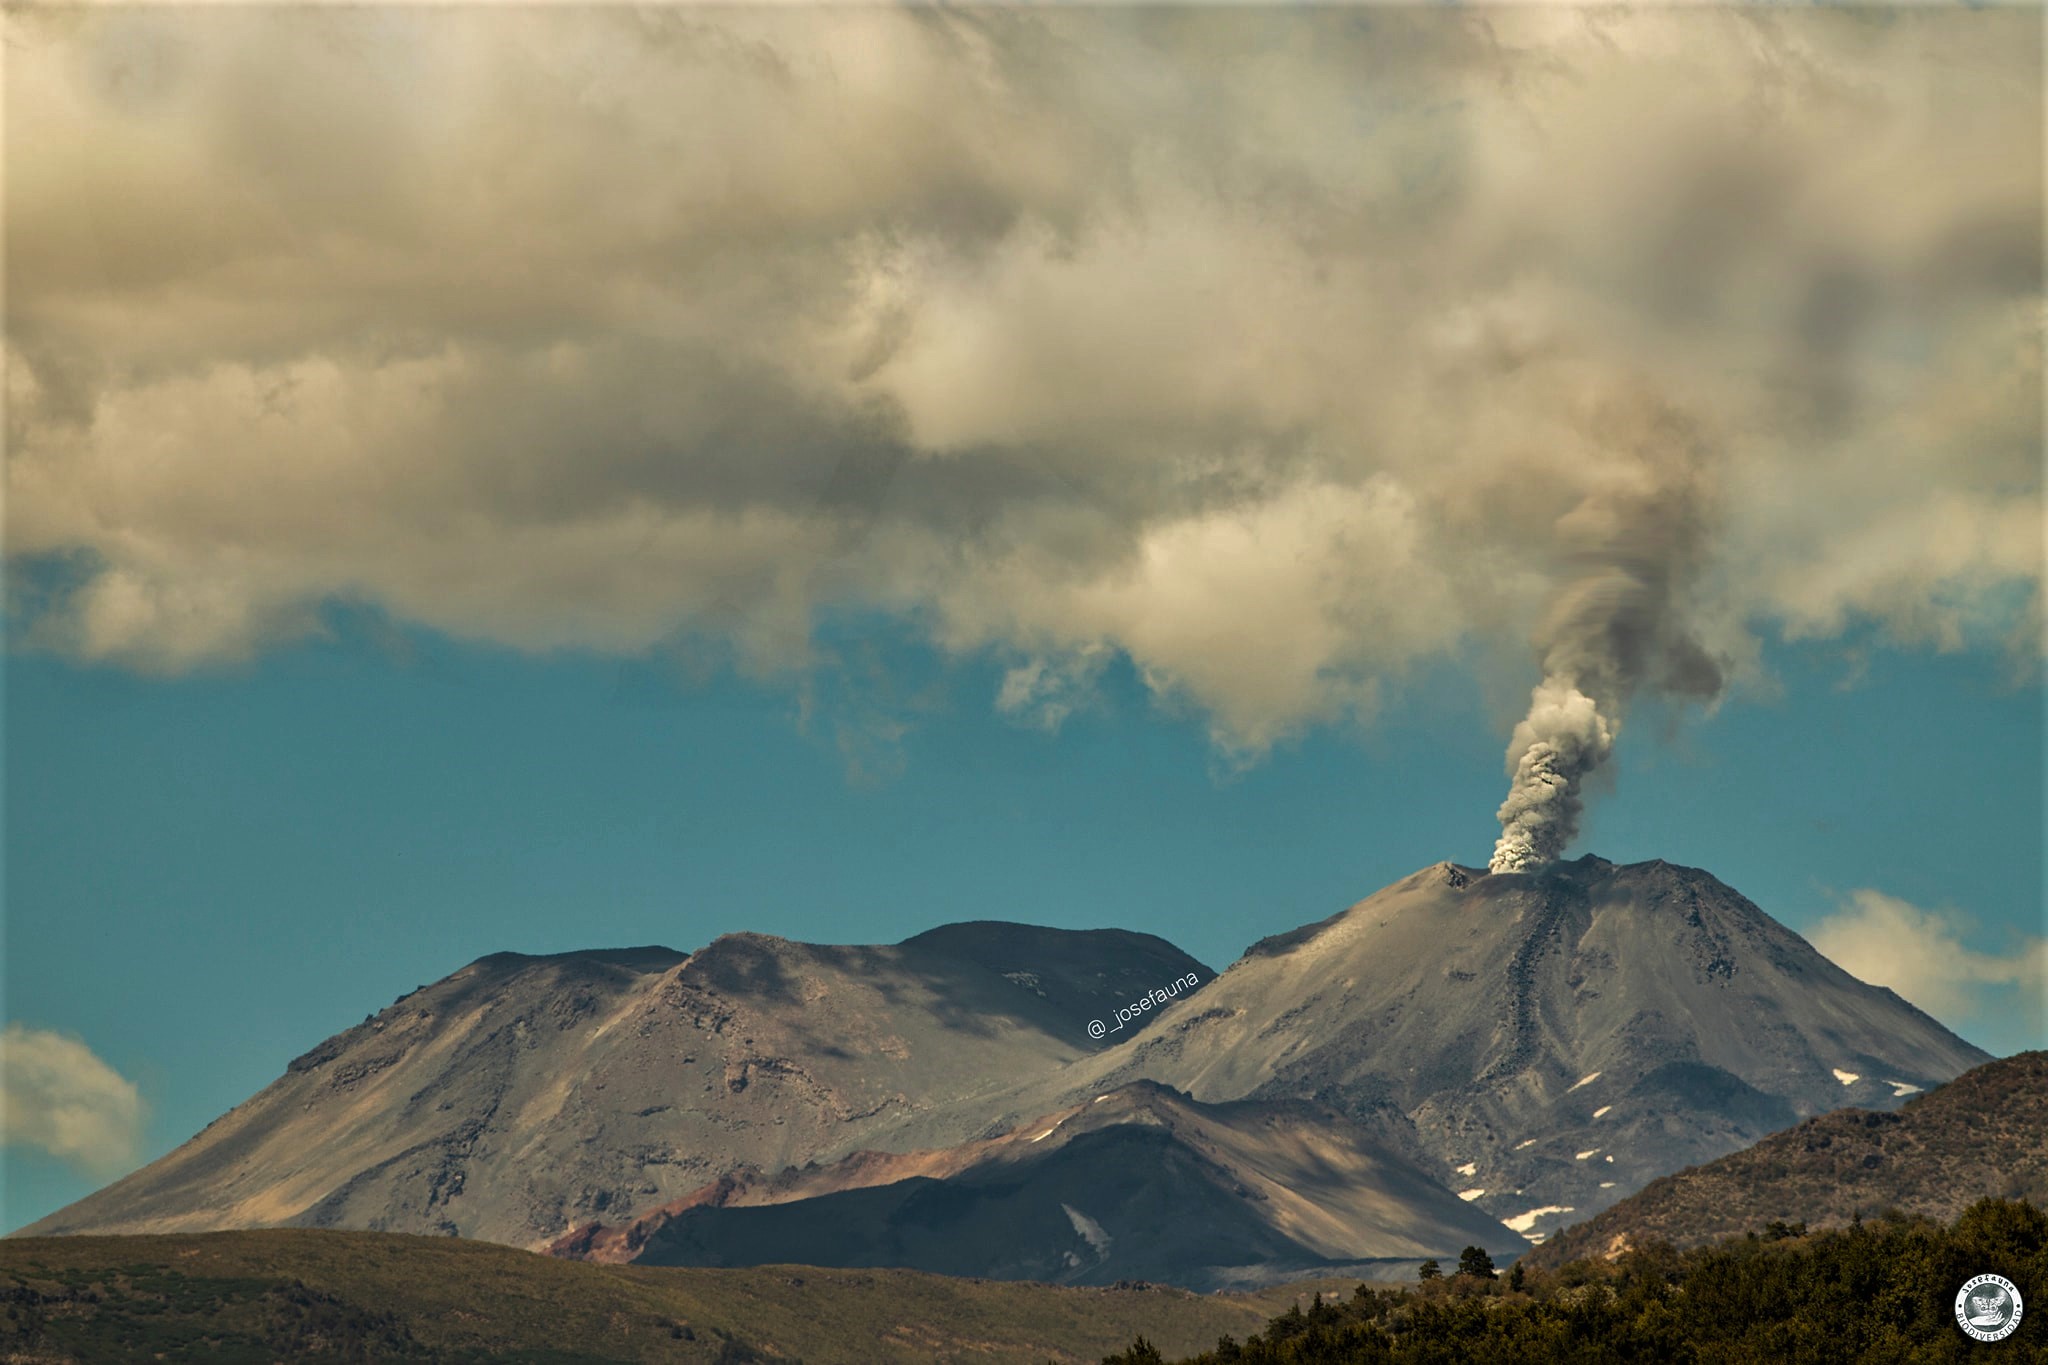
Chile / Argentine , Nevados de Chillan :
The seismicity parameters associated with the fracturing processes of rigid materials (type VT) recorded a slight decrease, while the events associated with fluid dynamics (types LP and EX) recorded a slight increase compared to the previous fortnight in in terms of number of events and energy released. It should be noted that during this fortnight very long period signals (VLP type) and tremor pulses (TR) were recorded.
The highest energy VT event, with a local magnitude (ML) of 2.3, was located 1.0 km northeast (NNE) of the active crater and at a depth of 3.8 km.
From the analysis of the images provided by the surveillance cameras belonging to OVDAS as well as the satellite images, it was observed that the first lava flow « L7 » presents a channel located in the depression between the flows « L5 » and « L6 » with an adjacent lobe named « L7b ». The L7 flow was advancing at a speed of 1.5 m / h, with a length of 930 m. The second flow, called « L8 », flows next to the west of « L5 » reaching a speed of 0.2 m / h and a range of 280 m. In contrast, the L5 flow has not increased since September.
The explosive activity showed an evolution in the columns emitted from a whitish degassing towards a greyish color due to the higher content of pyroclasts, in turn presenting heights which for the most part did not exceed 400 m in height. However, an increase was observed compared to September with columns exceeding 1000 m, the maximum recorded event being that which occurred on October 9 with a height of 1620 m. Incandescence was observed throughout the reported period with a slight increase in intensity compared to the previous fortnight. Pyroclastic flows have not been recorded.
According to data obtained by the network of GNSS stations installed on the volcano, the low-magnitude inflationary process was maintained with maximum vertical deformation rates of 0.5 cm / month, accumulating a maximum of 1.4 cm / month . In turn, the surveillance lines and horizontal components remained stable. The inclinometer stations have remained stable and only with occasional changes caused by changes in environmental temperature.
34 thermal alerts were recorded in the area with a maximum value of 48 MW on October 7 and 9, considered moderate for this volcano. In turn, radiance anomalies were detected on October 2, 5, 7, 10, 12 and 15 from Sentinel 2-L2A image analysis.
The processing of thermal images made it possible to observe an increase in temperatures in the crater area, associated with both the explosions and the development of the L7 and L8 lava flows. During the explosive activity phase, it was possible to record temperatures exceeding the measurement range of the OVDAS chamber (above 360 ° C) on October 3, 7, 8, 9 and 10.
Source : Segemar
Photos : Segemar , Josefauna .
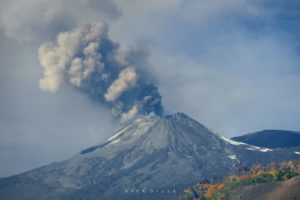
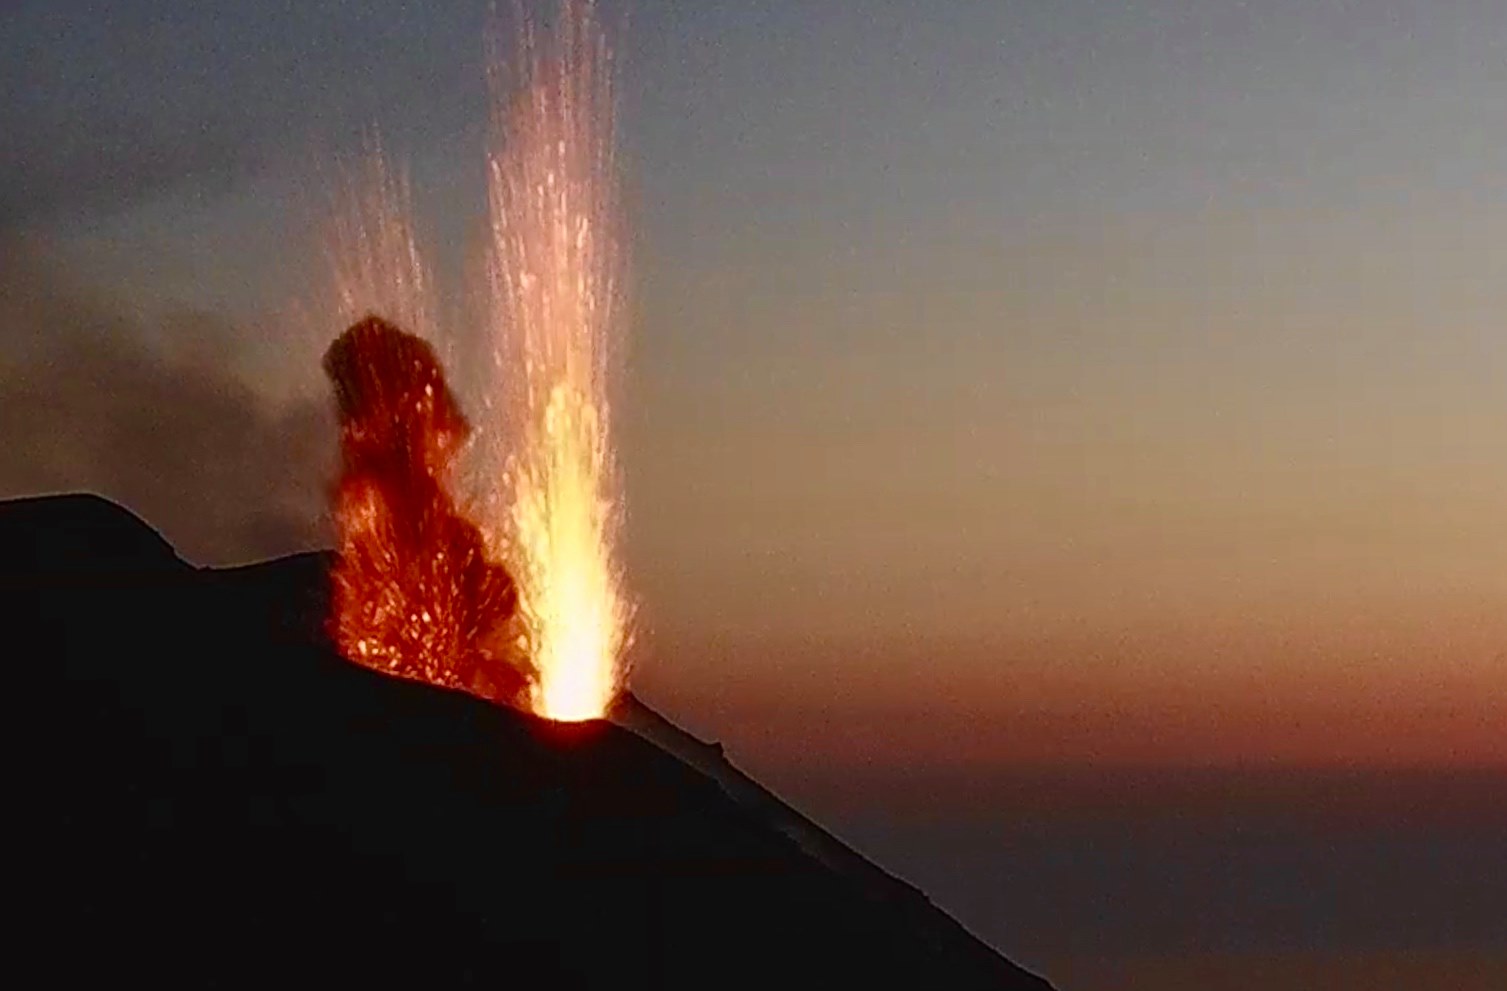
Italy , Stromboli :
Weekly Bulletin, from October 18, 2021 to October 24, 2021 (issue date October 26, 2021)
SUMMARY STATEMENT OF ACTIVITY
In view of the monitoring data, it is highlighted:
1) VOLCANOLOGICAL OBSERVATIONS: During this period a normal explosive activity of strombolian type was observed. The total hourly frequency of explosions fluctuated between the average values (10-14 events / h) with the sole exception of October 22 with average-low values (7 events / h). The intensity of the explosions was low in the North crater area and variable from low to high in the Center-South area.
2) SEISMOLOGY: The seismological parameters monitored do not show significant variations.
3) DEFORMATIONS: The island’s soil deformation monitoring networks did not show any significant changes to report for the period under review.
4) GEOCHEMISTRY: The flow of SO2 at an average level
The flow of CO2 emitted by the ground at Pizzo Sopra la Fossa is at medium-high levels.
There is no update from the previous bulletin (C / S = 4.41).
5) SATELLITE OBSERVATIONS: The thermal activity in the summit area is at a low level.
VOLCANOLOGICAL OBSERVATIONS
In the observation period, the eruptive activity of Stromboli was characterized by the analysis of the images recorded by the surveillance cameras of the INGV-OE (altitude 190m, Punta
Corvi, altitude 400m and Pizzo). The explosive activity was mainly produced by 4 (four) eruptive vents located in the area of the North crater and 5 (five) eruptive vents located in the area of the
Center-South crater. All the vents are placed inside the depression which occupies the terrace of the crater (Fig. 3.1).
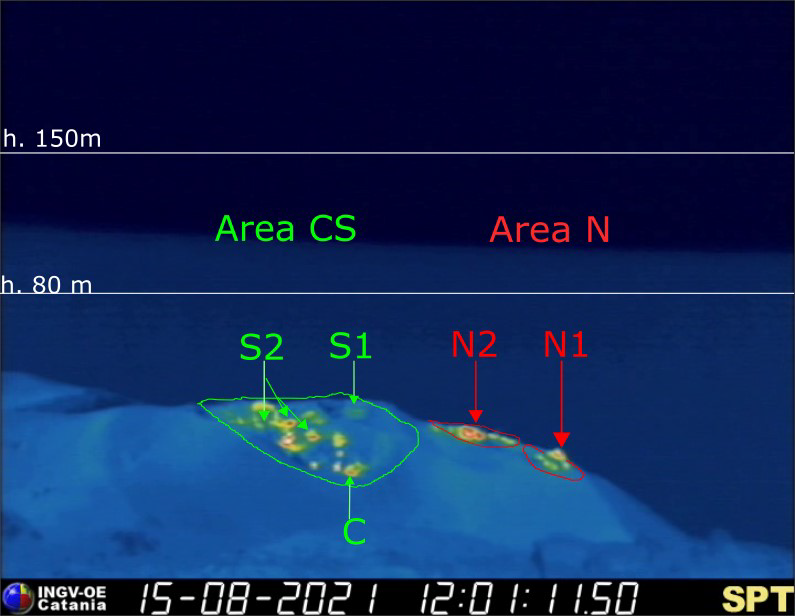
Fig. 3.1 – The crater terrace seen by the thermal camera placed on Pizzo sopra la Fossa with the delimitation of the zones of the crater, Center-South Zone and North Zone (ZONE N, ZONE C-S respectively). Abbreviations and arrows indicate the names and locations of active vents, the area above the crater terrace is divided into three height ranges relating to the intensity of the explosions.
The N1 crater located in the North zone, with three emission points, produced explosions of a generally low intensity (less than 80 m in height) emitting fine materials (ash) mixed with coarse materials (lapilli and bombs ). Vent N2 showed low intensity explosive activity (less than 80 m in height) emitting fine material mixed with coarse material. The average frequency of explosions varied from 4 to 8 events / h.
In the Center-South zone, sector S1 did not show any explosive activity, while the three vents located in sector S2 produced explosions, even simultaneously, of varying intensity from low to high (the products of some explosions exceeded 150 m in height) emitting coarse materials. Sector C did not show explosive activity emitting coarse materials with low intensity until October 23. The frequency of the explosions varied from 6 to 7 events / h.
Source : INGV.
Photos : Webcam , INGV.
Italy , Vulcano :
The temperature of the gases emitted by the fumaroles is one of the parameters measured as part of the geochemical monitoring activities of volcanoes (Figure 1). We have also discussed this in a previous article, describing the campaign of measures organized on Vulcano, following the change from the green alert level to the yellow alert level. On that day (October 12, 2021), a temperature of 344 ° C was detected. But is this temperature high or is it low? How far can the temperature of volcanic gases go?
The answer is: it depends. The temperature of a gas mixture depends on many factors related to the conditions of the volcanic system and the atmospheric conditions present at the time of the surface measurement (atmospheric pressure, rain).
The volcanic gases which feed the fumaroles are first dissolved in the magma, which can reach temperatures between 950 and 1200 ° C. If the conditions are suitable, the gases are released from the magma and rise up, filtering through the networks of pores and fractures, until they reach the surface. During this ascent, the gases expand, sometimes mix with more superficial fluids and, in general, cool. The extent of this cooling depends on the ease with which the gases reach the surface: when the magma that generates them is superficial and the fumarolic ducts are well developed, the temperatures observed at the mouths of the fumaroles can reach 800-900 ° C. Conversely, if the magma is deep or if the path that the gases must follow to reach the surface is long and winding, the temperature will be lower. The possible presence of groundwater can help cool the rising gases, stabilizing the temperature at the boiling value of water (100 ° C, at sea level). Even the appearance of heavy rains can significantly reduce the measured temperature, but in this case the variation is only temporary and the fumarole will tend to restore the values measured before the meteoric event.
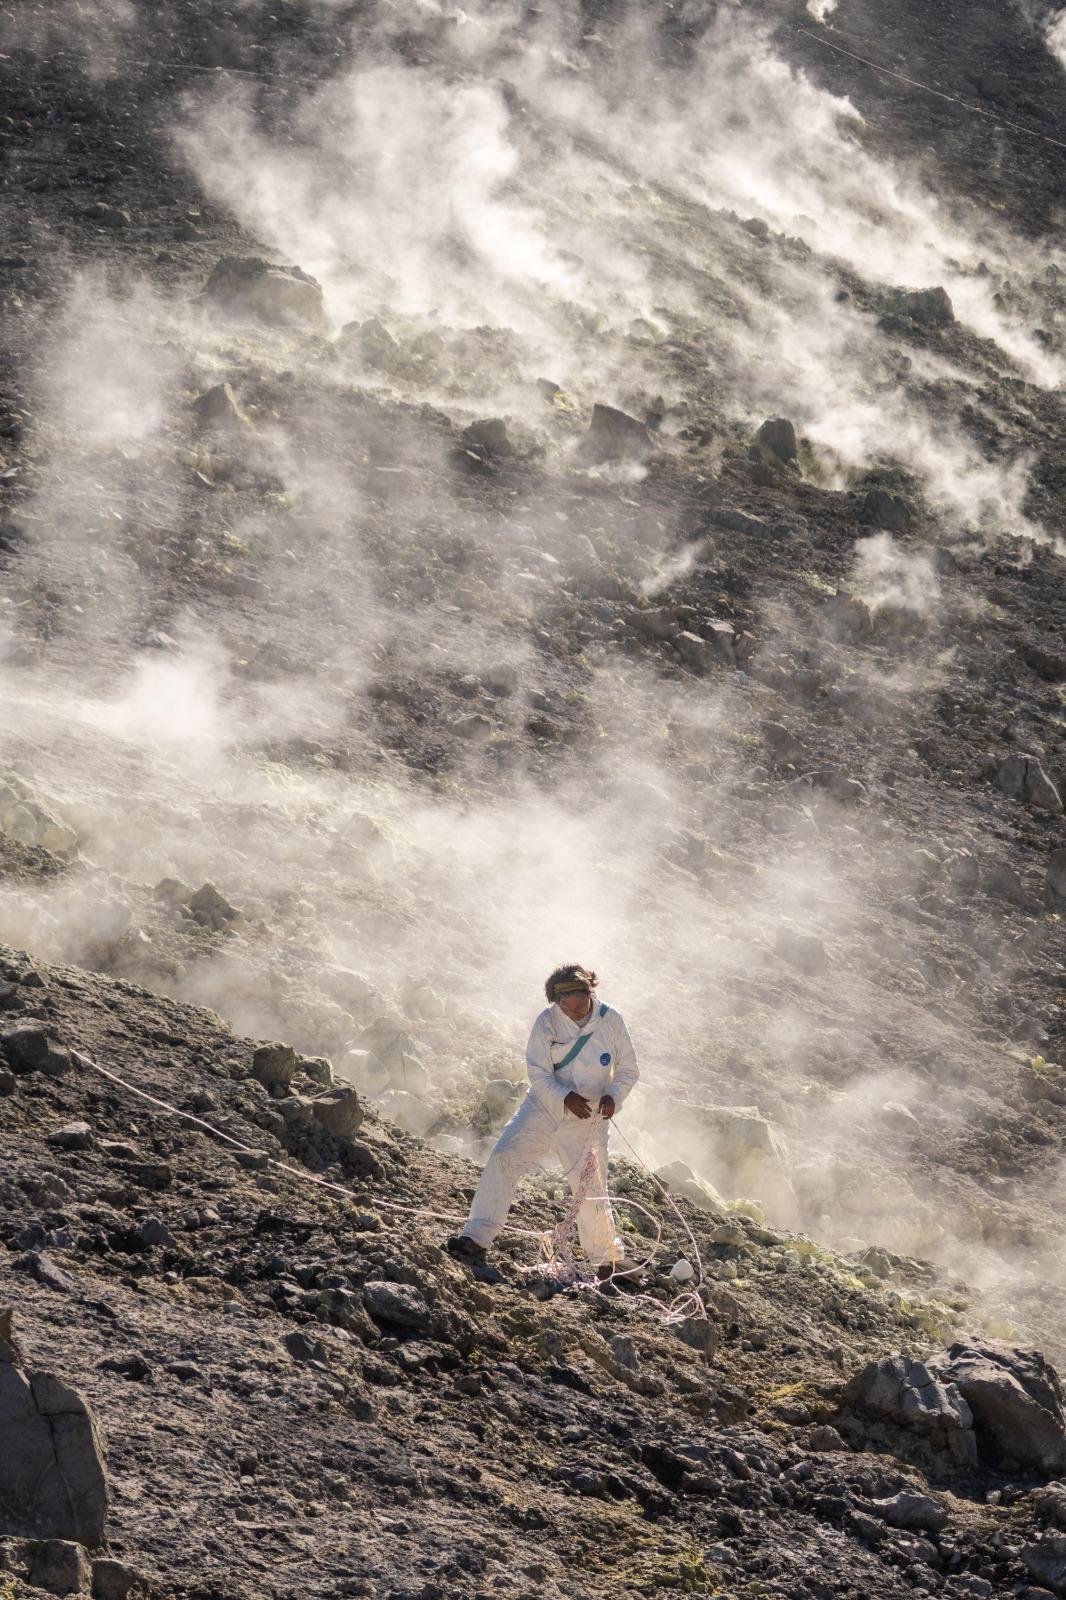
In the case of Vulcano Island, the La Fossa crater is home to numerous fumaroles, both on the northern edge and along the inner flanks (Figure 2). The temperature of the gases emitted is measured both periodically, as part of measurement campaigns, and continuously using instruments capable of acquiring measurements with an hourly frequency (Figure 3).
Each one reflects its own way to the surface and for this reason we observe different temperatures between one fumarole and another, with differences of up to 200 ° C. At the start of 2021, the temperatures recorded in different fumaroles ranged from a minimum of around 100 ° C to a maximum of about 360 ° C.
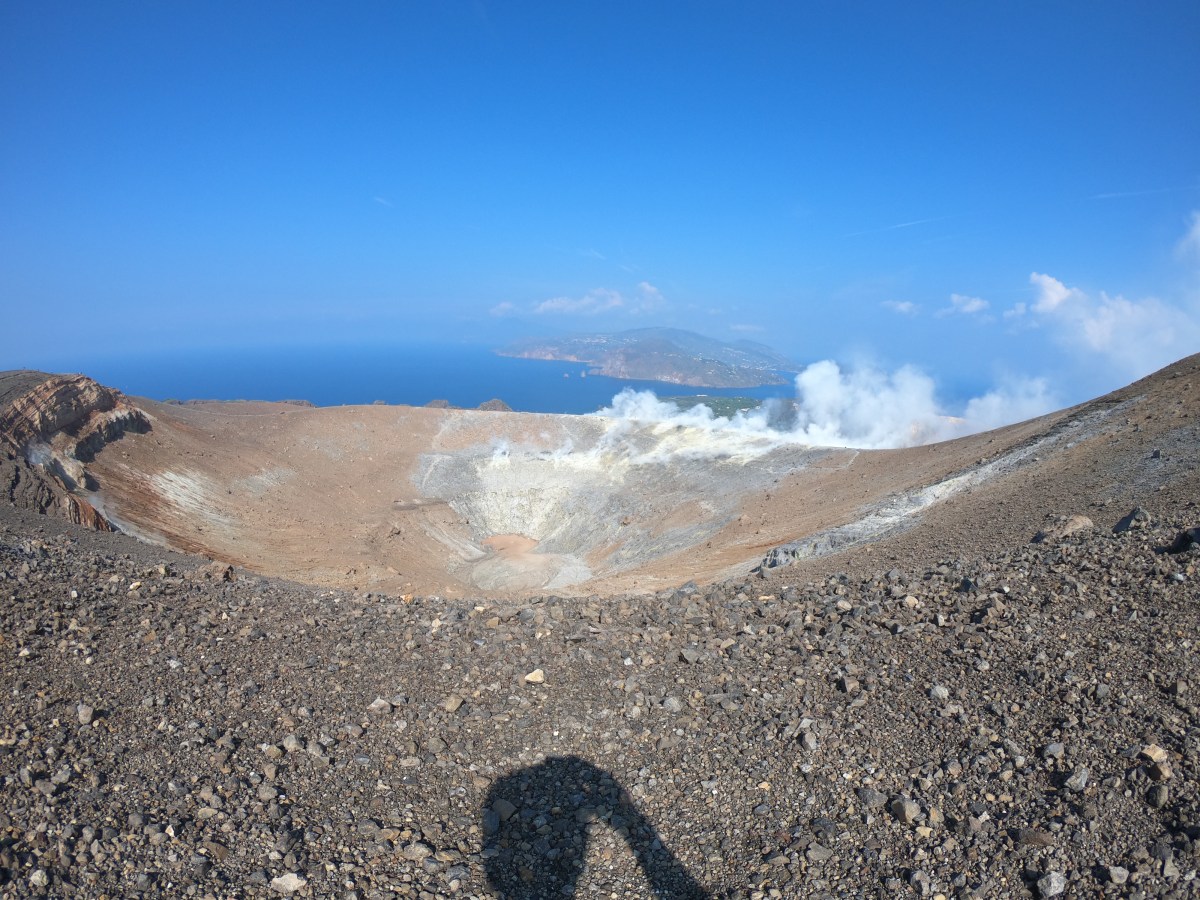
Figure 2 – La Fossa crater on Vulcano Island and the main fumarolic field as it appeared on September 29, 2021. Photograph by Marco Anzidei.

Figure 3 – Monitoring station for the continuous measurement of the temperature of the fumaroles. The station is installed on the northern edge of the crater and has been operational since 1989. The temperature of the fumaroles is monitored by the Palermo Section of the INGV. (Photo by Iole Serena Diliberto).
In addition, even for the same fumarole, the temperatures are not constant over time. Figure 4 compares, by way of example, the temperatures measured for two fumaroles found in the main fumarolic field, which is located on the northern edge of the crater of La Fossa. The F5AT fumarole reached temperatures above 500 ° C in 1996, while from 2013 it underwent a gradual cooling to a value of around 200 ° C in 2019. This cooling was interrupted during 2021.

Figure 4 – Temperature data from the time series of fumaroles located on the upper edge of the La Fossa cone. The measurements are carried out by the continuous monitoring network which records a measurement every hour. Temperature monitoring is provided by the Palermo section of the INGV (graph taken from the scientific article by Diliberto, 2021).
The observed variability becomes even more remarkable if the time interval considered is widened. Thanks to the observation and continuous study of these gaseous emissions for a long time, we have had measurements since the beginning of the 1900s (Figure 5) and this historical heritage of data shows us that the temperatures measured at the fumaroles of the crater have exceeded 600 ° C on several occasions: first in 1924 (615 ° C) then again in the early 1990s (650 ° C in 1991, 690 ° C in 1993).
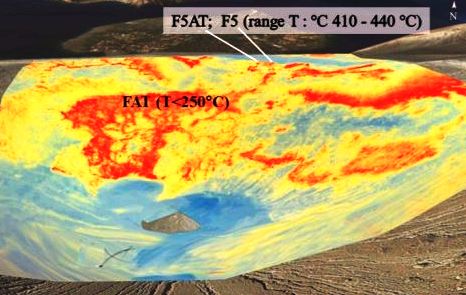
Graph 6 – The fumarolic emissions from the crater cause a surface thermal anomaly that can be detected with an infrared thermal camera. The image refers to a survey carried out in 2014 (Figure taken from the scientific article by Silvestri et al., 2019).
Source : INGV.
Read the full article: https://ingvvulcani.com/2021/10/26/quanto-sono-calde-le-fumarole-di-vulcano/?fbclid=IwAR1_h7pBqsChhKmVk1OsRKe4X8rM9XwWqoIjWHtVOcSITw6GZkfLBd-4khQ