August 06 , 2025.
Iceland , Reykjanes Peninsula :
The volcanic eruption that began on July 16 has now come to an end—for the time being.
Volcanic tremor and explosive activity ceased over the weekend.
No activity has been observed in the craters, according to drone imagery from the police.
Gas pollution and volcanic haze have been minimal in recent days.
Hazards in the area
It is life-threatening to walk on newly formed lava, as the surface crust may collapse without warning and glowing lava may lie just beneath.
The lava front remains hazardous, as sudden lava surges can occur without warning. The lava edge itself may also collapse.
Gas pollution can still exceed danger thresholds in the vicinity of the eruption site.

Yesterday, Monday, activity in the crater came to a complete stop alongside decreasing tremor. Slight activity was visible during the night, but today no activity has been detected, and the eruption is now considered over.
Uplift has resumed, according to satellite and GNSS measurements, by approximately 2–3 centimeters. This confirms that magma is still accumulating beneath Svartsengi, and if uplift continues, it could lead to new magma intrusions and future eruptions.
No significant changes have occurred in the extent of the lava field in recent days, but it remains unstable. This can result in sudden advances at the lava front. In such cases, the surface of the edge may collapse without warning and a glowing lava tongue may surge forward. These surges are life-threatening, and it is essential to keep a safe distance from the edge. This hazard remains even though the eruption has ended.
Gas pollution from the eruption has been low in the area over the past two days, and no volcanic haze has been detected. However, even though crater activity has ceased, there is still a possibility of volcanic haze appearing—sometimes for several days after an eruption ends.
Source : IMO.
Photo : Smile adventure
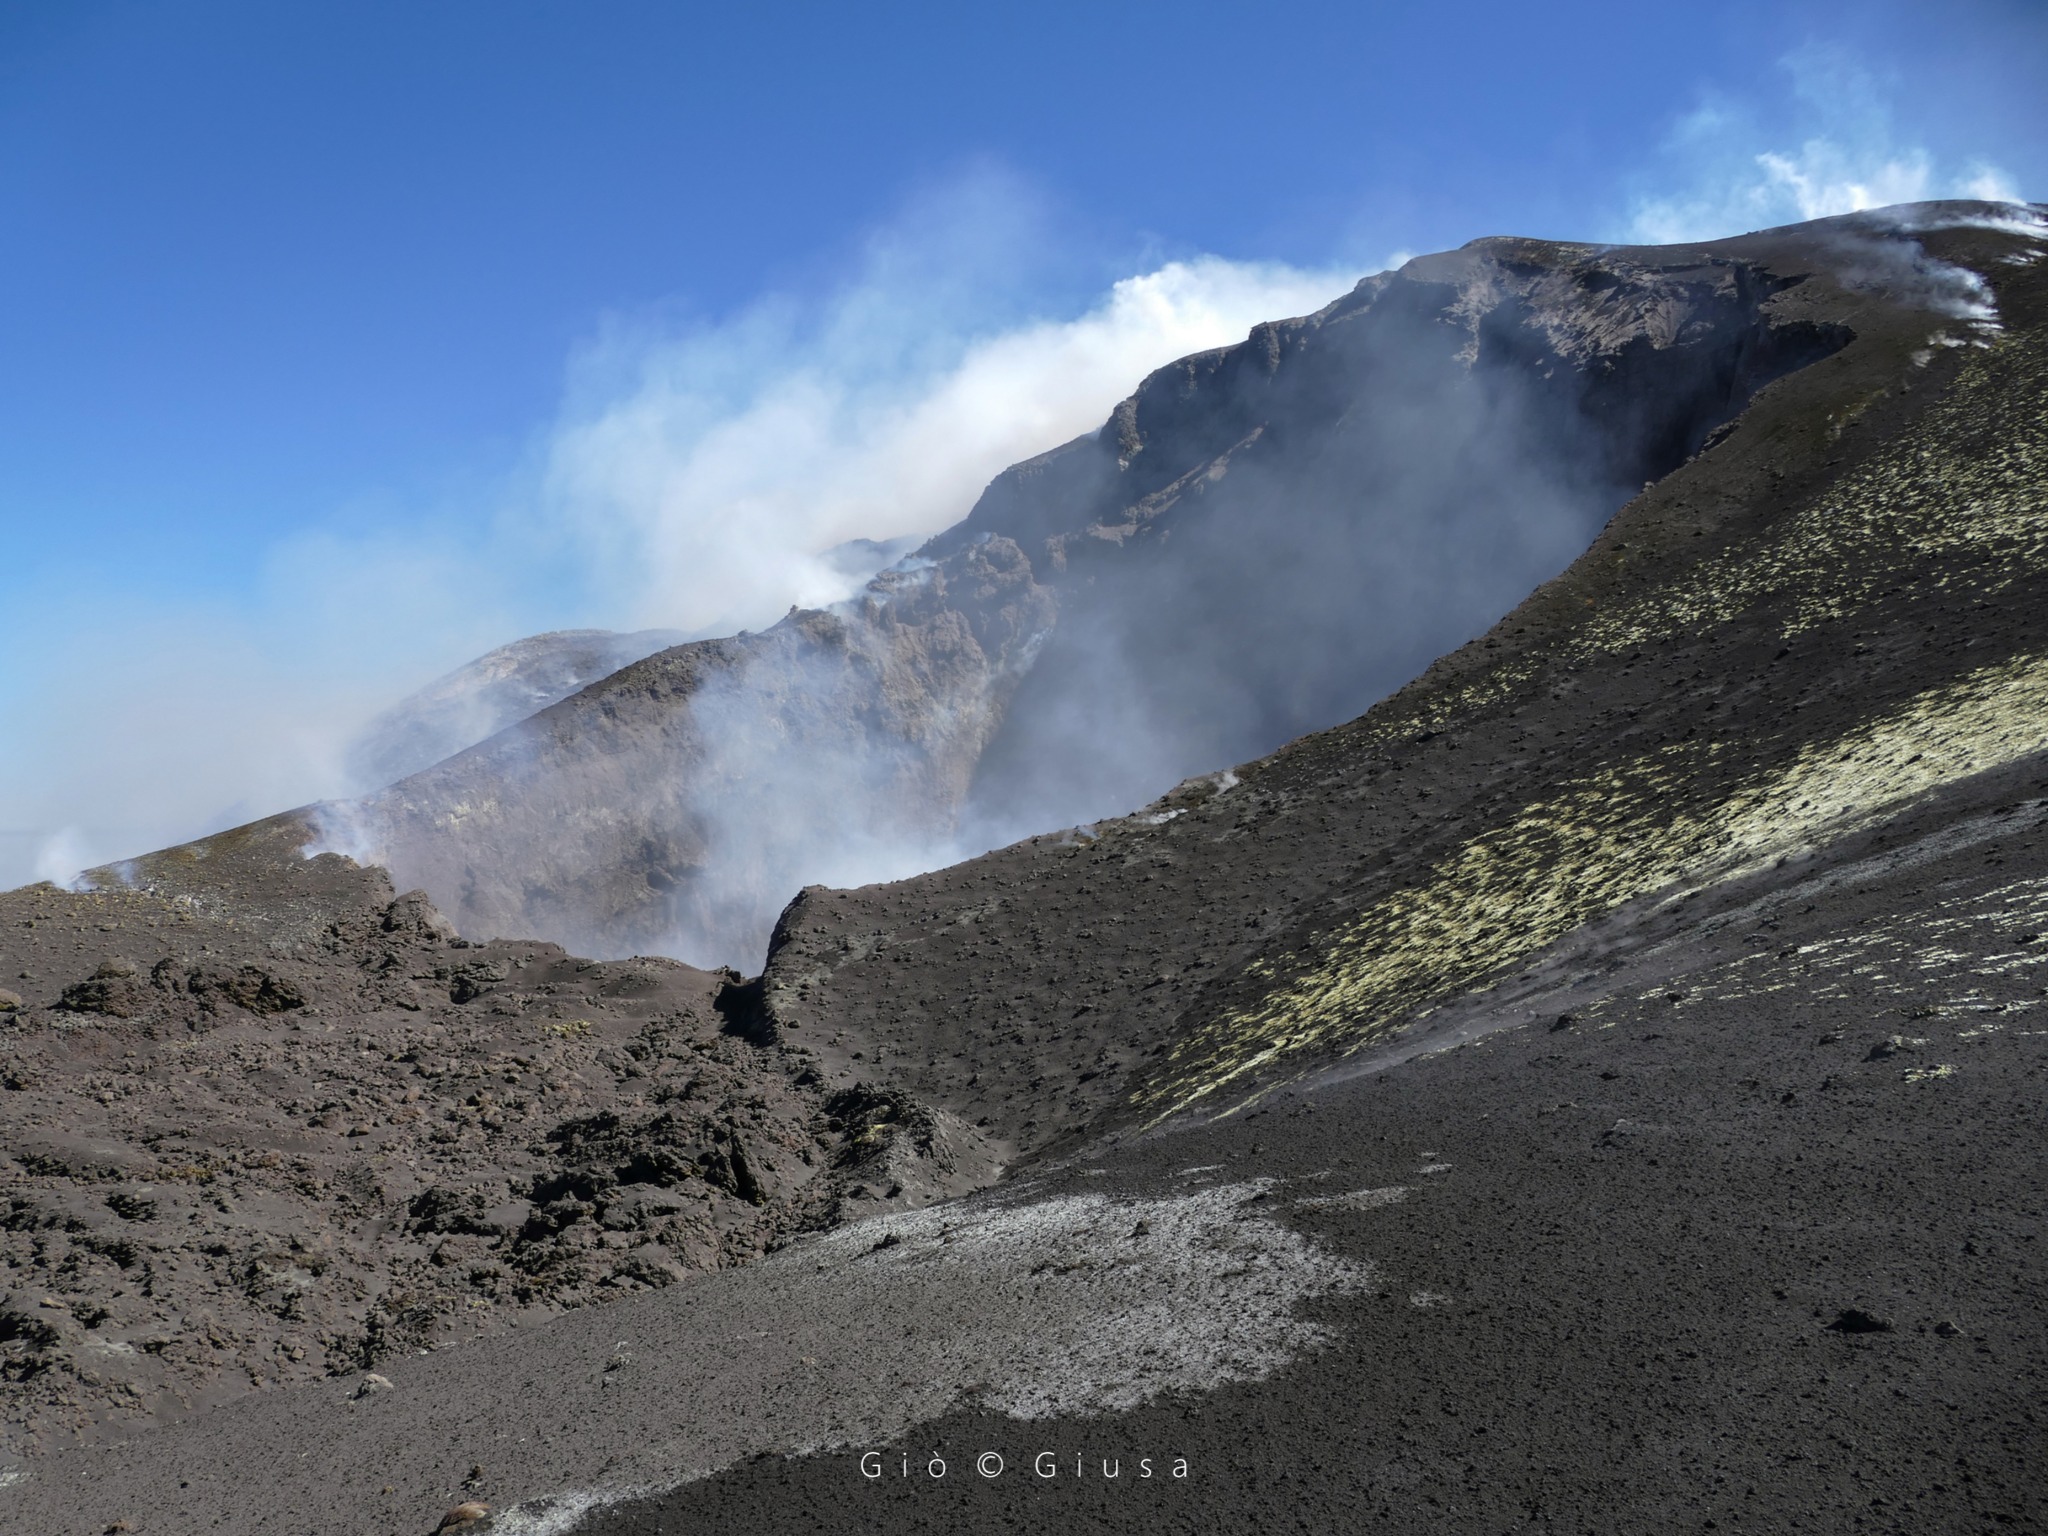
Italy / Sicily , Etna :
WEEKLY BULLETIN. From July 28, 2025 to August 3, 2025. (Publication date: August 5, 2025)
ACTIVITY SUMMARY
Based on monitoring data, the following points are highlighted:
1) VOLCANOLOGICAL OBSERVATIONS: Variable rate degassing activity in the summit craters. Low explosive activity in the Southeast crater.
2) SEISMOLOGICAL: Seismic fracturing activity with Ml >=2.0 at low intensity. Average volcanic tremor amplitude at medium-low intensity.
3) INFRASOUND: Low infrasound activity localized in the Northeast and Southeast craters.
4) GROUND DEFORMATION: No significant changes are reported in the time series of the ground deformation monitoring networks. 5) GEOCHEMISTRY: Low-intensity SO2 fluxes
Soil CO2 fluxes (EtnaGas Network): Low values.
Dissolved CO2 in groundwater (EtnaWater Network): No update.
Helium isotope ratio at peripheral sites: The latest data from July 18 were high.
6) SATELLITE OBSERVATIONS: Thermal activity observed by satellite in the summit area was generally low.
VOLCANOLOGICAL OBSERVATIONS
Monitoring of Mount Etna’s volcanic activity was carried out through the analysis of images from the Osservatorio Etneo, the INGV’s surveillance camera network. During the week of observation, the activity of the summit craters remained essentially the same as that described in previous bulletins.
The summit craters were mainly affected by variable-rate degassing, with the exception of the Southeast Crater, which also exhibited low explosive activity with ash emission that rapidly dispersed throughout the summit area.
Source : INGV
Photo : Gio Giusa .
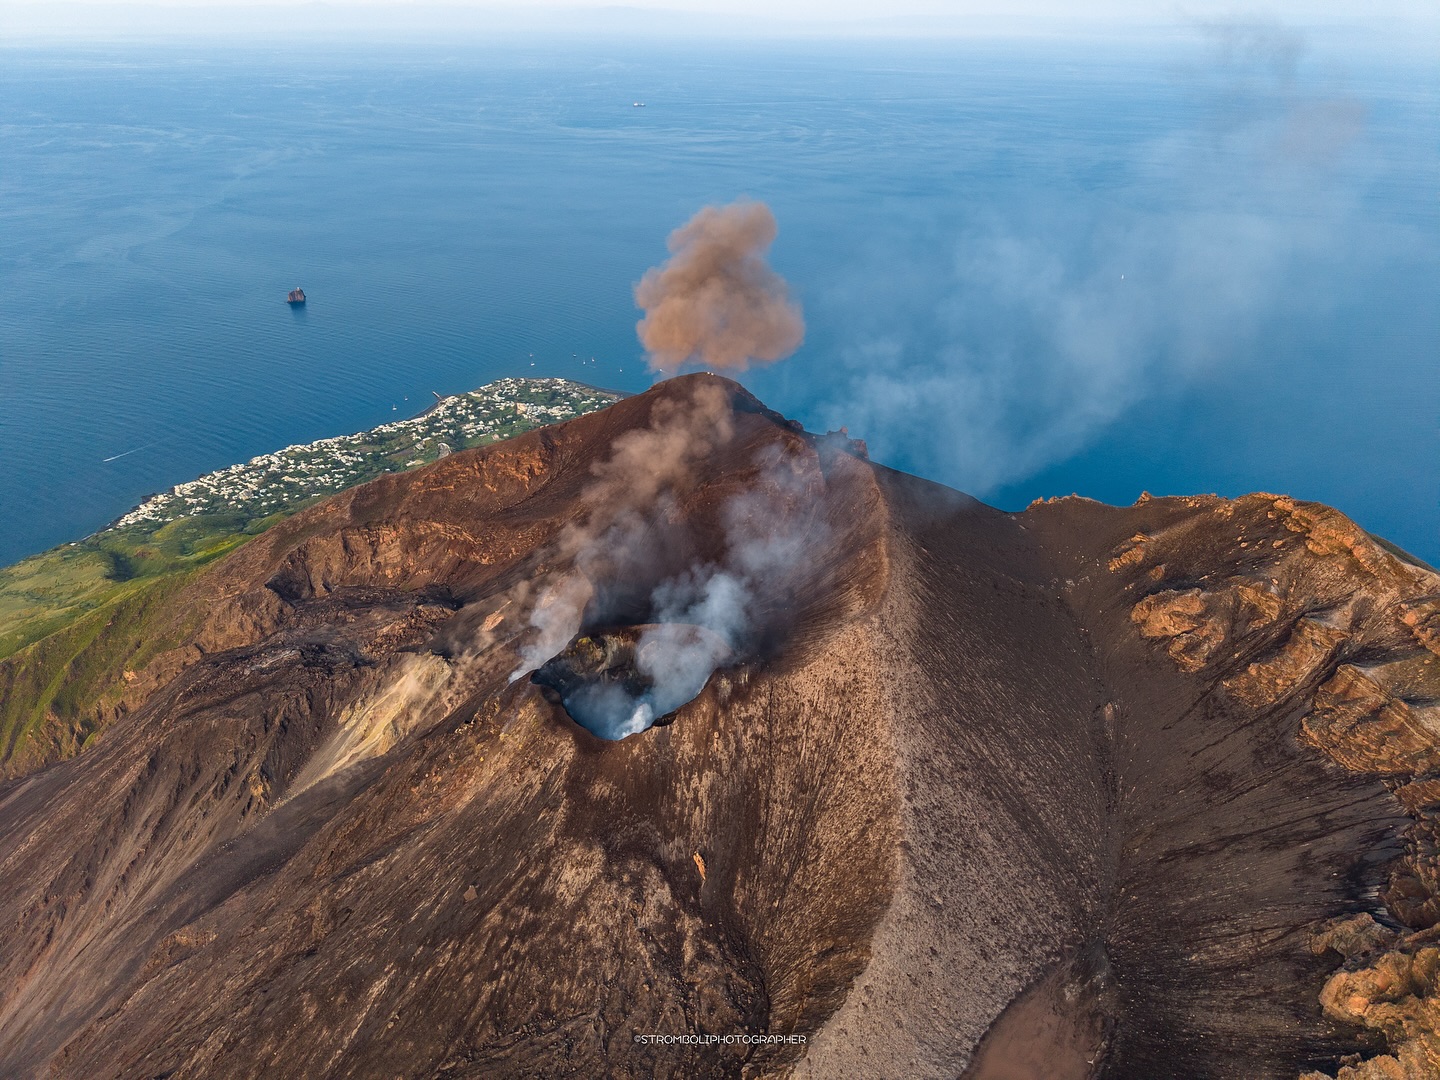
Italy , Stromboli :
WEEKLY BULLETIN. From July 28, 2025 to August 3, 2025. (Publication date: August 5, 2025)
ACTIVITY SUMMARY
Based on monitoring data, the following points are highlighted:
1) VOLCANOLOGICAL OBSERVATIONS: Ordinary eruptive activity of medium frequency in the northern crater area and low frequency in the central-southern area. The average total frequency was 9.6 events/hour, with low intensity and episodes of medium intensity in the northern area and low intensity in the central-southern area.
2) SEISMOLOGY: The monitored seismic parameters show no significant variation.
3) GROUND DEFORMATION: No significant variation was detected in the ground deformation data. 4) GEOCHEMISTRY: Medium-low SO2 flux
High soil CO2 flux in the Pizzo region (STR02).
C/S ratio in the plume: medium-high values.
Dissolved helium isotope ratio (R/Ra) in the thermal aquifer: high values.
Soil CO2 flux in the Scari region: high values.
5) SATELLITE OBSERVATIONS: Thermal activity observed by satellite in the summit area was generally low.
VOLCANOLOGICAL OBSERVATIONS
During the observation period, Stromboli’s eruptive activity was characterized by analyzing images recorded by the INGV-OE surveillance cameras located at an altitude of 190 m (SCT-SCV) and at Punta dei Corvi (SPCT). The explosive activity was mainly produced by four eruptive vents located in the North Crater area and by at least two vents located in the Central-South Crater area.
Observations of explosive activity captured by surveillance cameras
The eruptive activity observed in the North Crater area (N) was produced by four active vents, with eruptive products consisting mainly of coarse materials (bombs and lapilli). The explosions were of low intensity (the eruptive products reached a height of less than 80 m) and, at times, of medium intensity (the height of the products varied between 80 and 150 m). The average explosion frequency was approximately 9.0 events/hour.
In the South-Central (SC) area, explosive activity was modest, with the explosions emitting fine particles and of low intensity.
The average explosion frequency was approximately 1.0 events/hour.
Source : INGV
Photo : Stromboli stati d’animo / Sebastiano Cannavo .
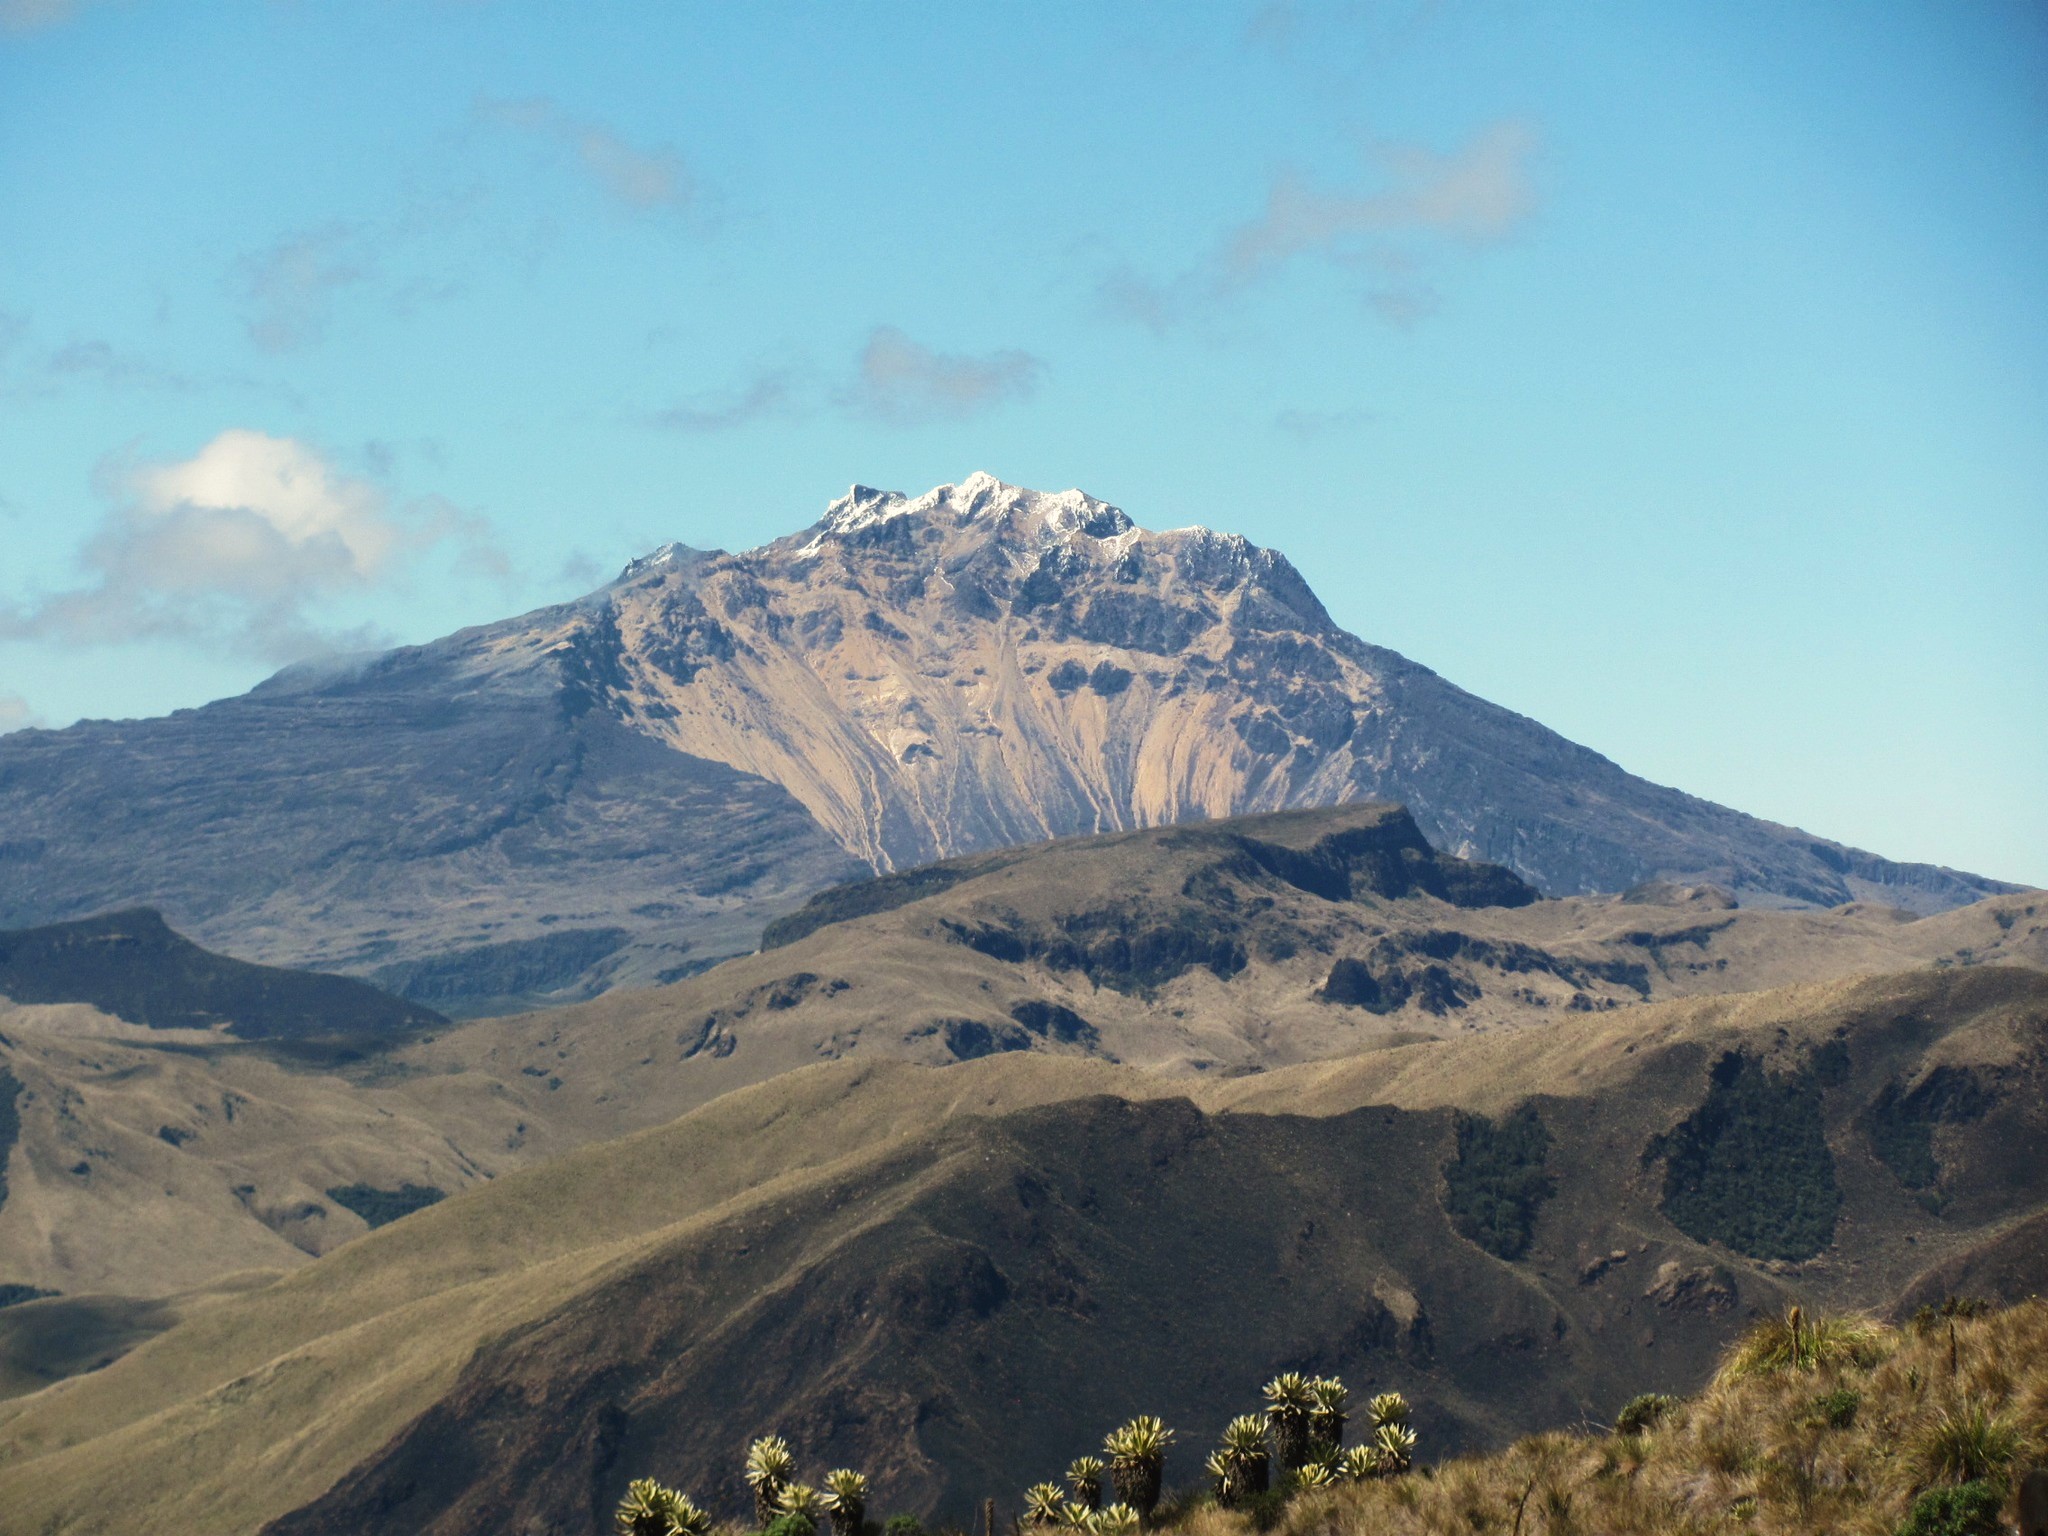
Colombia , Chiles / Cerro Negro :
San Juan de Pasto, August 5, 2025, 3:50 p.m.
Regarding the monitoring of the activity of the Chiles-Cerro Negro Volcanic Complex (CVCCN), the Colombian Geological Survey (SGC), an entity attached to the Ministry of Mines and Energy,
reports that:
From July 29 to August 4, 2025, the main variations in the monitored parameters compared to the previous week were:
● Seismic activity and energy release showed a slight increase compared to the previous week. Seismicity associated with rock fracturing within the volcanic edifice continued to predominate, followed by seismicity related to fluid dynamics.
● Regarding seismicity, three groups can be distinguished. The first group includes the majority of localized earthquakes, mainly concentrated at the summit of the Chiles volcano, in the collapse zone. The earthquakes occurred within a radius of 2 km and at depths between 1 and 6 km from its summit (4,700 m above sea level). The second group was located within a radius of 3.2 km west of the summit of Chiles Volcano, at depths between 3 and 5.2 km. The remaining seismic activity was dispersed throughout the CVCCN’s area of influence, at depths between 6 and 14 km.
● Two earthquakes of magnitude 2.8 and 3.4, recorded on July 29 at 3:45 p.m. and on August 2 at 3:40 p.m., at depths of 3.4 and 3.8 km and located at the summit of Chiles Volcano, were not felt.
● Analysis of information obtained from satellite sensors and ground stations continues to indicate variations related to deformation processes in the volcanic area.
Based on the evaluation and correlation of monitored parameters, the SGC recommends closely monitoring developments through weekly bulletins and other information published through our official channels, as well as instructions from local and departmental authorities and the National Disaster Risk Management Unit (UNGRD).
Volcanic activity remains on yellow alert: active volcano with changes in the baseline behavior of monitored parameters and other manifestations.
Source et photo : SGC .
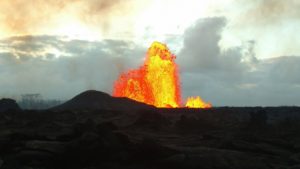
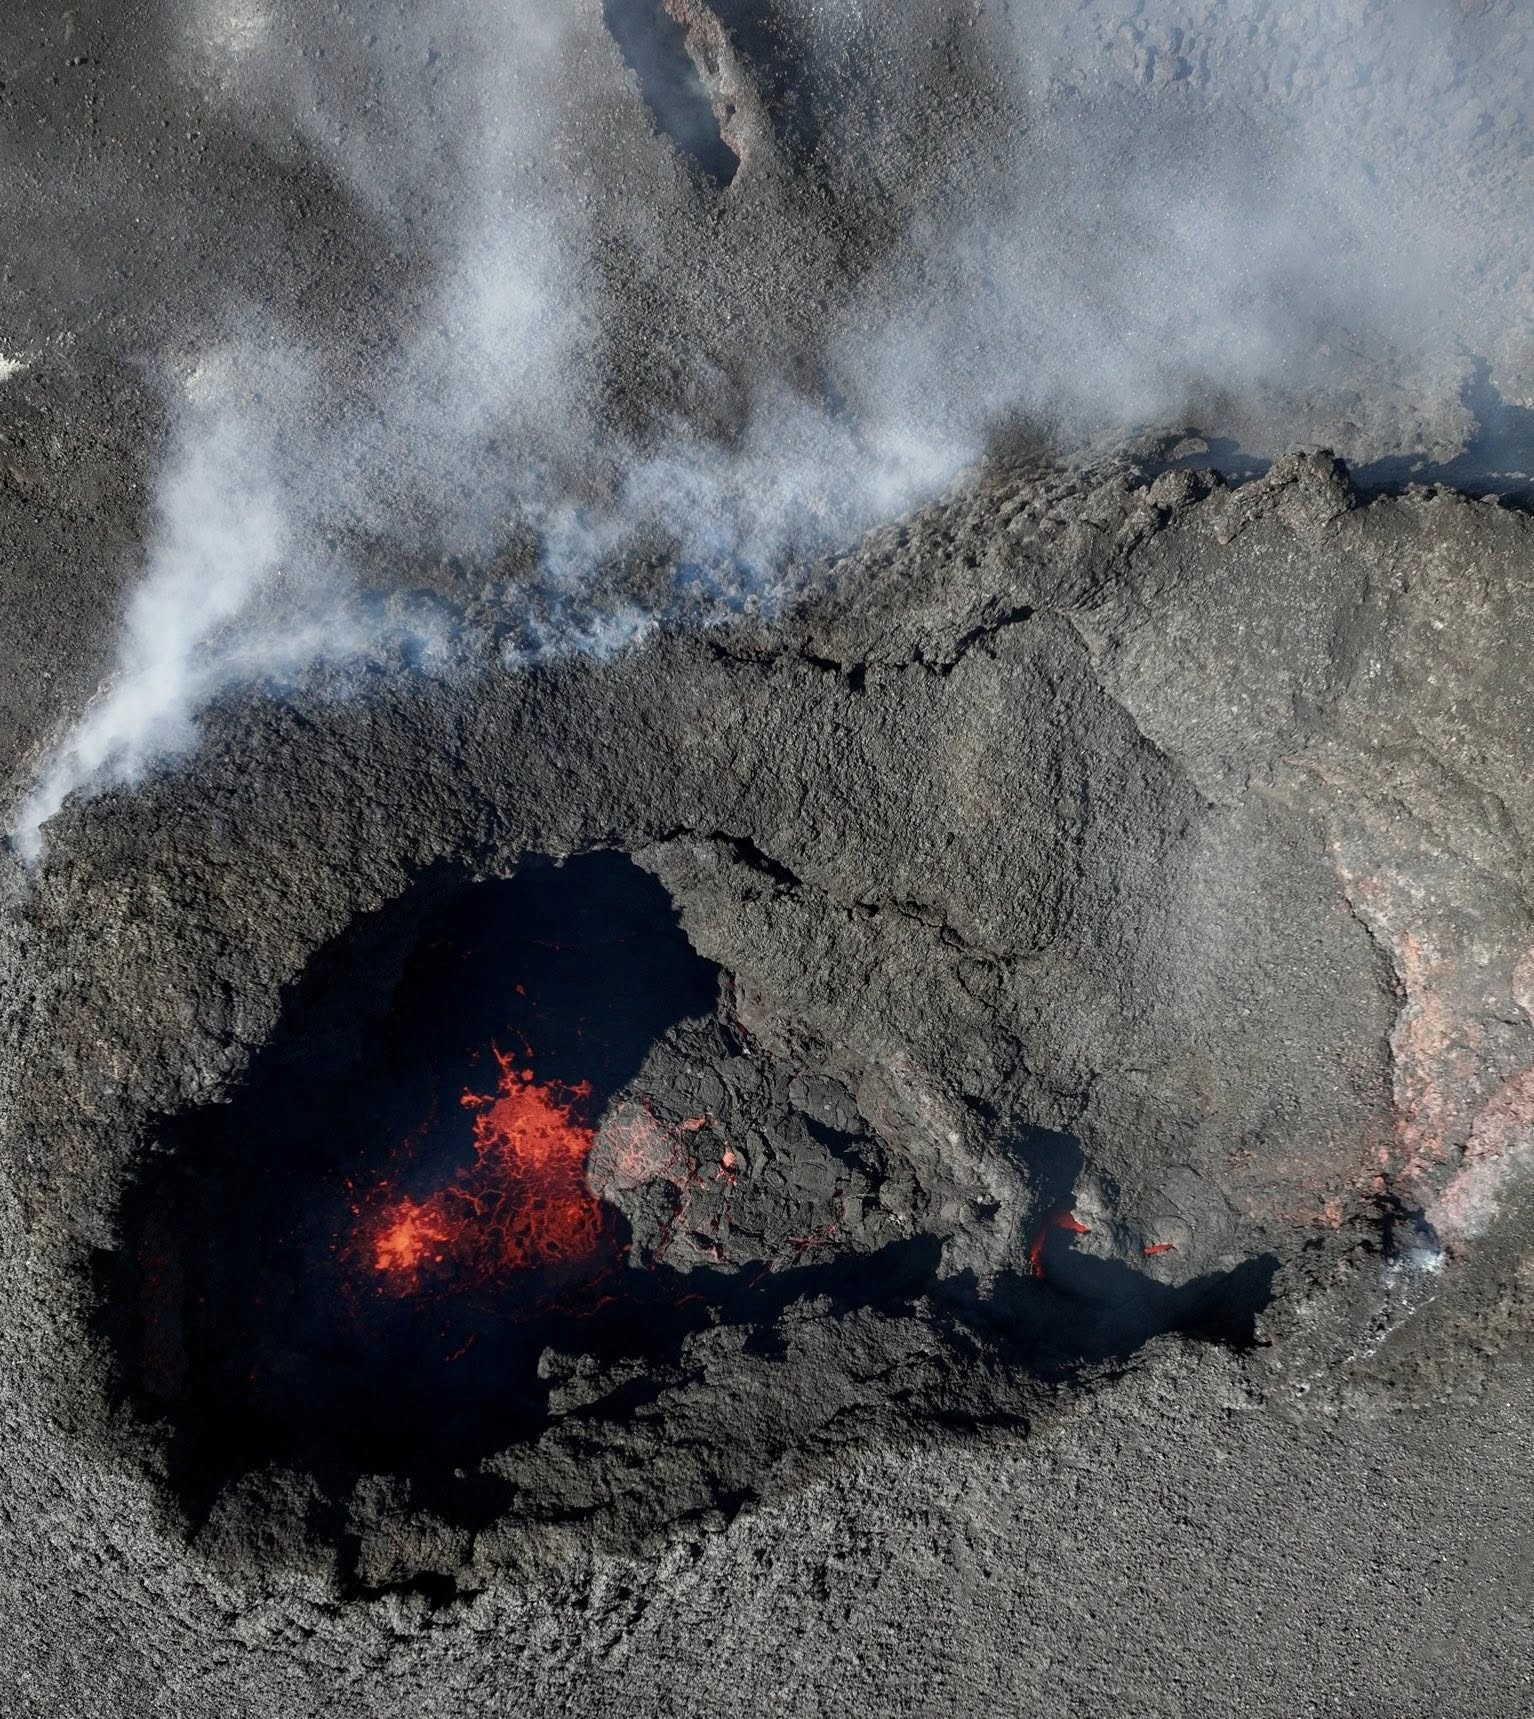
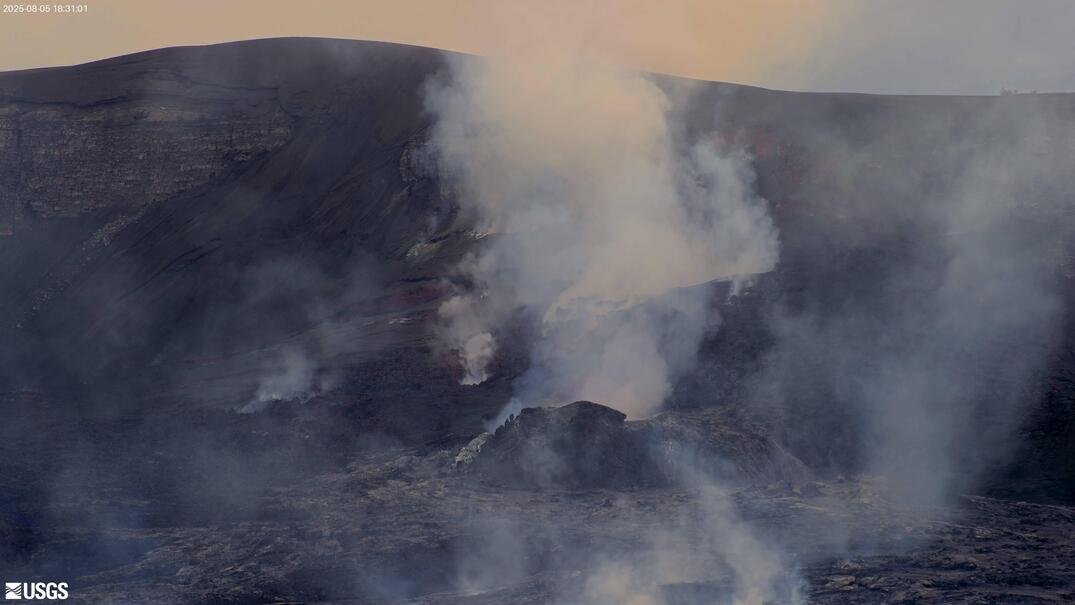
Hawaii , Kilauea :
HAWAIIAN VOLCANO OBSERVATORY DAILY UPDATE , U.S. Geological Survey
Tuesday, August 5, 2025, 9:43 AM HST (Tuesday, August 5, 2025, 19:43 UTC)
19°25’16 » N 155°17’13 » W,
Summit Elevation 4091 ft (1247 m)
Current Volcano Alert Level: WATCH
Current Aviation Color Code: ORANGE
Activity Summary:
The onset of sporadic precursory activity associated with episode 30 of the Halemaʻumaʻu eruption began at 5:51 a.m. HST on August 4, 2025. Strong glow and rare spattering were visible in the north vent overnight but there have been no additional vent overflows. This morning, lava is 15–30 feet (5–10 meters) below the top of the vent. Low-level seismic tremor and degassing at the summit continues. Summit tiltmeter data has fluctuated over the past several days and has recorded virtually no net inflation since Friday evening, August 1. Models suggest that episode 30 sustained lava fountaining may start between now and Thursday if the slow inflation recorded over the past 2–3 days continues.
No significant activity has been noted along Kīlauea’s East Rift Zone or Southwest Rift Zone.
Summit Observations:
Lava overflowed from the north vent at 5:51 a.m. HST and drained back with little spattering in the vent by 5:59 a.m. HST on Monday, August 4. The event was a typical gas-pistoning cycle that produced short overflows. This had been preceded by an earlier gas-pistoning event with lava appearing at 5:14 a.m. HST and draining back with no lava flows and little spattering at 5:18 a.m. HST. Strong glow was visible from the north vent early this morning, with rare spatter visible in V1cam. Incandescence in other parts of the crater remains very low, with weak, intermittent glow from two areas higher up on the eruptive cone. A helicopter overflight of the north vent this morning confirmed that lava is within 15–30 feet (5–10 meters) of the top of the vent. The lava is degassed and is feeding a low volume into a lava tube inside of older flows in the crater. There has been no movement or incandescent breakouts from lava flows on the floor of Halemaʻumaʻu related to current vent activity or other sources.
Elevated degassing continues from the vent. Average sulfur dioxide (SO2) emission rates during inter-episode pauses are typically 1,200 to 1,500 t/d, though emission rates vary on short time scales in association with gas pistoning.
Background seismic tremor remains low during the eruption pause.
Summit tiltmeter records have fluctuated over the past several days. UWD recorded less than 1 microradian of slow inflation over the last 24 hours. Fountaining associated with episode 29 resulted in approximately 19 microradians of deflation. The UWD tiltmeter had re-inflated about 18 microradians at the time of this update but with little net gain since Friday evening, August 1.
Source et photo : HVO