August 14 , 2024 .
Italy / Sicily , Etna :
WEEKLY BULLETIN, from August 5, 2024 to August 11, 2024. (issue date August 13, 2024)
SUMMARY STATEMENT OF ACTIVITY
In light of the monitoring data, it appears:
1) VOLCANOLOGICAL OBSERVATIONS: Emission of volcanic ash and Strombolian activity at the Voragine crater and emission of volcanic ash at the North East crater.
2) SEISMOLOGY: Low seismic activity due to fracturing; the tremor amplitude showed a slow increase from low to medium values.
3) INFRASOUND: Increasing infrasound activity with sources mainly located in correspondence with the craters of Bocca Nuova and Voragine.
4) GROUND DEFORMATIONS: No significant variation was observed in the time series of the ground deformation monitoring stations.
5) GEOCHEMISTRY: low-level SO2 flux
Soil CO2 flux increasing on average.
CO2 dissolved in groundwater does not show significant variations.
There is no update on the helium isotope ratio; the latest data on July 9 was at a high level.
6) SATELLITE OBSERVATIONS: Thermal activity observed by satellite was generally of a moderate level with some isolated high-level thermal anomalies.
VOLCANOLOGICAL OBSERVATIONS
During the week, the monitoring of the volcanic activity of Etna was carried out thanks to the analysis of images from the network of surveillance cameras of the National Institute of Geophysics and
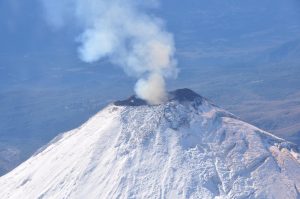
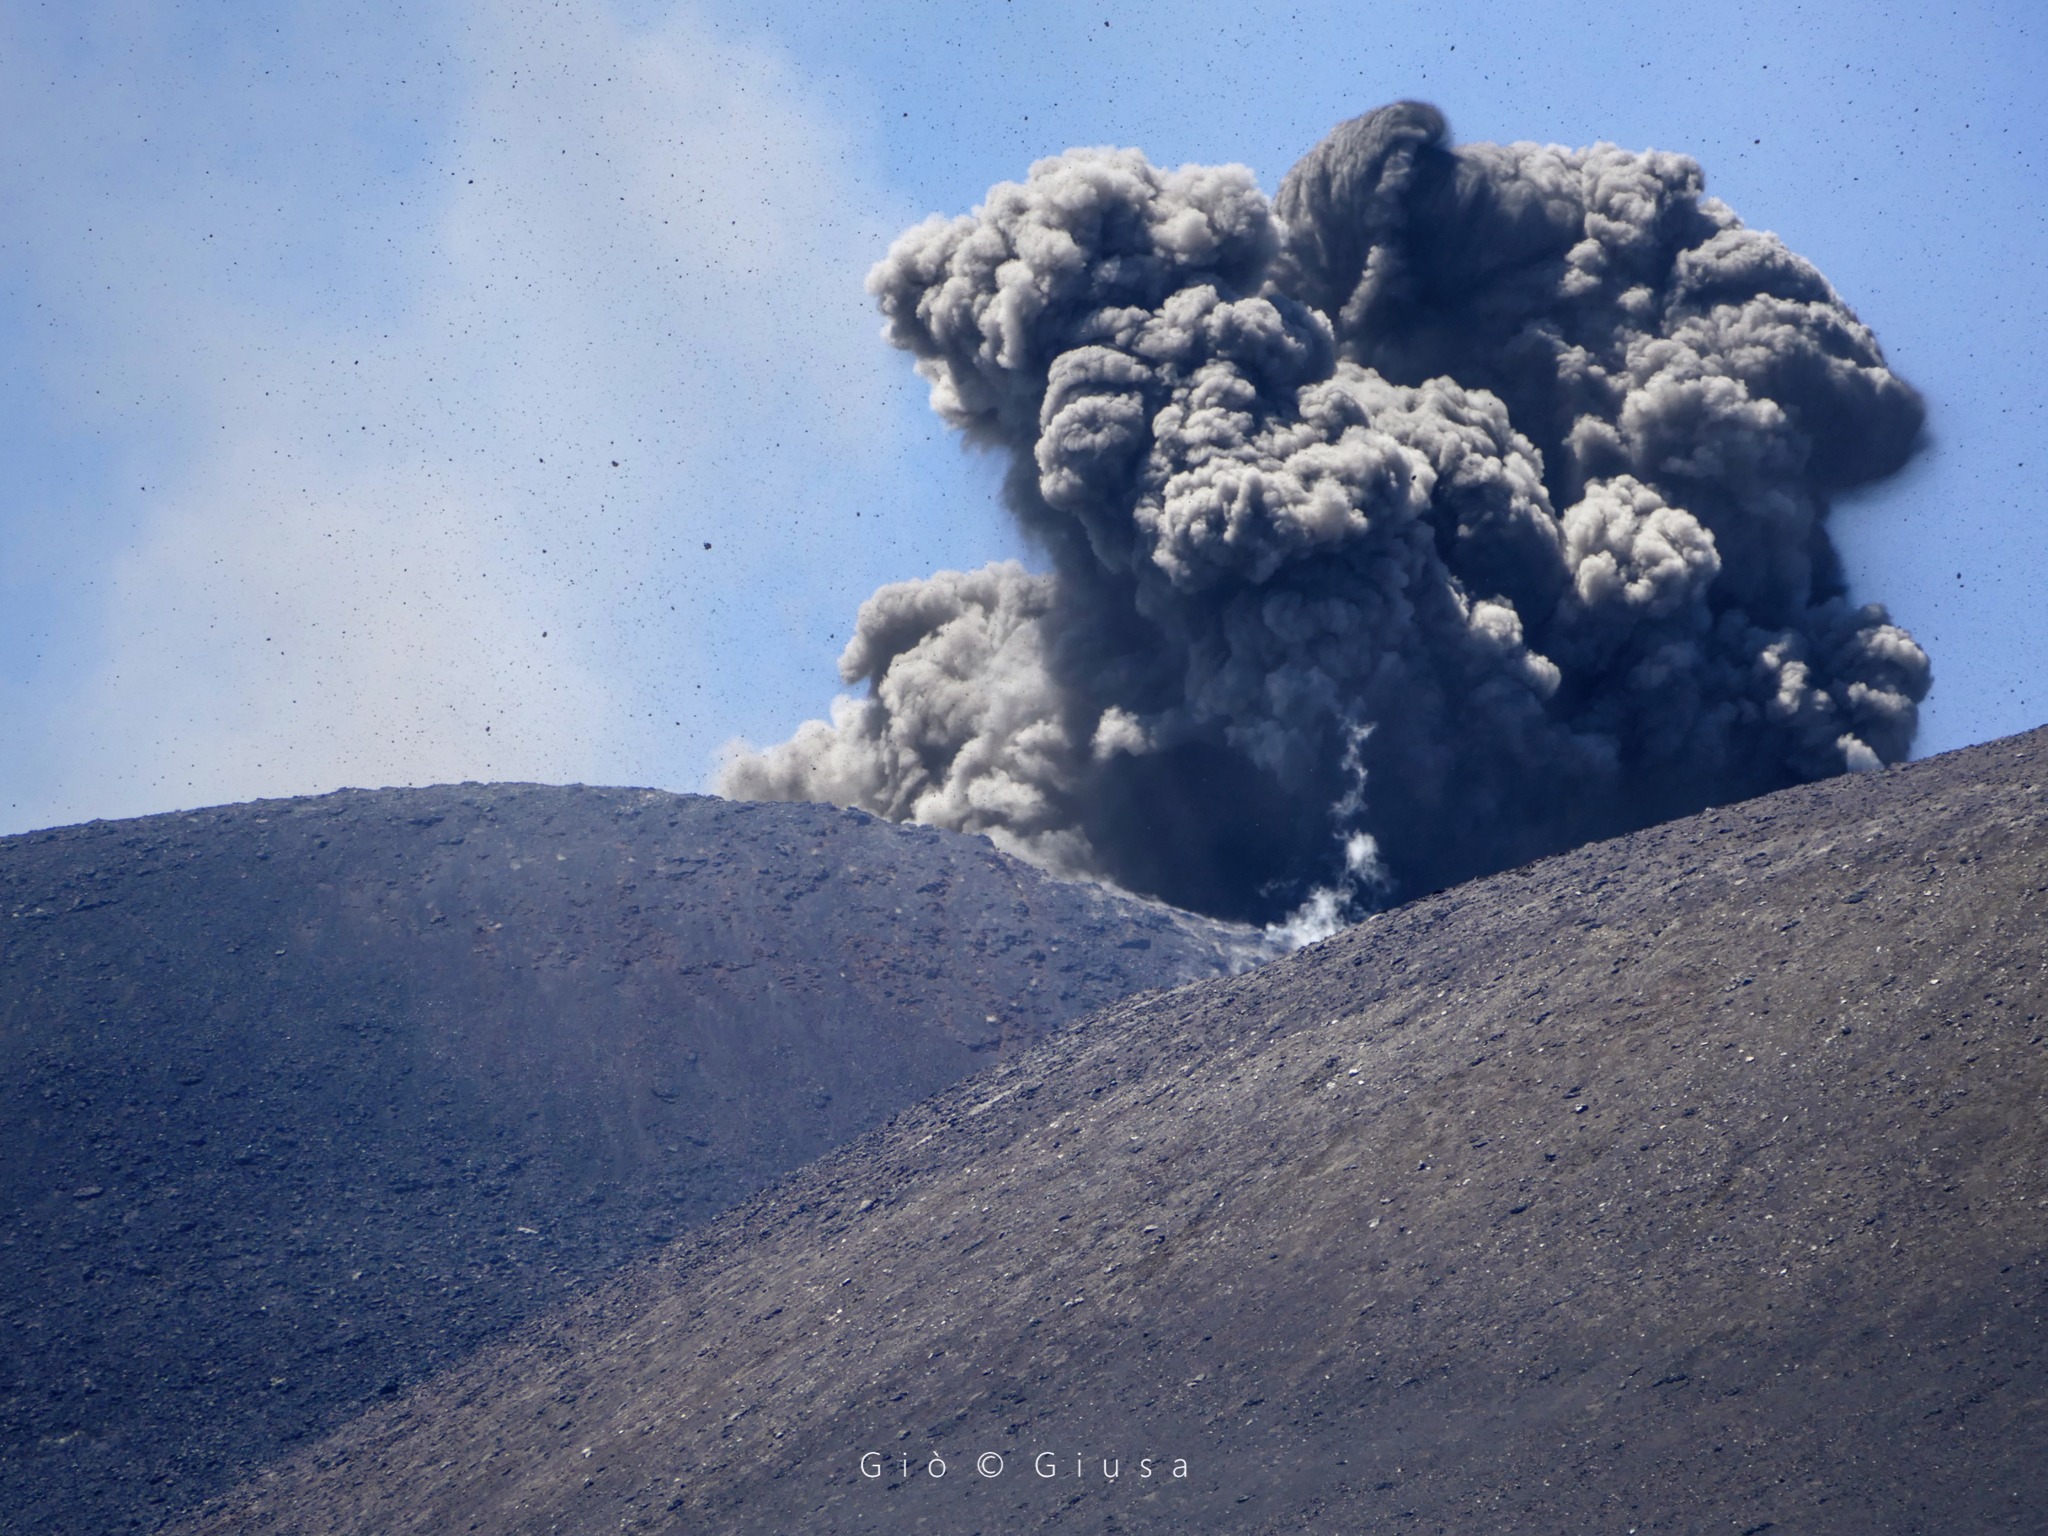
Volcanology, Osservatorio Etneo (INGV-OE). Due to cloud cover, observation of the summit craters was discontinuous. During the period examined, volcanic ash emissions and Strombolian activity were observed at Voragine Crater (VOR) and volcanic ash emissions at Northeast Crater (CNE).
The Voragine crater (VOR) was affected by a light and discontinuous emission of ash which quickly diluted in the atmosphere. Furthermore, during the night it was also possible to observe the presence of weak Strombolian activity thanks to the INGV-OE surveillance cameras.
On the 7th, a discontinuous emission of volcanic ash was also observed from the Northeast Crater (CNE).
Regarding the remaining summit craters, the Southeast Crater (CSE) showed continuous degassing activity while the Bocca Nuova Crater (BN) produced pulsed degassing from at least two vents located at the interior.
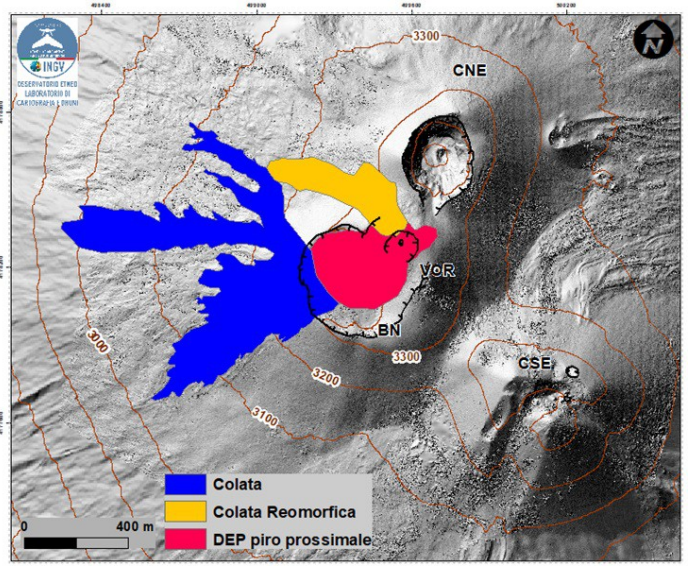
Map of the products of the eruption of August 4, superimposed on the shaded relief of the terrain obtained from the processing of drone images of July 31, 2024. The contour lines are drawn every 100 m (ellipsoidal heights) CSE = South East Crater, CNE=North-East, VOR=Voragine BN=Bocca Nuova
Finally, during the week, the definitive map of the volcano was produced after the eruptive event of August 4, 2024, obtained by analyzing the images in the thermal infrared field acquired on August 4 by drone, by the Cartography and Drones Laboratory. , and Sentinel-2 satellite images from August 9.
A single extra-crater lava field formed, divided into three arms which intersect the route at an altitude of 3000 at three points and an extra-crater rheomorphic flow. The lava flow which reached the lowest minimum altitude is the one towards the West which stopped at 2922 m altitude. Those towards the North-West and the South-West respectively reached the minimum altitudes of 3042 m and 2988 m above sea level; all elevations are geoid (obtained by subtracting 43 m from the ellipsoid elevation). The total area covered by the additional flow from the crater is equal to 3.7 x 10^5 m^2 (blue in Figure 3.1); the surface covered by the rheomorphic flow is equal to 0.7 x 10^5 m^2 (in orange in Fig. 3.1); the surface covered by the proximal pyroclastic deposit is equal to 1.1 x 10^5 m^2 (in red in Fig. 3.1). The total volume, between flows and proximal pyroclastic deposits, was estimated at approximately 2.7 x 10^6 m^3, considering average thicknesses (4 m for extra-crater and rheomorphic flows, and 9 m for deposits proximal pyroclastics) equal to those measured for the July 15 event from the comparison of digital terrain models extracted by drone. The volume estimate is associated with an error of 40%.
Source : INGV
Photos : Gio Giusa ( 29/07/2024) , INGV
Italy , Stromboli :
WEEKLY BULLETIN, from August 5, 2024 to August 11, 2024. (issue date August 13, 2024)
SUMMARY STATEMENT OF ACTIVITY
In light of the monitoring data, it appears:
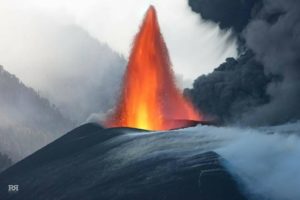
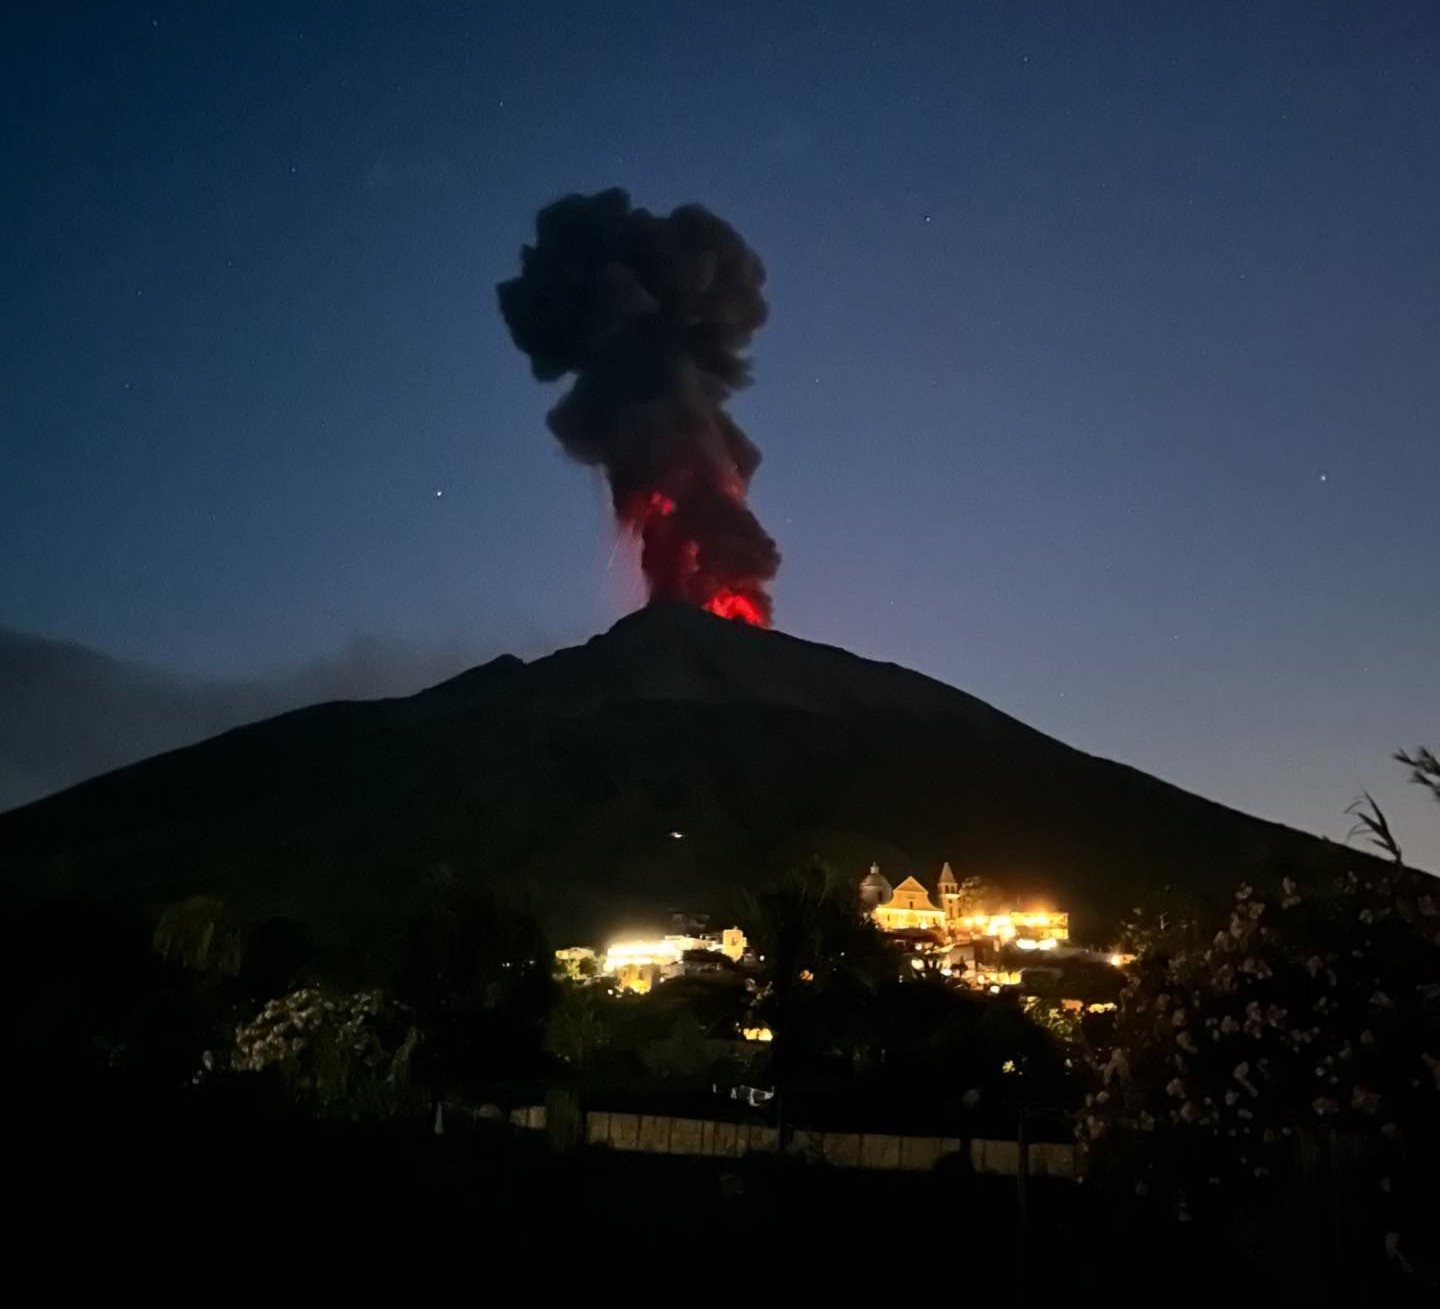
1) VOLCANOLOGICAL OBSERVATIONS: During this period, intense eruptive activity with splashing was observed. The total hourly frequency fluctuated between average values (8-12 events/h). The intensity of the explosions varied from low to medium in the North Crater area and from medium to high in the South-Central area.
2) SISMOLOGY: The monitored seismological parameters do not show significant variations.
3) GROUND DEFORMATIONS: No significant variation is reported in the time series of ground deformation monitoring stations.
4) GEOCHEMISTRY: SO2 flux at a medium to medium-high level with intra-day values at a high level
CO2 flow from the ground to the Pizzo (STR02): due to technical problems there are no updates.
The C/S ratio in the plume increases slightly, over average values.
Dissolved Helium Isotope Ratio: There are no updates.
CO2 flow in Mofeta in the San Bartolo area: stable at medium-high values.
CO2 flux in Scari: stable values at medium-high levels.
5) SATELLITE OBSERVATIONS: Thermal activity observed by satellite was generally weak.
VOLCANOLOGICAL OBSERVATIONS
During the observed period, the eruptive activity of Stromboli was characterized thanks to the analysis of images recorded by the INGV-OE surveillance cameras located at altitude 190 m (SCT-SCV) and at Punta dei Corvi ( SPCT). The explosive activity was mainly produced by 3 (three) eruptive vents located in the northern area of the crater and by 1 (one) vent located in the south central area.
Observations of explosive activity captured by surveillance cameras
In the North Crater area (N), three active vents were observed which produced explosive activity whose intensity varied from low (less than 80 m high) to medium (less than 150 m high). Splashing was also observed at the southernmost vent of the three. The products emitted in the eruption were mainly coarse materials (bombs and lapilli). The average frequency of explosions fluctuated between 8 and 10 events/h. In the Central-South (CS) zone, the explosions were of varying intensity ranging from medium (less than 150 m in height) to high (more than 250 m in height) emitting fine materials sometimes mixed with coarse materials. The average frequency of explosions varied between 1 and 2 events/h.
Source : INGV
Photo : Stromboli stati d’animo / Sebastiano Cannavo ( 26/07/2024).
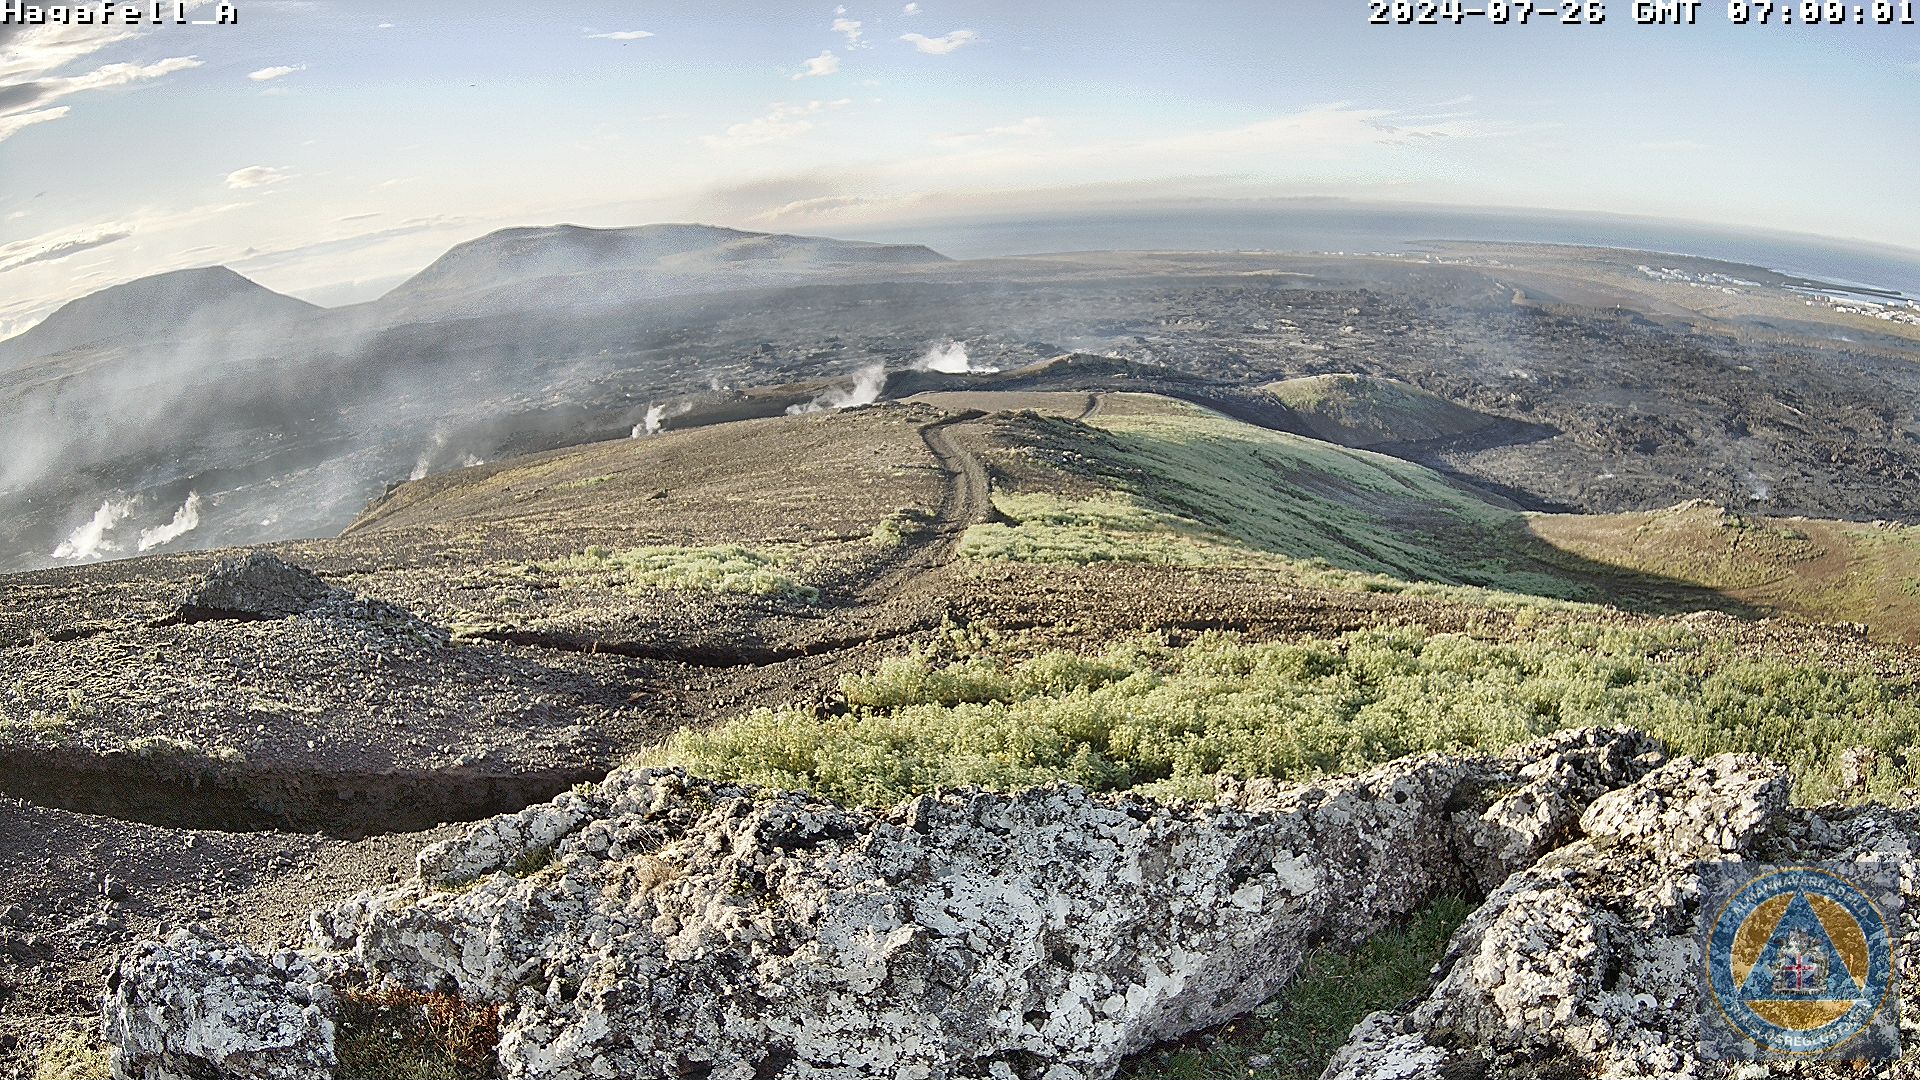
Iceland , Reykjanes Peninsula :
Geophysical measurements show similar trend as prior to the last eruption on the Sundhnúkur crater row
Seismic activity in the area has increased in recent weeks
Updated 13 August at 14:00 UTC
Deformation and seismic activity are similar as prior to the last eruption on the Sundhnúkur crater row
The volume of magma beneath Svartsengi is estimated to be just over 20 million cubic metres
Seismic activity in the area has increased in the last few weeks. About 60-80 earthquakes per day are detected
Hazard assessment is unchanged from last week and is valid until 20 August, barring any developments
Deformation signals and seismic activity show similar patterns as prior to the last eruption on the Sundhnúkur crater row. Model calculations also suggest that the volume of magma beneath Svartsengi is now estimated to be greater than it was prior to the last eruption, which started on 29 May. Prior to the onset, land uplift and magma accumulation continued for two weeks until an eruption started. It can thus be assumed that magma propagation and a volcanic eruption can start at any time, but based on previous occurrences it may be delayed.
Seismic activity in the area has increased in recent weeks and development is similar as before the previous magma propagations and volcanic eruptions. The last seven days have been similar, with about 60-80 earthquakes detected per day in the area between Stóra-Skógfell to Grindavík. Most of the earthquakes are at depths between 2-4 km, the shallowest in the area between Stóra-Skógfell and Sýlingarfell.
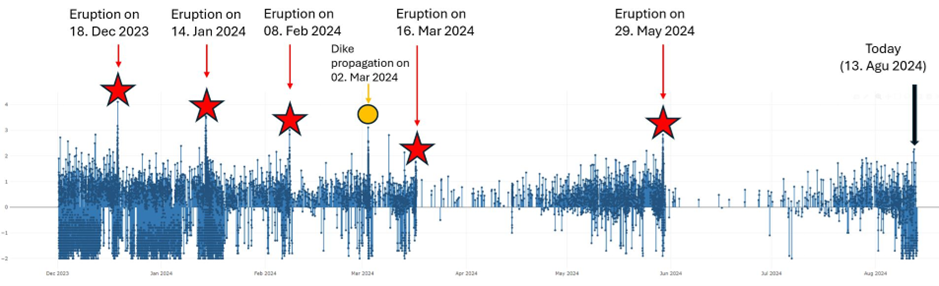
Seismic activity on the Sundhnúkur crater row since 1 December 2023 showing the patterns in seismic activity between eruptions and magma propagations.
Deformation data suggest that land uplift is ongoing but at slower rate. That indicates that magma pressure is increasing beneath Svartsengi. Model calculations estimate that over 20 million cubic metres of magma have been added to the magma reservoir beneath Svartsengi since the last eruption. This is similar to the observed trend which lead to the last magma propagations and volcanic eruptions, as shown in the graph.
Source : IMO
Photos : IMO
New Zealand , White Island :
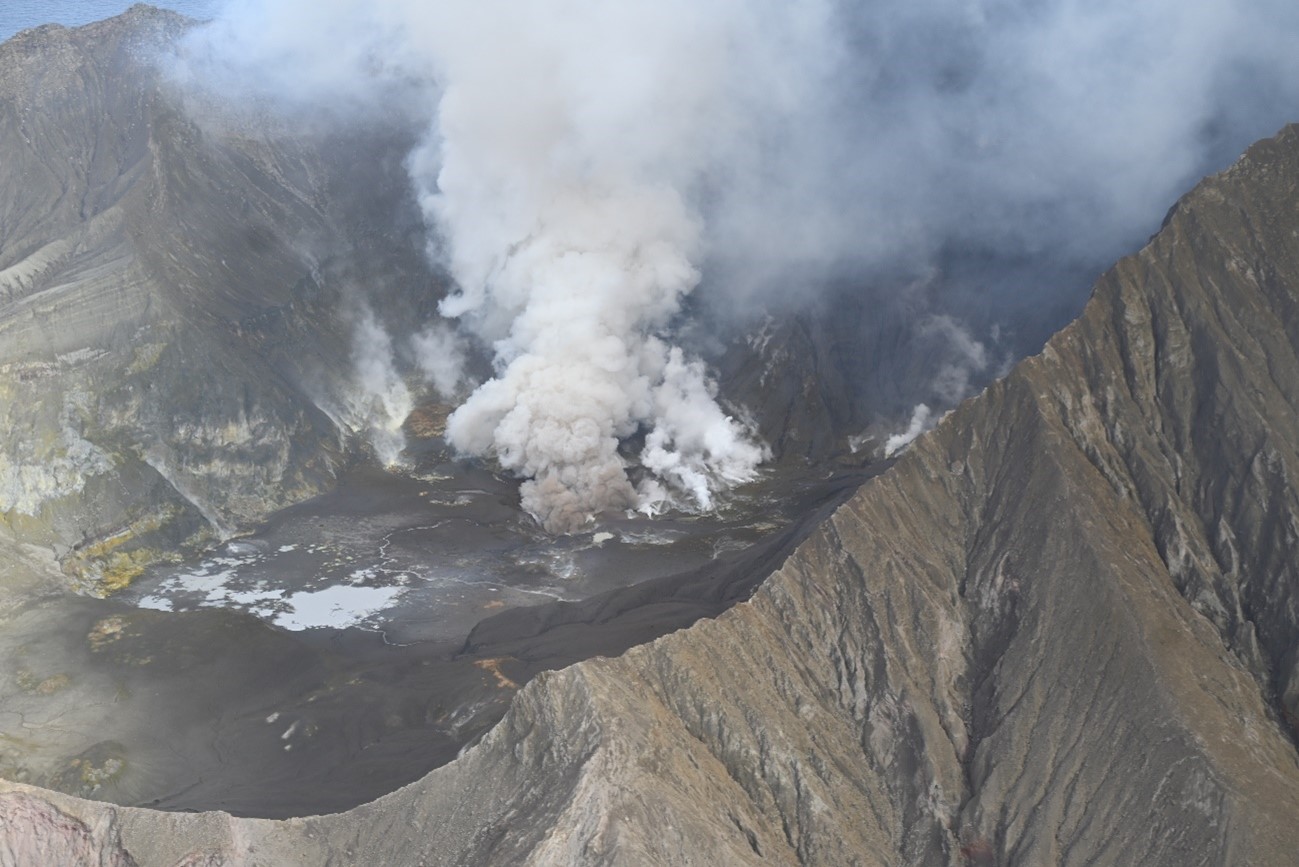
Minor ash emissions continue at Whakaari. Volcanic Alert Level remains at Level 3 and Aviation Colour Code remains at Orange.
Published: Wed Aug 14 2024 10:45 AM
Minor ash emissions continue at Whakaari during this period of minor eruption. Forecasts show a change in wind direction towards the mainland later today (14/08/2024), however there is a low likelihood of ash impacting the mainland. The Volcanic Alert Level remains at Level 3 (minor eruption) and the Aviation Colour Code remains at Orange.
Since our last Volcanic Activity Bulletin on Monday (12th August 2024), we have continued to observe low-level volcanic plumes containing minor amounts of volcanic ash being emitted from the active vent at Whakaari. We are using satellite imagery from the Wellington Volcanic Ash Advisory Centre (MetService) and the GeoNet webcams at Whakatane and Te Kaha for these observations. Southerly winds have transported the plumes to the north, away from the mainland.
The wind direction later today (14th August 2024) is forecast to change from a moderate southwesterly to a very light westerly. Given the current minor ash emissions from Whakaari at this time, this means there is a low likelihood of ash impacting the eastern Bay of Plenty.
We will continue to closely monitor volcanic activity at Whakaari with remote cameras and satellite imagery, and we are conducting gas and observation flights when weather conditions allow. Without an on-island monitoring network, changes in activity could occur at short notice and changes in Volcanic Alert Level may be delayed depending on monitoring conditions. We will provide updates when information becomes available.
Source : Geonet / Ery Hughes (she/her) Duty Volcanologist
Photo : Geonet ( 12 /07/ 2024)
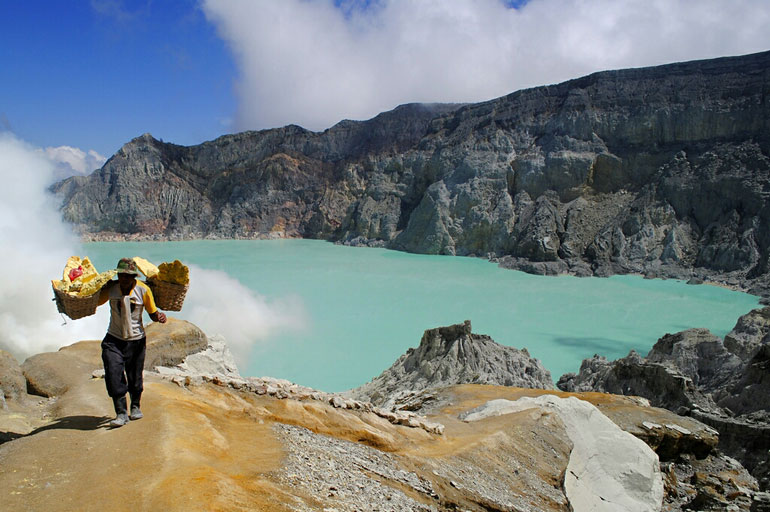
Indonesia , Kawah Ijen :
Reduced Gunung Ijen activity level from Level II (Waspada) to Level I (Normal).
Below, the results of the assessment of the activity of the Ijen volcano until August 13, 2024 are presented as follows:
Visual and instrumental observation
Visual
Between August 1 and 12, 2024, the water in the crater is turquoise green, there is no gas plume visible in the middle of the lake, there are fewer sulfur grains and there are no white vapor visible above the surface of the lake. The results of measuring the temperature of the crater water on the surface were 43.40°C using a thermocouple, while using a heat gun it was 42.20°C . There is thick, white smoke from the solfataras with low to moderate pressure. We can smell the sulfurous gas but it is not too strong. The distance between the lock/dam and the water of the LK crater lake. 15.3 meters.
Instrumental
Between August 1 and 12, 2024, 7 emissions earthquakes were recorded, 1 non-harmonic earthquake, 60 shallow volcanic earthquakes, 3 deep volcanic earthquakes, 16 deep tectonic earthquakes, 11 continuous tremors with an amplitude of 0.5 to 6 mm, dominant value of 1 mm.
Assessment and potential hazards
Increased activity in Ijen Crater is often marked by a change in the color of the crater lake water from green to whitish green due to the rise of sediment from the lake floor to the surface due to the high pressure of the gas coming from the bottom of the lake. The temperature of the crater water will also generally increase with increasing pressure/concentration of gas coming out of the lake floor, so plumes of gas will appear on the surface of the crater. In several incidents, increased activity at Ijen Crater was often accompanied by a « C02 explosion » or an eruption/explosion of dominant C02 gas originating from Ijen Crater.
The increase in activity in July 2024 was preceded by a decrease in the value of the seismic velocity variation (dv/v) since April 2024 which was interpreted as being linked to an increase in pressure on the body volcanic, also initiated by the continuous movement of increasing intensity with increasing intensity of the Tremor and increase in the amplitude of volcanic earthquakes. Tremor energy continues to increase, marked by an increase in tremor amplitude until exceeding scale on July 12, 2024. During the period July 13–20, 2024, the seismic frequency range s ‘widens between 0.5 and 12 Hz, marked by an increase in deep volcanic intensity (VA). , shallow volcanic earthquakes (VB) and seismic swarms which again indicate an increase in pressure.
Since July 23, 2024, the frequency range of earthquakes has started to decrease, mainly between 2 and 4 Hz, marked by a fluctuating decrease in the incidence/number of earthquakes and a decrease in the amplitude of earthquakes. tremors. After July 13, 2024, the RSAM chart shows a fluctuating downward trend close to normal. The seismic velocity variation value (dv/v) is at a positive value with large fluctuations indicating that the pressure on the volcanic body has decreased.
The visual monitoring results for the period from August 1 to 12, 2024, the water color of the crater gradually returned to normal, namely turquoise green, gas bubbles were not visible, flakes of Sulfur was reduced and white vapor was not visible on the surface of the lake. Similarly, the number of emissions earthquakes, shallow volcanic earthquakes, and deep volcanic earthquakes during the same period decreased quite significantly, indicating that fluid input/ Magmatic gas coming from the bottom of the lake has decreased.
The potential danger that may arise from the volcanic activity on Mount Ijen currently is the high concentration of volcanic gases around the crater originating from solfatarian activity on the walls of the Ijen crater and also the diffusion of volcanic gases from within the crater. crater towards the surface. ; and phreatic eruptions in the form of gas bursts from the crater lake. Phreatic eruptions can occur without being preceded by an increase in visual or seismic activity.
Conclusions and recommendations
Based on the results of visual and instrumental assessments, the activity level of Mount Ijen was lowered from level II (Waspada) to level I (normal) as of August 13, 2024 at 1:00 p.m.
Source : PVMBG
Photo : Author and date unknown