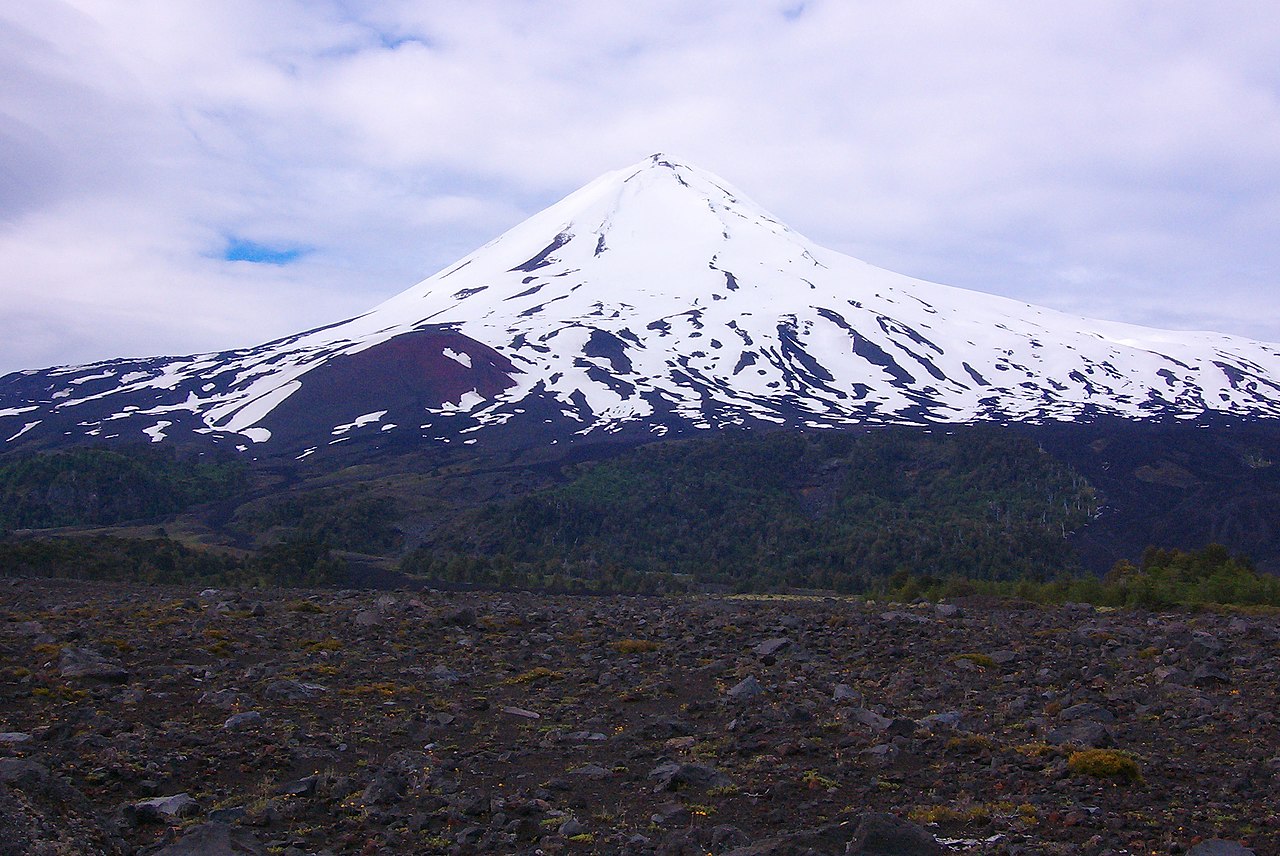
October 04 , 2017.
llaima , Chile :
Special volcanic activity report (REAV)
Region of La Araucana. 02 October 2017.18: 50 hours (local time).
The National Service for Geology and Mining (Sernageomin) announces the following information obtained from the monitoring teams of the National Volcanic Surveillance Network, processed and analyzed at the Southern Andes Volcanological Observatory:
Since Sunday 01 October at 9:00 GMT, the seismic recordings have recorded a series of LP-type low frequency signals (events commonly associated with fluid dynamics within the volcanic system), of regular form, with values of reduced displacements (DRc) equal to or less than 1.0 cm2, values considered to be low. This type of seismicity had not been recorded during the last years of monitoring, becoming quantitatively and qualitatively important. At the time of publication of this report, approximately 600 earthquakes were recorded with the characteristics described.
Other monitoring parameters such as deformation and geochemistry remained stable throughout this period. The climatic conditions did not allow to visualize the upper part of the volcanic edifice.
Although the seismicity parameters suggest a change in the behavior of the activity, the accumulated released energy remains low, so that the technical alert is maintained at:
GREEN LEVEL: Active volcano with stable behavior – No immediate risk – Time for a possible eruption: MONTH / YEAR.
The Sernageomin will continue with on-line monitoring and inform in a timely manner of possible changes in volcanic activity in the region.
Source : Sernageomin
Photo : fine art america ( Martin Rietze )
Misti , Peru :
Seismic monitoring:
The seismic activity in the Misti volcano remains low.
The complex LF seismicity (double events related to fracturing and fluid pressure) increased by 72% compared to the previous period. This activity recorded 4 LF events per day with a maximum occurrence of 27 earthquakes. However, the occurrence rate observed and the energy generated are at low levels.
Volcano-tectonic (VT) seismic events, related to rock fracturing, have also decreased compared to the previous period. During this fortnight, 32 earthquakes per day were recorded, representing a reduction of up to 27% in the number of events. However, these values are considered « normal » in the seismic activity of Misti. In addition, the energy values of the VT-type events are maintained at low levels.
Satellite Surveillance:
Thermal anomalies: The MIROVA system (www.mirova.unito.it) of the University of Turin (Italy) has not detected thermal anomalies on the Misti volcano for this period (VPR = 0 Megawatts).
Anomalies SO2: The GSO-NASA satellite system « EOS Aura » (http://so2.gsfc.nasa.gov/) did not record any significant anomalies in the SO2 gas density for the Misti volcano.
ONCLUSIONS
Misti volcanic activity remains low.
Although the activity of LF-type complex events increased slightly with the recording of 4 earthquakes per day, they exhibited a low occurrence rate. In addition, VT seismicity decreased consecutively for 30 days. During this period, 32 events were reported per day.
Any changes will be reported in a timely manner.
Source : IGP
Yellowstone , United States :
44°25’48 » N 110°40’12 » W,
Summit Elevation 9203 ft (2805 m)
Current Volcano Alert Level: NORMAL
Current Aviation Color Code: GREEN
Seismicity
During September 2017, the University of Utah Seismograph Stations, responsible for the operation and analysis of the Yellowstone Seismic Network, reports 115 earthquakes were located in the Yellowstone National Park region. The largest event was a minor earthquake of magnitude 3.2 on September 16, at 11:38 PM MDT, located about 11 miles south of Old Faithful, WY. The earthquake was reported felt in Yellowstone National Park.
September seismicity in Yellowstone was marked by the ongoing seismic swarm ~six miles north of West Yellowstone, MT. Activity in that swarm has waned, with 78 locatable earthquakes compared to the 894 in August, 475 in July, and 1028 in June. The largest event of the swarm in September occurred September 03, at 6:59 PM MDT (magnitude 2.3) ten miles north of West Yellowstone, MT. Swarm activity for September consists of four earthquakes in the magnitude 2 range. Including the events from the prior three monthly reports beginning on June 12, total swarm seismicity includes one earthquake of magnitude 4.4, 12 in the magnitude 3 range, and 185 earthquakes in the magnitude 2 range. There are potentially several additional earthquakes visible on the webicorders that cannot be located because they are too small or overlap another event and are not included in these numbers.
No other swarm seismicity was observed in Yellowstone during the month of September.
Earthquake sequences like that occurring north of West Yellowstone, MT, are common and account for roughly 50% of the total seismicity in the Yellowstone region.
Following several months of elevated seismicity, Yellowstone earthquake activity has returned to normal levels compared with typical background activity.
Ground deformation
Trends in ground displacement have remained consistent over the past several months. Uplift north of the caldera, centered near the Norris Geyser Basin and persistent since late 2015, continues at a low rate (a few millimeters per month). Subsidence within the caldera is occurring at a similar rate and has been ongoing since late 2016. Current deformation patterns at Yellowstone remain within historical norms.
An example of GPS data can be found at http://www.unavco.org/instrumentation/networks/status/pbo/data/WLWY (click on Static Plots / Cleaned)
The Yellowstone Volcano Observatory (YVO) provides long-term monitoring of volcanic and earthquake activity in the Yellowstone National Park region. Yellowstone is the site of the largest and most diverse collection of natural thermal features in the world and the first National Park. YVO is one of the five USGS Volcano Observatories that monitor volcanoes within the United States for science and public safety.
Source : YVO
Piton de la Fournaise , La Réunion :
seismicity:
In September 2017, the OVPF registered a total of:
• 19 superficial volcano-tectonic earthquakes (0-2 km deep) under the summit craters;
• no deep earthquakes (> 2 km deep);
• 909 collapses (in Crater Dolomieu, at the ramparts of the Enclos Fouque as well as at the eruptive site of July / August 2017);
• 28 local earthquakes (under the island, Piton des Neiges side);
• 2 regional earthquakes (in the Indian Ocean zone).
Following the phase of re-growth of the superficial volcanic-tectonic seismicity under the summit craters at the end of the eruption from 14 July to 28 August 2017 and until the end of August, seismicity decreased during the month of September to reach an average of less than one event per day (Figure 1).
Figure 1: Histogram representing the number of superficial volcano-tectonic earthquakes recorded in the summit craters between 1 August and 30 September 2017. (© OVPF / IPGP)
Deformation:
Following the inflation (swelling) phase observed during the eruption from 14 July to 28 August 2017, no significant deformation was recorded (Figure 2).
Figure 2: Illustration of the deformation in the last twelve months (the eruptions of January 31-February 27, 2017 and July 14-August 28, 2017 are shown in yellow and the magma injection of May 17, 2017 is represented by a bar black). Here is shown a baseline (distance between two GPS receivers) crossing the Dolomieu crater from north to south (in black the raw data, in blue the smoothed data over a week). A rise is synonymous with elongation and therefore swelling of the volcano; conversely, a decrease is synonymous with contraction and thus with deflation of the volcano. (© OVPF / IPGP)
Gas Geochemistry
– Emissions of SO2 and H2S in the air at the top are below the detection threshold.
– The CO2 concentrations in the soil measured at the remote stations of the Plaine des Cafres and at the level of the Gîte du volcan show intermediate values (Figure 3).
Figure 3: CO2 concentration in the soil at the level of the volcano deposit between September 2016 and September 2017 (eruptions of September 11-18, 2016, January 31-February 27, 2017 and July 14-August 28, 2017 are shown in red , and the magma injection of May 17, 2017 is represented by a gray bar). In blue, the raw data, in red, the data corrected for the effects of temperature. Values are normalized to the maximum value. (© OVPF / IPGP)
Source : OVPF
Photo : Laurent Perrier
Sinabung , Indonesia:
VOLCANO OBSERVATORY NOTICE FOR AVIATION – VONA
Issued:20171004/0457Z
Volcano: Sinabung (261080)
Current Aviation Colour Code: ORANGE
Previous Aviation Colour Code: orange
Source: Sinabung Volcano Observatory
Notice Number: 2017SIN564
Volcano Location: N 03 deg 10 min 12 sec E 98 deg 23 min 31 sec
Area: North Sumatra, Indonesia
Summit Elevation: 7872 FT (2460 M)
Volcanic Activity Summary:
Eruption with ash clouds at 04:50 UTC (11:50 local time). The eruption lasted for 130 seconds.
Volcanic Cloud Height:
Best estimate of ash-cloud top is around 18944 FT (5920 M) above sea level, may be higher than what can be observed clearly. Source of height data: ground observer.
Other Volcanic Cloud Information:
Ash cloud is moving to East-Northeast
Remarks:
Seismic activity is characterized by the Deep Volcanic Earthquake, Low Frequency Earthquake, and Hybrid Earthquake. Rock avalanche (Incandescent lava) is not identified.
Level of activity : level 4 (AWAS). The Sinabung (2460 m above sea level) from yesterday until this morning was observed clearly until the fog came. A low white emission of the crater is observed at a height of 50 to 200 m above the peak. Thanks to seismographs and visual recordings, there were no recorded eruption. There were recorded 65 hot clouds, observed visually to slip up to 500-1500 m to the South, South-East and East.
Dams in the Laborus River, formed by the accumulation of hot cloud deposits, can still cause lahars or floods if the dam collapses.
recommendations:
Communities / visitors should not engage in activities within a radius of 3 km around the peak, and by sectors, less than 7 km south-south-east, 6 km south-east 4 km East-North.
Source : VSI / Magma .
Photo : Sadrah Peranginangin