March 4 , 2026.
La Réunion Island , Piton de la Fournaise :
Press release from the Paris Institute of Earth Physics / Piton de la Fournaise Volcanological Observatory, March 4, 2026 – 9:00 AM local time – 5:00 AM UTC
Eruption in progress
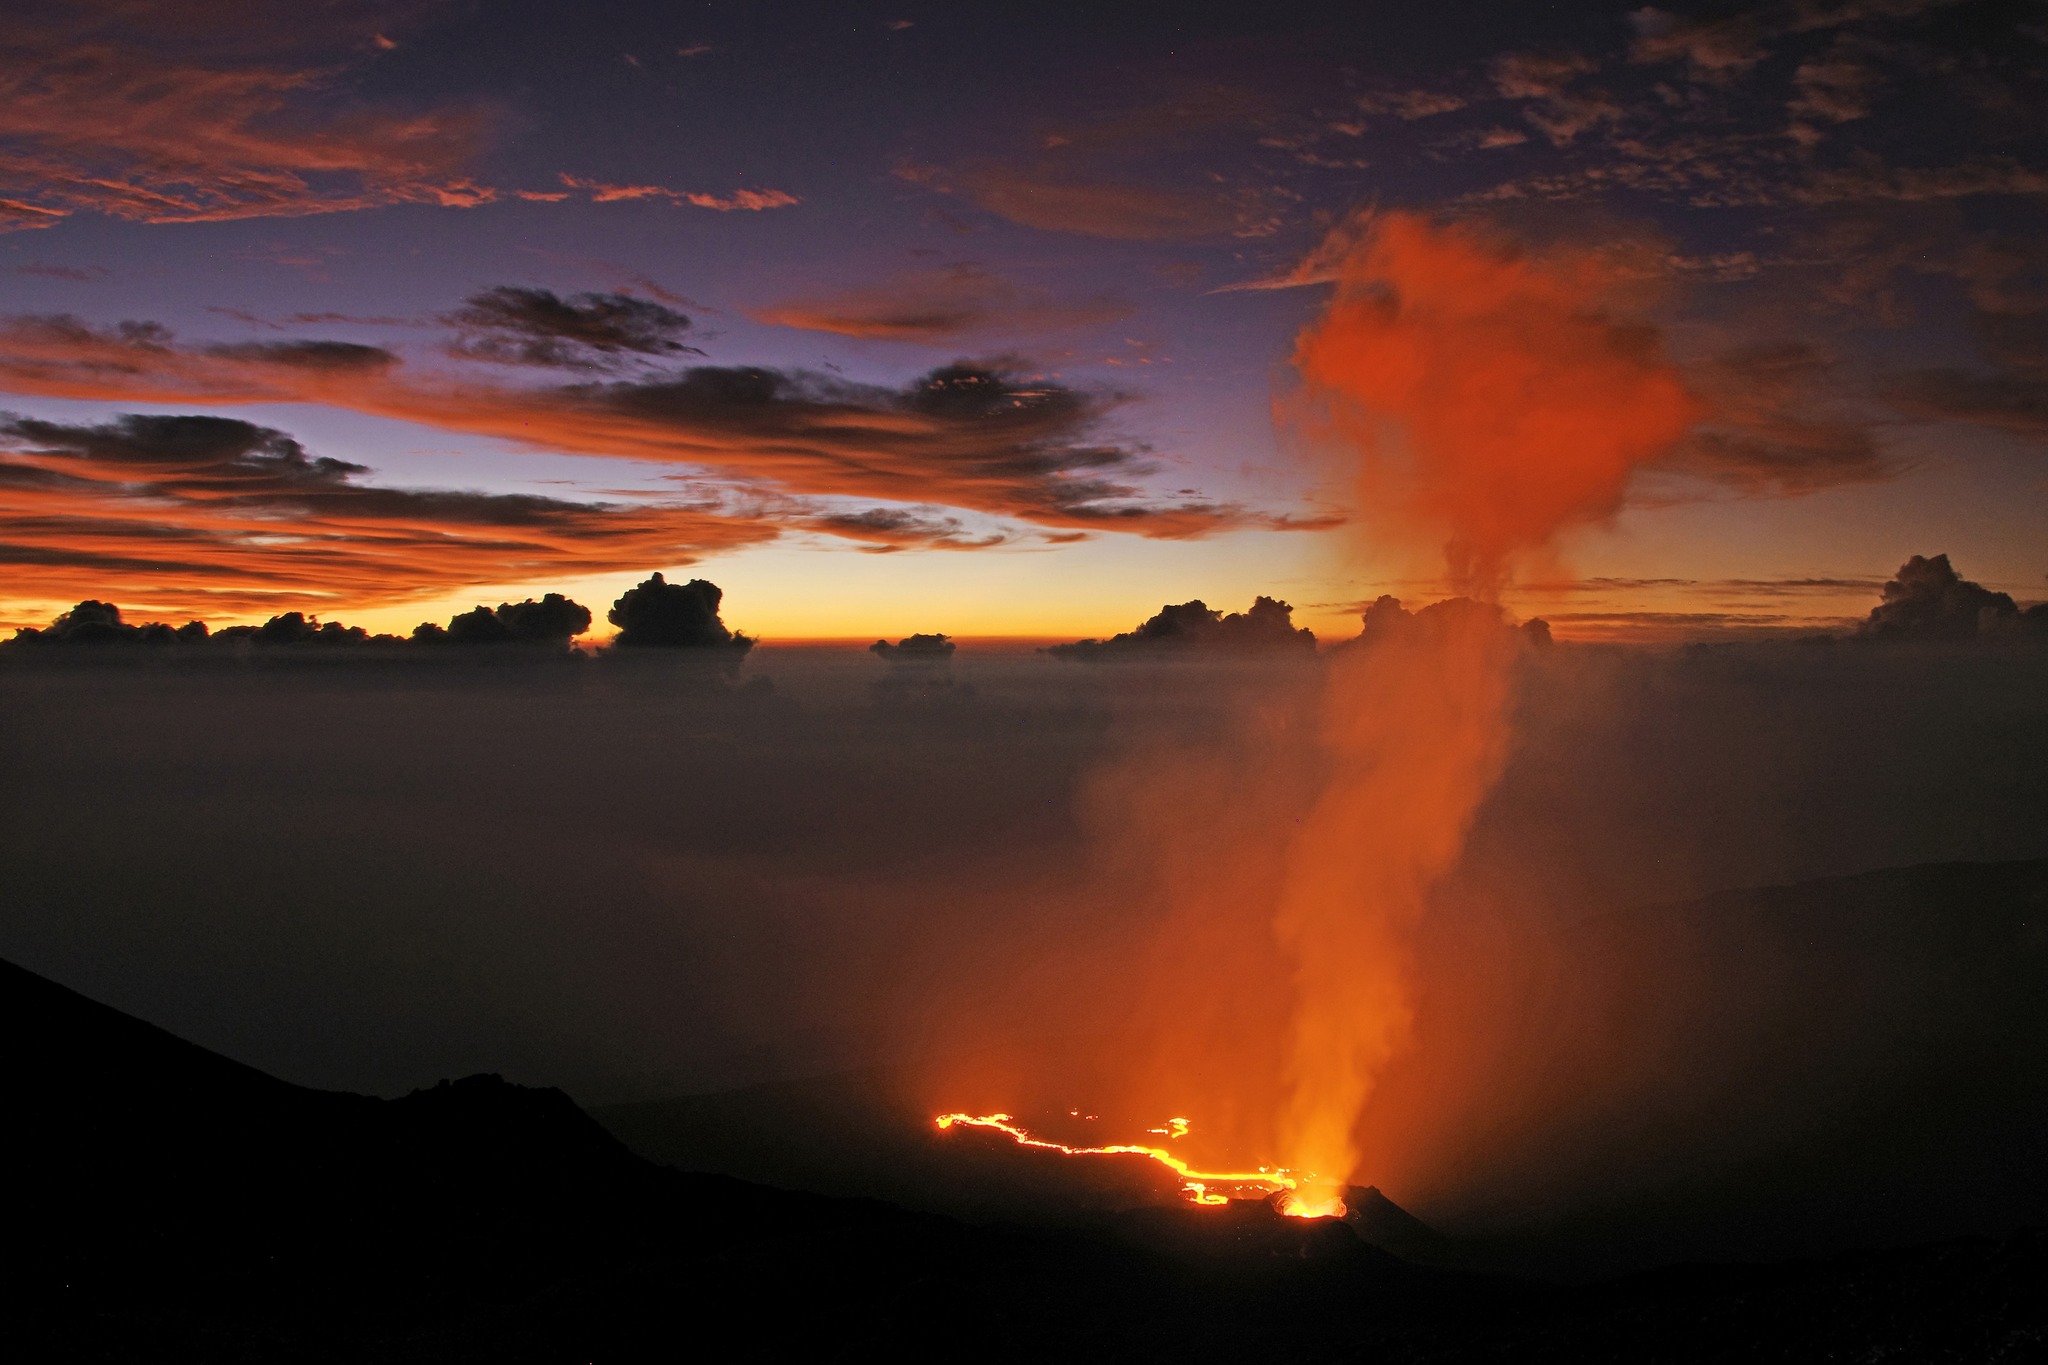
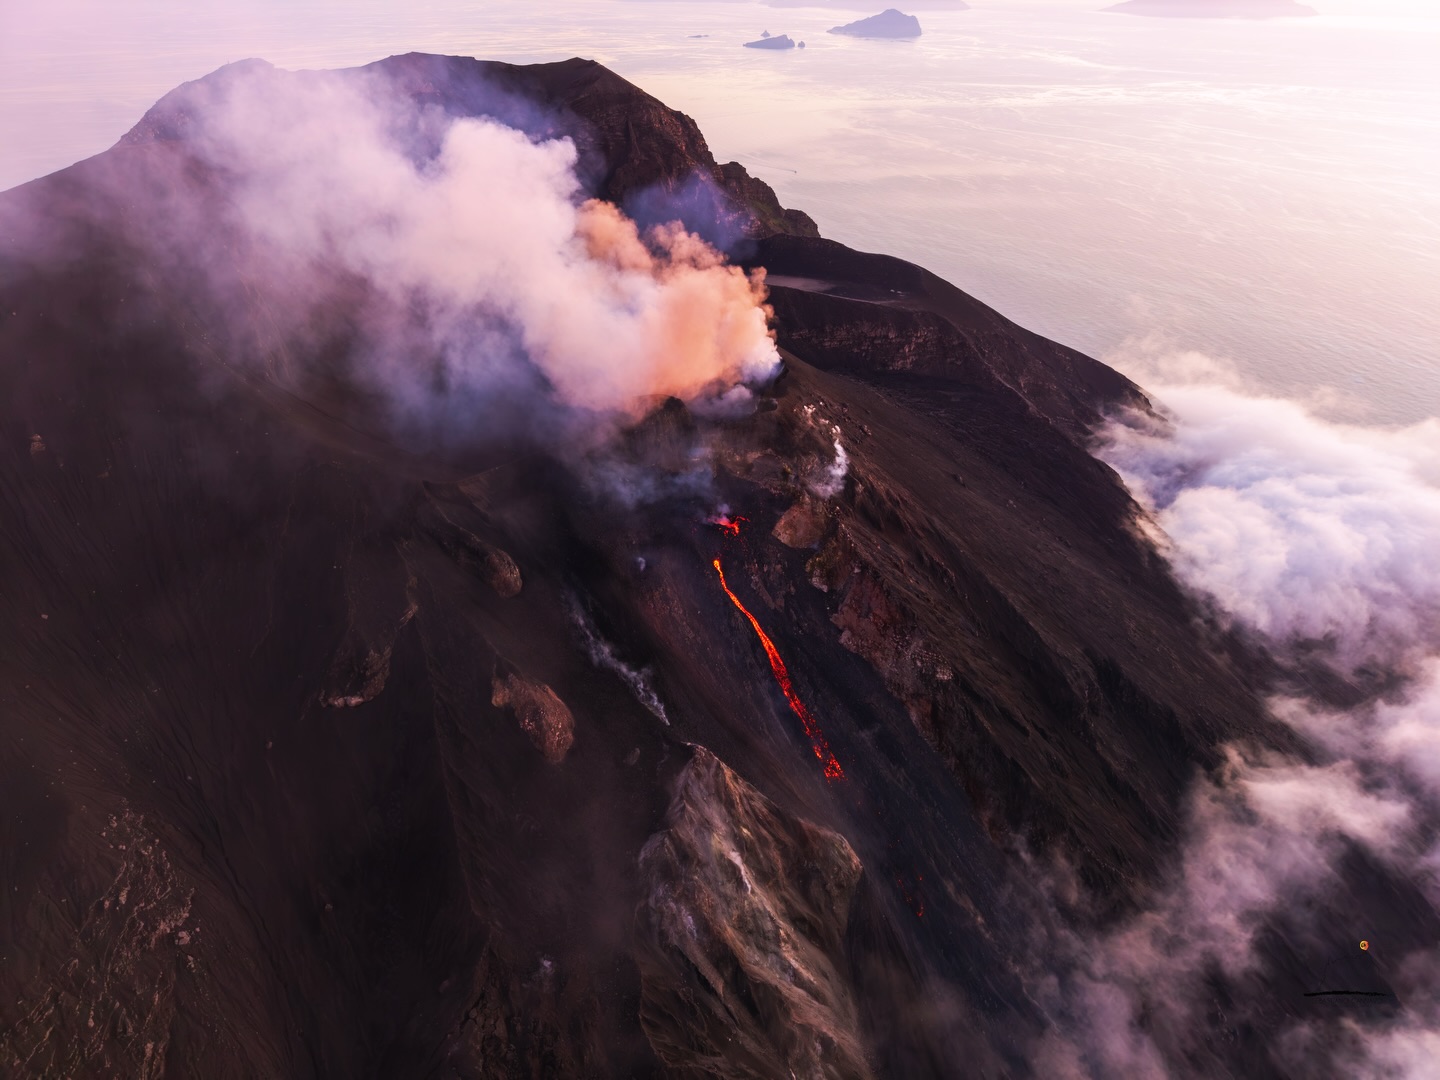
The eruption that began on February 13, 2026, shortly after 10:00 AM (local time), at Piton de la Fournaise continues.
Only one eruptive site remains active on the south-southeast flank of the volcano, with fountains still visible from Piton de Bert. A cone is being built by the progressive accumulation of lava flows. It is now closed laterally.
With the lateral closure of the cone, significant lava tube activity is now established downstream of the cone. The lava flow resurgences and active above-ground sections are concentrated mainly downstream of the eruption site and upstream of the Grandes Pentes fault, where the lava field widens and thickens. Last night, a new flow arm (slightly further south than the branch of the flow that has stalled in the Grandes Pentes) crossed the Grandes Pentes fault and was visible in the upper part of the Grandes Pentes. This morning, this flow arm was much less active.
In the Grandes Pentes, the lava flow front remains stalled approximately 2.6 km from National Route 2 and at an altitude of 660 m.
As in previous days, seismic activity remains low.
The resumption of inflation of the volcano, visible on the summit and base GNSS stations, is confirmed, even though the data has fluctuated over the last few days (Figure 2). This inflation remains low for the time being and would indicate a slight repressurization of the magma supply system, possibly linked to magma recharge from the shallow reservoir.
Over the last 24 hours, eruptive tremor (an indicator of lava and gas emissions at the surface) has remained relatively stable and of low amplitude. In the long term, a gradual increase in tremor amplitude has been observed since February 21st, with small variations. Amplitude peaks are still being recorded and are probably linked to variations in degassing or morphological changes in the eruptive cone. Surface flow rates, estimated from satellite data via the HOTVOLC platform (OPGC – Clermont Auvergne University), have indicated values between 1 and 12 m³/sec over the past 24 hours. It should be noted that these estimates can vary rapidly depending on cloud cover and become zero in the event of total cloud cover.
Surface lava flow rates, estimated from satellite thermal data, generally agree with those calculated from SO₂ fluxes measured by the NOVAC stations of the OVPF (Volcanological Observatory of Piton de la Fournaise) installed around the perimeter of the Enclos Fouqué caldera. The observed differences are related to the geometry of the plume and the meteorological conditions.
Estimating surface lava flow rates allows us to track the volume of lava emitted at the surface; thus, since the beginning of the eruption, approximately 10 million m³ of lava have been emitted at the surface.
Source : OVPF/IPGP
Photo : Christian Holveck / FB.
Italy , Stromboli :
WEEKLY BULLETIN, February 23, 2026 to March 1, 2026. Publication date: March 3, 2026
ACTIVITY SUMMARY
Based on monitoring data, the following points should be noted:
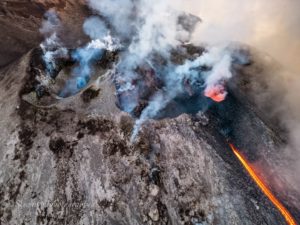
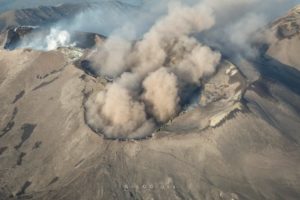
1) VOLCANOLOGICAL OBSERVATIONS: During the reporting period, ordinary Strombolian-type eruptive activity was observed, associated with four episodes of effusive lava flow from the North Crater area. The total hourly frequency fluctuated between average (13 events/h) and high (19 events/h). The intensity of the explosions was primarily low to medium in the North and Central-South Crater areas.
2) SEISMOLOGY: The monitored seismic parameters showed no significant variation.
3) GROUND DEFORMATION: The GNSS network showed no significant variation. The tilt network is not operational.
4) GEOCHEMISTRY: SO2 flux at an average level.
CO2 flux from the ground in the Pizzo area (STR02) at high values.
C/S ratio in the plume at average values.
Helium isotope ratio (R/Ra) dissolved in the thermal aquifer: No update. Last data: December 2, 2025, at high values (4.44).
CO2 flux from the ground in the San Bartolo area: at high to very high values.
5) SATELLITE OBSERVATIONS: The thermal activity observed by satellite in the summit area was generally moderate, consistent with the eruptive activity of February 25 and 27 and March 1, 2026.
VOLCANOLOGICAL OBSERVATIONS
During the period under review, Stromboli’s eruptive activity was characterized by the analysis of images recorded by the INGV-OE monitoring cameras located at 190 m (SCT-SCV) and at Punta dei Corvi (SPCT). Explosive activity was primarily produced by five eruptive vents located in the northern zone of the crater and by at least two vents located in the south-central zone. On February 23, 25, and 27, as well as on March 1, 2026, four small lava flows were observed in the northern zone of the crater.
Observations of explosive activity captured by the monitoring cameras
In the northern (N) zone of the crater, five active vents were observed, two in sector N1 and three in sector N2. These craters produced explosive activity of low (less than 80 m high) and medium intensity (less than 150 m high) intensity. The eruptive products were primarily coarse materials (bombs and lapilli). The average frequency of explosions ranged from 12 to 16 events per hour. In the Central-South Crater (CS) area, two main vents were observed, which exhibited explosions of fine material mixed with coarse material, ranging from low to medium intensity. The average frequency of explosions ranged from less than 1 to 5 events per hour.
Effusive lava overflow activity on February 23, 25, and 27, and March 1, 2026.
During the observation period, four lava overflow episodes occurred, originating from the southern vent in the N2 sector of the North Crater area. These episodes extended over a distance of several hundred meters from the point of origin, in the upper part of the Sciara del Fuoco. The duration of each episode may be uncertain due to cloud cover. The first of these overflows began in the early hours of February 23, although the exact time could not be determined due to cloud cover, and ended in the early hours of February 24. The second overflow began in the early hours of February 25 and ended in the evening of the same day. The third overflow began in the early afternoon of February 27 and ended in the evening of the same day. The fourth and final overflow began in the morning of March 1 and ended late in the evening of March 2.
Source : INGV.
Photo : Stromboli stati d’animo / Sebastiano Cannavo .
Iceland , Reykjanes Peninsula :
Magma accumulation beneath Svartsengi approaches 23 million cubic meters since the last eruption .
Updated 3 March
A magma intrusion and eruption along the Sundhnúkur crater row remains the most likely scenario
A prolonged pause in eruptions is not a clear indication that the eruptive episode has ended
The Icelandic Meteorological Office is revising scenario assessments
Hazard assessment unchanged and valid until 31 March
Land uplift and magma accumulation continue at a similar rate as in recent weeks; magma inflow is slow but steady. According to model calculations, approximately 22.5 million cubic meters of magma have now accumulated beneath Svartsengi since the last eruption in July last year.
Scenario assessments under review
Magma has been accumulating beneath Svartsengi for around 210 days, making this the longest continuous accumulation period since the eruptive episode along the Sundhnúkur crater row began in December 2023.
If magma accumulation continues at the same rate, it can be expected that by next week the total volume of magma accumulated since the last eruption will be the largest recorded between eruptions since the start of the eruptive episode.
The large volume of magma and the length of the accumulation period call for further analysis of the possible development of volcanic activity. The Icelandic Meteorological Office is currently revising its scenario assessments for possible developments, and these will be presented in the coming weeks.
It should be noted that a prolonged pause in eruptions is not a clear indication that the eruptive episode at the Sundhnúkur crater row has ended.
Seismic activity
Low seismic activity continues to be recorded above the magma intrusion. Seismic activity near Vík has decreased.
Hazard assessment
The Icelandic Meteorological Office’s hazard assessment remains unchanged, and its validity has been extended until 31 March. The Office continues to monitor developments closely and will update the hazard assessment if there are changes in activity.
Source et photo : IMO
Indonesia , Lewotobi Laki-laki :
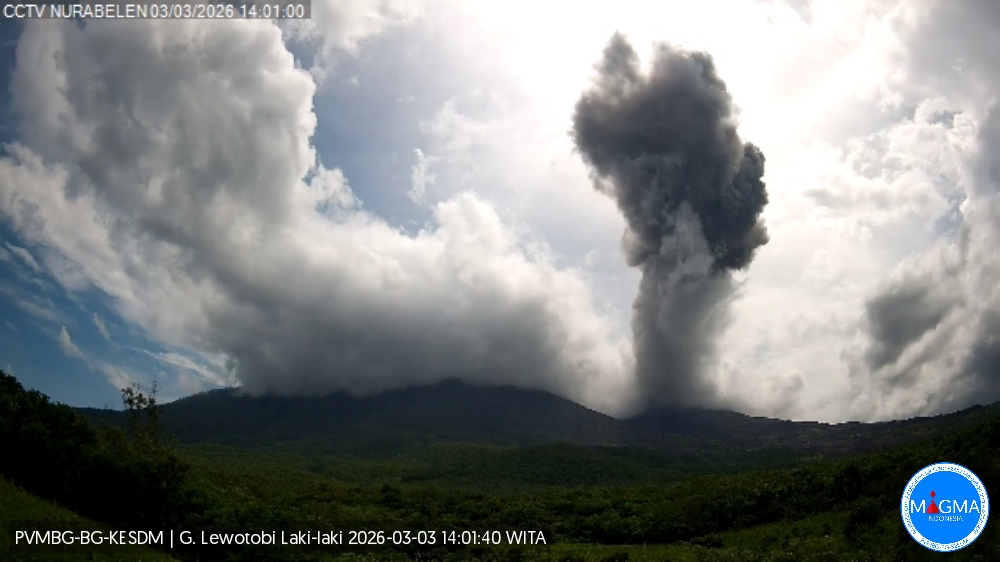
ERUPTION OF LEWOTOBI LAKI-LAKI VOLCANO ON MARCH 3, 2026
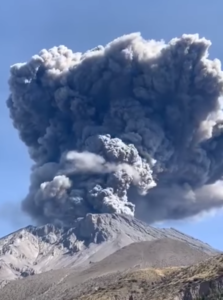
On March 3, 2026, between 9:42 a.m. and 1:55 p.m. (Central Indonesian time), an eruption was observed from the crater of Mount Lewotobi Laki-laki, according to CCTV footage from the Nurabelen observation post. A gray to dark gray eruptive column rose vertically with moderate intensity. Visually, this column reached a height of 1,000 to 1,500 meters above the summit.
Prior to the eruption, seismic activity was dominated by:
Non-harmonic tremors with daily fluctuations.
An increase in low-frequency (LF) earthquakes recorded by several stations.
Deep seismic activity (VA) was low and showed no upward trend. Shallow volcanic activity (VB) was not observed during the previous assessment period.
The seismicity profile indicates the predominance of shallow fluid dynamics. No pattern of increased volcanic activity (VA) and the onset of shallow volcanic activity (VB), characteristic of magmatic migration to the surface zone, was observed. Therefore, this eruption is more consistent with a gas eruption than with a large magmatic intrusion.
Tilt-axis data from stations NUR and WLR2, prior to the event, showed no signs of swelling.
At Nurabelen, the Y-axis did not show any significant increase indicating swelling.
At WLR2, no increase in the Y-axis or any movement away from the summit, signs of increased surface pressure, were observed.
Overall, deformation showed a stable to weakly deflationary trend.
GNSS data up to the end of February 2026 did not indicate significant vertical uplift. The vertical component was generally stable to weakly deflationary, and the horizontal component did not show any radial structure from the center of activity. The absence of swelling due to deformation indicates that no new magmatic pressure accumulated prior to the eruption.
Based on visual, seismic, and deformation observations, the eruption of March 3, 2026, was most likely triggered by the accumulation of surface gas pressure in a conduit system opened after the previous eruption. The increase in low-frequency earthquakes in February 2026 indicates heightened fluid activity, which subsequently led to the release of pressure in the form of an eruption. No signs of significant magmatic intrusion were observed prior to the event, as evidenced by the absence of shallow and deep volcanic earthquakes, as well as the lack of swelling in the deformation data. Furthermore, increased vigilance and close monitoring of the risk of lahar flows during the rainy season are necessary.
Following these visual and instrumental analyses, the activity level of Mount Lewotobi Laki-laki remains at Level II (WASPADA). The following recommendations are issued: the public and tourists are advised to avoid all activity within a 4 km radius of the eruption’s epicenter, to remain calm, and to follow the instructions of local authorities. The public is also asked to disregard information from unknown sources.
Source et photo : PVMBG.
Colombia , Chiles / Cerro Negro :
San Juan de Pasto, March 3, 2026, 4:00 PM
Regarding the monitoring of activity at the Chiles-Cerro Negro Volcanic Complex (CVCCN), the Colombian Geological Survey (SGC), an agency under the Ministry of Mines and Energy, reports the following:
From February 24 to March 2, 2026, the main variations in monitored parameters compared to the previous week were as follows:
● Consistent with the fluctuating behavior characteristic of the volcanic complex, an increase was recorded in both the daily frequency and the seismic energy released. Seismicity related to rock fracturing remains predominant, followed by seismicity associated with fluid dynamics.
● Most of the earthquakes occurred southwest of the summit of Chiles Volcano, in an area approximately 3 km in diameter, at depths between 2 and 5 km below the summit (4,700 m altitude), and with magnitudes less than 2.0. A few earthquakes were located further south of Chiles, at a distance of up to 10 km, at a depth of 6 km, and with a maximum magnitude of 2.5. This earthquake was recorded on February 28. No tremors were reported.
● Analysis of data collected by satellite sensors and ground stations continues to reveal variations related to deformation processes in certain areas of the volcanic zone.
Based on the assessment and correlation of monitored parameters, the Geological Survey of Colombia (SGC) recommends closely monitoring its evolution through weekly bulletins and other information published on its official channels, as well as instructions from local and departmental authorities and the National Unit for Disaster Risk Management (UNGRD).
Volcanic activity remains at the yellow alert level: active volcano with changes in the baseline behavior of monitored parameters and other manifestations.
Source et photo : SGC.