Mach 7 , 2026.
La Réunion Island , Piton de la Fournaise :
Press release from the Paris Institute of Earth Physics / Piton de la Fournaise Volcanological Observatory, March 7, 2026 – 8:45 a.m. local time – 4:45 a.m. UTC
Eruption in progress
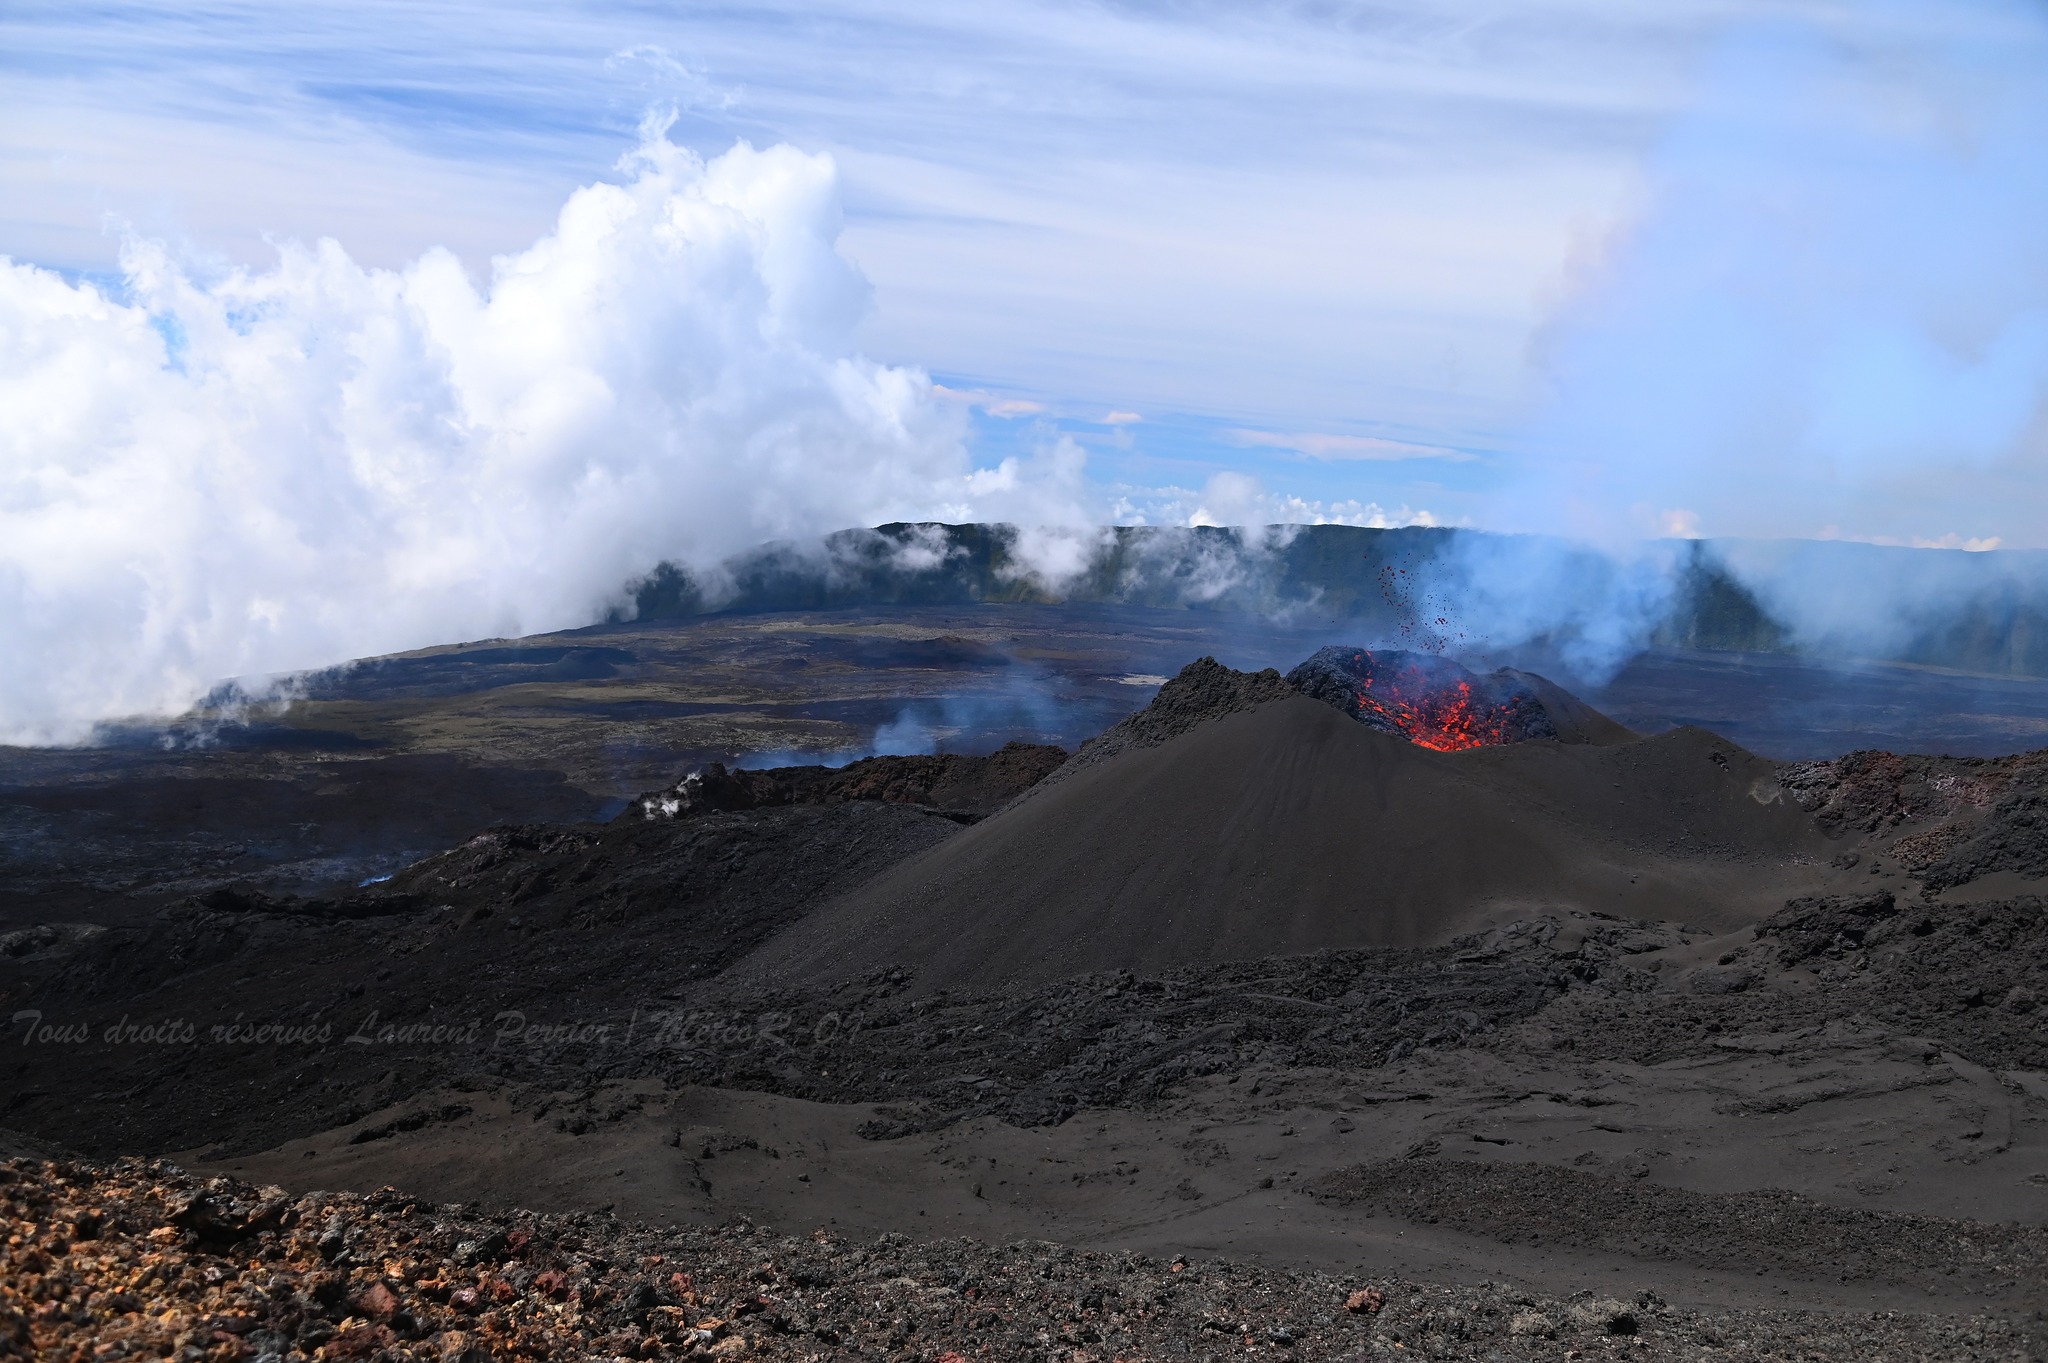
The eruption that began on February 13, 2026, shortly after 10:00 a.m. (local time) at Piton de la Fournaise continues.
Only one eruptive site remains active on the south-southeast flank of the volcano, visible from Piton de Bert. The eruptive cone is now well-formed and continues to close progressively. Few ejecta now rise above the height of the cone.
With the lateral closure of the cone, significant lava tube activity is now established. Since March 3, lava flows have been visible again in the upper part of the Grandes Pentes, with a new flow arm.
The front of the southern arm of the lava flow, currently visible from the RN2, was located on the morning of March 6th approximately 4 km from the national road 2, at an altitude of 1175 m. At the bottom of the Grandes Pentes, the front of the most downstream arm of the lava flow remains fixed at ~2.6 km from the national road 2, at an altitude of 660 m.
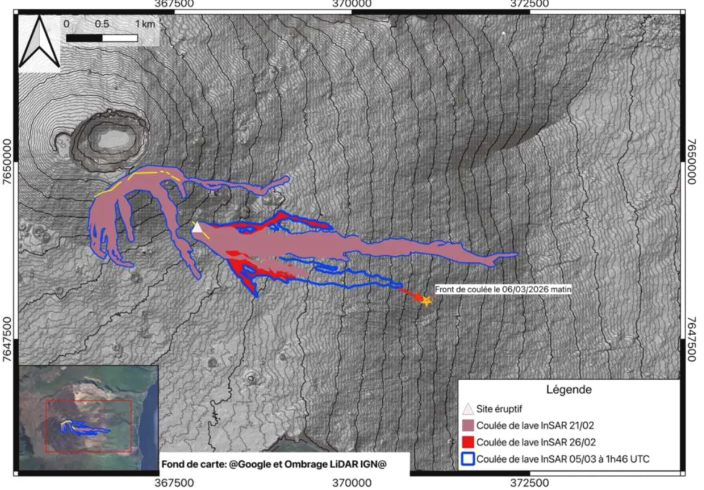
Map showing the evolution of the lava field up to March 5, 2026. The outlines were estimated from coherence maps calculated from interferograms. The position of the southern flow arm front – as of the morning of March 6 – is represented by a yellow star. Eruptive fissures are shown in yellow, and the current eruptive site by a white triangle (©OI2/ISDeform – OSUL, OPGP-LMV, University of Reunion Island, OVPF-IPGP).
As in previous days, seismic activity remains low.
The resumption of inflation of the edifice, visible in particular on the summit GNSS stations and at the base of the terminal cone, is now well established. Indeed, since the end of February, the baselines crossing the summit have recorded an increase in distance, indicating a progressive re-expansion of the edifice. This inflation indicates a repressurization of the magma supply system, possibly linked to magma recharge from the shallow reservoir.
Over the past 24 hours, eruptive tremor (an indicator of lava and gas emissions at the surface) has remained relatively stable. In the long term, the tremor amplitude has shown a gradual increase since February 21st. A few amplitude peaks are still being recorded, probably linked to variations in degassing or morphological changes in the eruptive cone.
Surface flow rates, estimated from satellite data via the HOTVOLC platform (OPGC – Université Clermont Auvergne), have indicated values between 1 and 15 m³/s over the past 24 hours. It should be noted that depending on cloud cover, these estimates can vary significantly and become zero in the event of total cloud cover.
Estimating surface lava flow rates allows us to monitor the volume of lava emitted at the surface. Thus, between March 13 and March 6, 2026, approximately 12 million m3 of lava were emitted onto the surface.
Summary
Since the end of February, GNSS data suggests inflation of the volcano. This development is thought to be linked to a repressurization of the magma supply system, possibly associated with a new phase of magma recharge in the shallowest reservoir.
Given the current low seismic activity, the probability of new eruptive fissures opening remains low in the short term.
Nevertheless, signs of repressurization increase this probability.
It should also be noted that in the past, eruptive fissures have opened during eruptions without warning signals, such as in August 1998, July 1999, October 1999, December 2006, and March 2019. Indeed, magma propagation at shallow depths can occur aseismically, particularly when the magma has already been degassed.
Alert Level 2.1
Source : OVPF / IPGP.
Photos : OVPF , Laurent PERRIER/ MétéoR Océan Indien/FB .
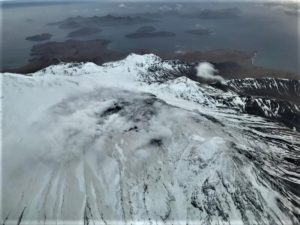
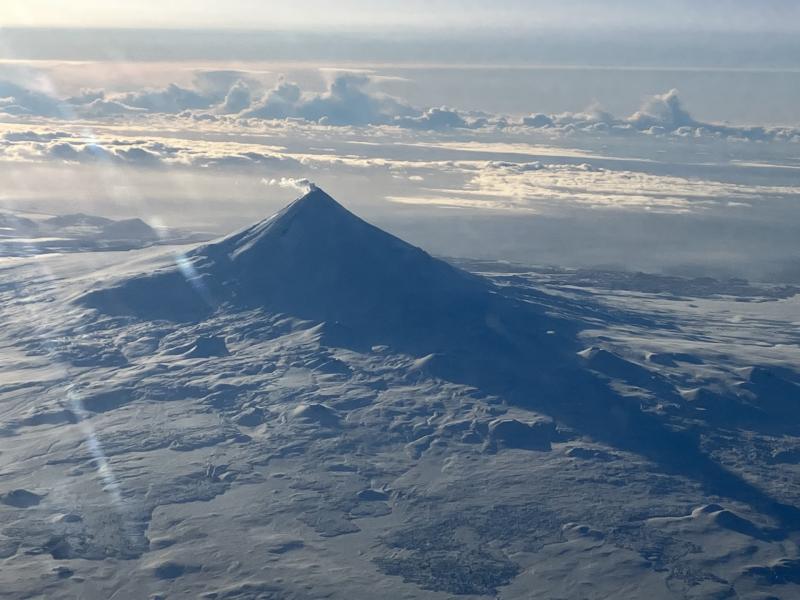
Alaska , Shishaldin :
Signs of volcanic unrest at Shishaldin Volcano continue. Seismic and infrasound activity remain elevated, with numerous small earthquakes, frequent infrasound signals, and intermittent volcanic tremor recorded throughout the week. Daytime web camera views consistently showed minor to vigorous steaming, and sulfur dioxide emissions were detected in satellite data from February 28 through March 3 and again today. Satellite observations on February 28 also showed slightly elevated surface temperatures near the summit, likely associated with hot gas emissions.
Shishaldin Volcano is monitored by local seismic and infrasound sensors, web cameras, and a telemetered geodetic network. In addition to the local monitoring network, the Alaska Volcano Observatory uses nearby geophysical networks, regional infrasound and lightning data, and satellite data to monitor the volcano.
Source : AVO.
Photo : Beesley, Nick.
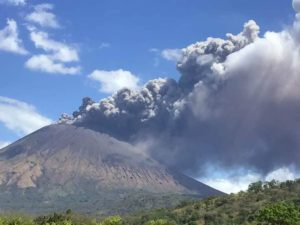
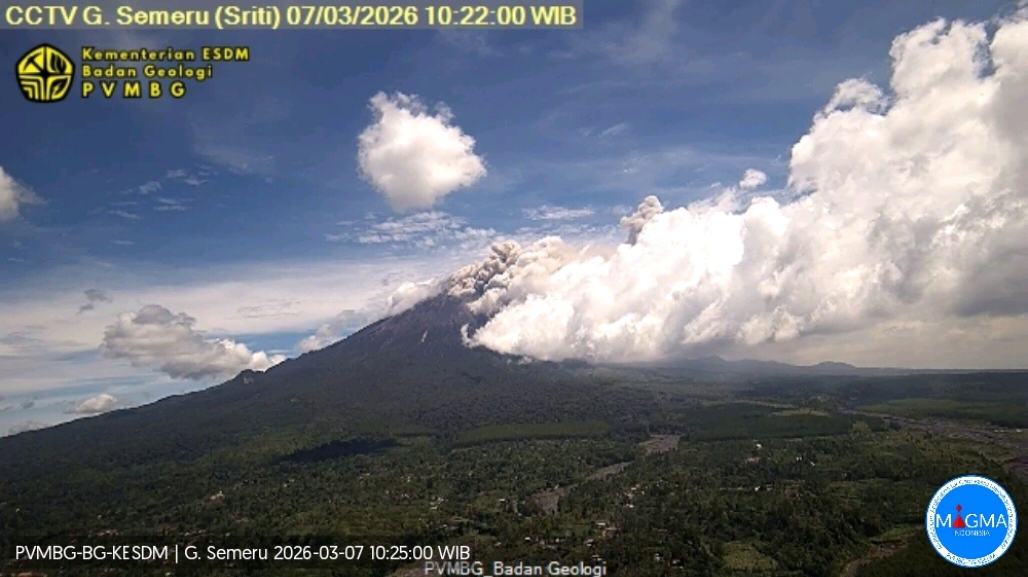
Indonesia , Semeru :
Mount Semeru experienced an eruption on Saturday, March 7, 2026, at 10:20 AM West Indonesian Time (WIB). No visual observations were made. The eruption was recorded by a seismograph with a maximum amplitude of 12 mm and a duration of 275 seconds.
Seismic Observations
22 eruption earthquakes with amplitudes between 11 and 23 mm and durations of 58 to 132 seconds.
1 pyroclastic avalanche earthquake with an amplitude of 12 mm and a duration of 275 seconds.
1 emission earthquake with an amplitude of 3 mm and a duration of 44 seconds.
1 harmonic tremor with an amplitude of 4 mm and a duration of 339 seconds.
Recommendations
1. All activity is prohibited in the southeast sector of Besuk Kobokan, within 13 km of the summit (epicenter of the eruption). Beyond this distance, the public is asked to refrain from any activity within 500 meters of the Besuk Kobokan crater rim due to the risk of pyroclastic flows and lahars extending up to 17 km from the summit.
2. Refrain from any activity within a 5 km radius of the Mount Semeru crater/summit due to the risk of being struck by (incandescent) rocks.
Source et photo : Magma Indonésie.
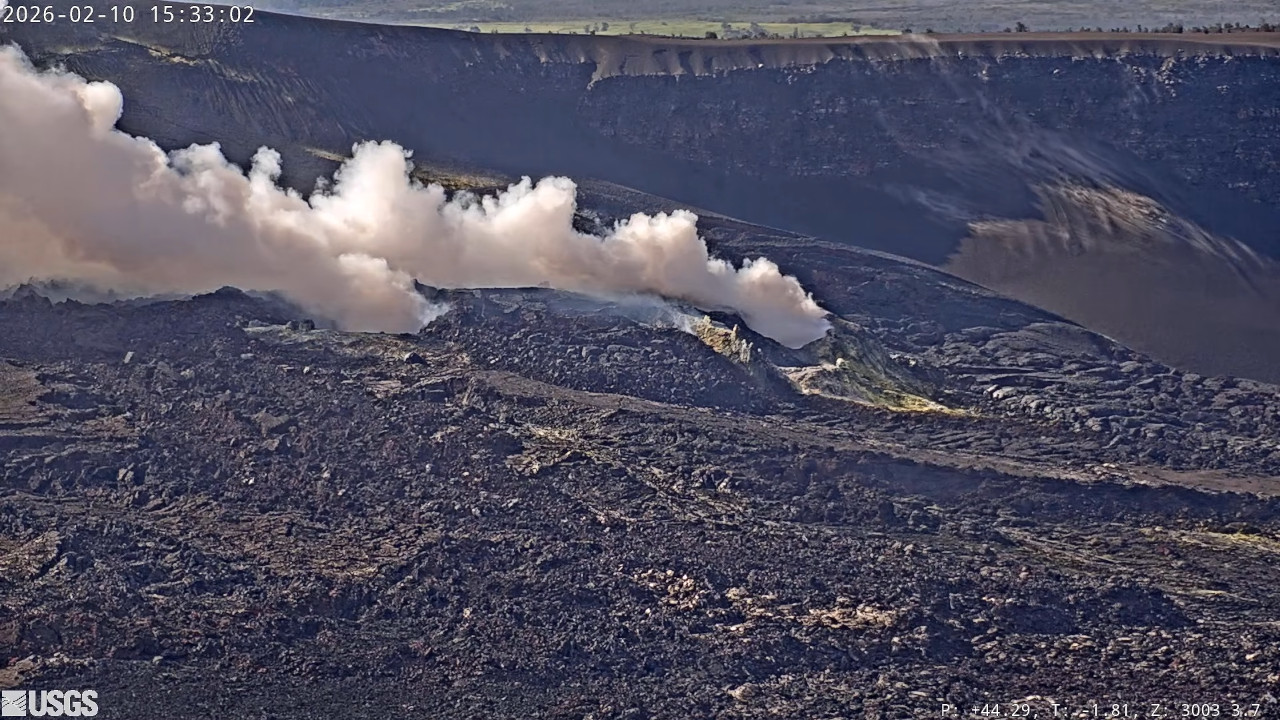
Hawaii , Kilauea :
HAWAIIAN VOLCANO OBSERVATORY DAILY UPDATE , U.S. Geological Survey
Friday, March 6, 2026, 8:55 AM HST (Friday, March 6, 2026, 18:55 UTC)
19°25’16 » N 155°17’13 » W,
Summit Elevation 4091 ft (1247 m)
Current Volcano Alert Level: WATCH
Current Aviation Color Code: ORANGE
Activity Summary:
The Halemaʻumaʻu eruption of Kīlauea is paused. Episode 42 ended February 15 at 11:38 p.m. HST. In the last 24 hours, inflation continued until 20:00 HST before flattening. The modeled forecast window for the onset of episode 43 lava fountaining is March 10-15.
No significant activity has been noted along Kīlauea’s East Rift Zone or Southwest Rift Zone.
Summit Observations:
Continuous strong glow at both the north and south vents was visible in webcams overnight. This morning, both vents remain quiet and emitting steady gas plumes. Continuous low level seismic tremor was observed over the last 24 hours.
The summit continued to inflate until 20:00 HST when the tilt signal became flat. As of this morning, the UWD tiltmeter has recorded 26.7 microradians of inflationary tilt since the end of episode 42, with about 1.4 microradians of net inflation over the past 24 hours.
Sulfur dioxide (SO2) emission rates from the summit have typically averaged 1000-1500 t/d during eruptive pauses. Webcams show the plume blowing southwest this morning in moderate trade winds.
Rift Zone Observations:
Rates of seismicity and ground deformation remain very low in the East Rift Zone and Southwest Rift Zone. SO2 emissions from the East Rift Zone remain below the detection limit.
Source et photo : HVO.
Colombia , Nevado del Ruiz :
Manizales, March 3, 2026, 6:00 PM
Regarding the monitoring of activity at the Nevado del Ruiz volcano, the Colombian Geological Survey (SGC), an agency under the Ministry of Mines and Energy, reports the following:
During the week of February 24 to March 2, 2026, the volcano continued to exhibit unstable behavior. Compared to the previous week, the main variations in some monitored parameters were as follows:
– Seismic activity associated with rock fracturing processes within the volcanic edifice decreased, both in the number of recorded earthquakes and in the seismic energy released. The earthquakes were located in the Arenas crater and within 5 km to the east, primarily on the northeast and northwest flanks of the volcano. To a lesser extent, and more scattered, earthquakes also occurred on other flanks, up to 10 km from the crater. The depth of the earthquakes varied from less than 1 km to 8 km from the summit of the volcano. The maximum recorded magnitude was 1.3, corresponding to the earthquake of February 27 at 11:55 a.m., located 2 km south-southwest of the crater, at a depth of 3 km.
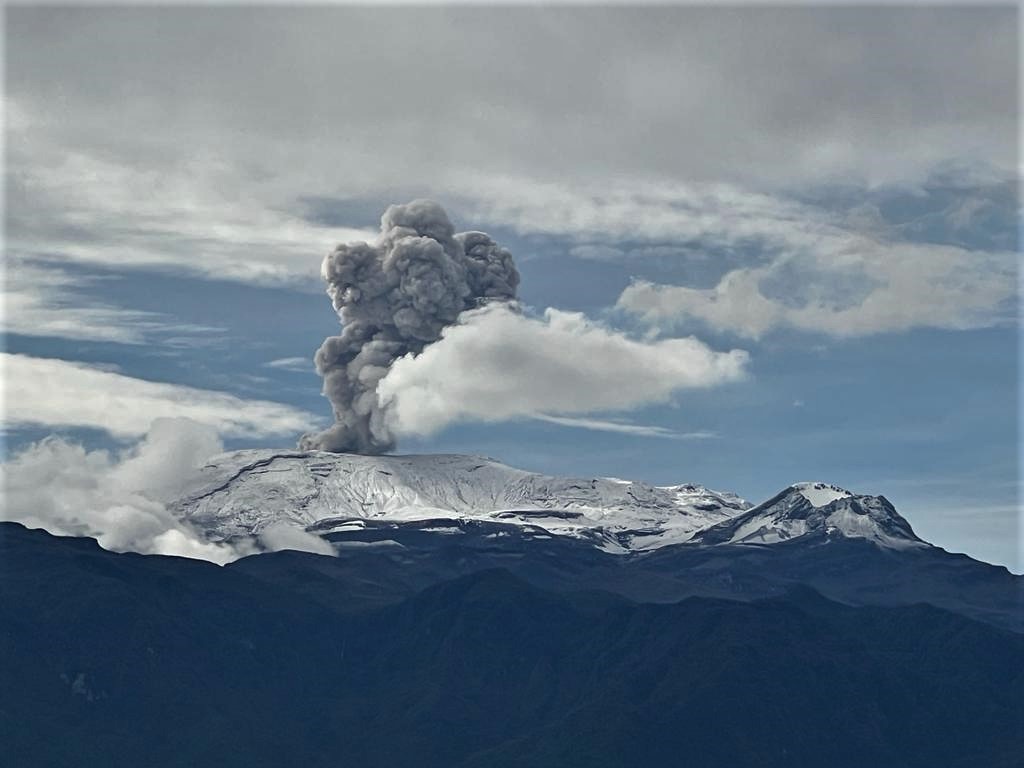
– Seismicity associated with fluid dynamics in volcanic conduits decreased, both in the number of recorded earthquakes and in the seismic energy released. These signals exhibited low energy levels and corresponded to short-duration events. During the week, no ash emissions associated with these events were confirmed due to the thick cloud cover in the region, which limited observations, and the low number of signals related to this phenomenon.
– The emission of water vapor and volcanic gases, primarily sulfur dioxide (SO₂), into the atmosphere from the Arenas crater was variable and remained low. The estimated SO₂ flux, associated with degassing processes, increased slightly compared to the previous week. The low recorded values are attributed, in part, to the high variability in wind direction and speed, which was unfavorable to the monitoring stations. Further monitoring, conducted using satellite data platforms, confirms the low SO₂ emissions.
– The vertical height of the gas and water vapor column was mostly less than 300 m and between 500 and 600 m, measured above the volcano’s summit, with a maximum of 900 m. The plume’s dispersion direction was variable, tending towards the southwest and west-southwest flanks and, to a lesser extent, towards the southeast, east-southeast, and northeast flanks of the volcano.
Monitoring of thermal anomalies at the bottom of the Arenas crater, using satellite platforms, showed that energy levels remained low.
Source et photo : SGC.