January 20 , 2026.
La Réunion Island , Piton de la Fournaise :
Press Release from the Paris Institute of Earth Physics / Piton de la Fournaise Volcanological Observatory, January 19, 2026 – 10:00 AM local time – 6:00 AM UTC
Eruption in progress
Observations
The eruption that began on January 18, 2026, at approximately 7:45 PM (local time) is ongoing. This morning, three fissures were still active, although the fissure adjacent to Piton Jacob was showing signs of weakening (the middle fissure in the top right of Figure 1).
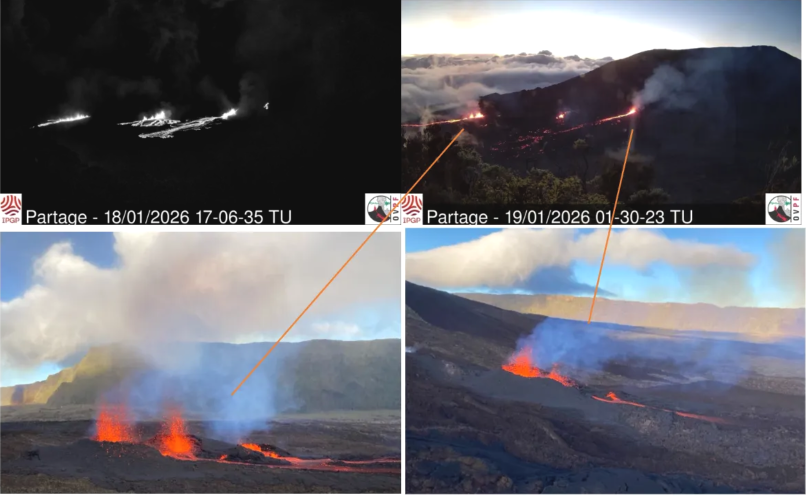
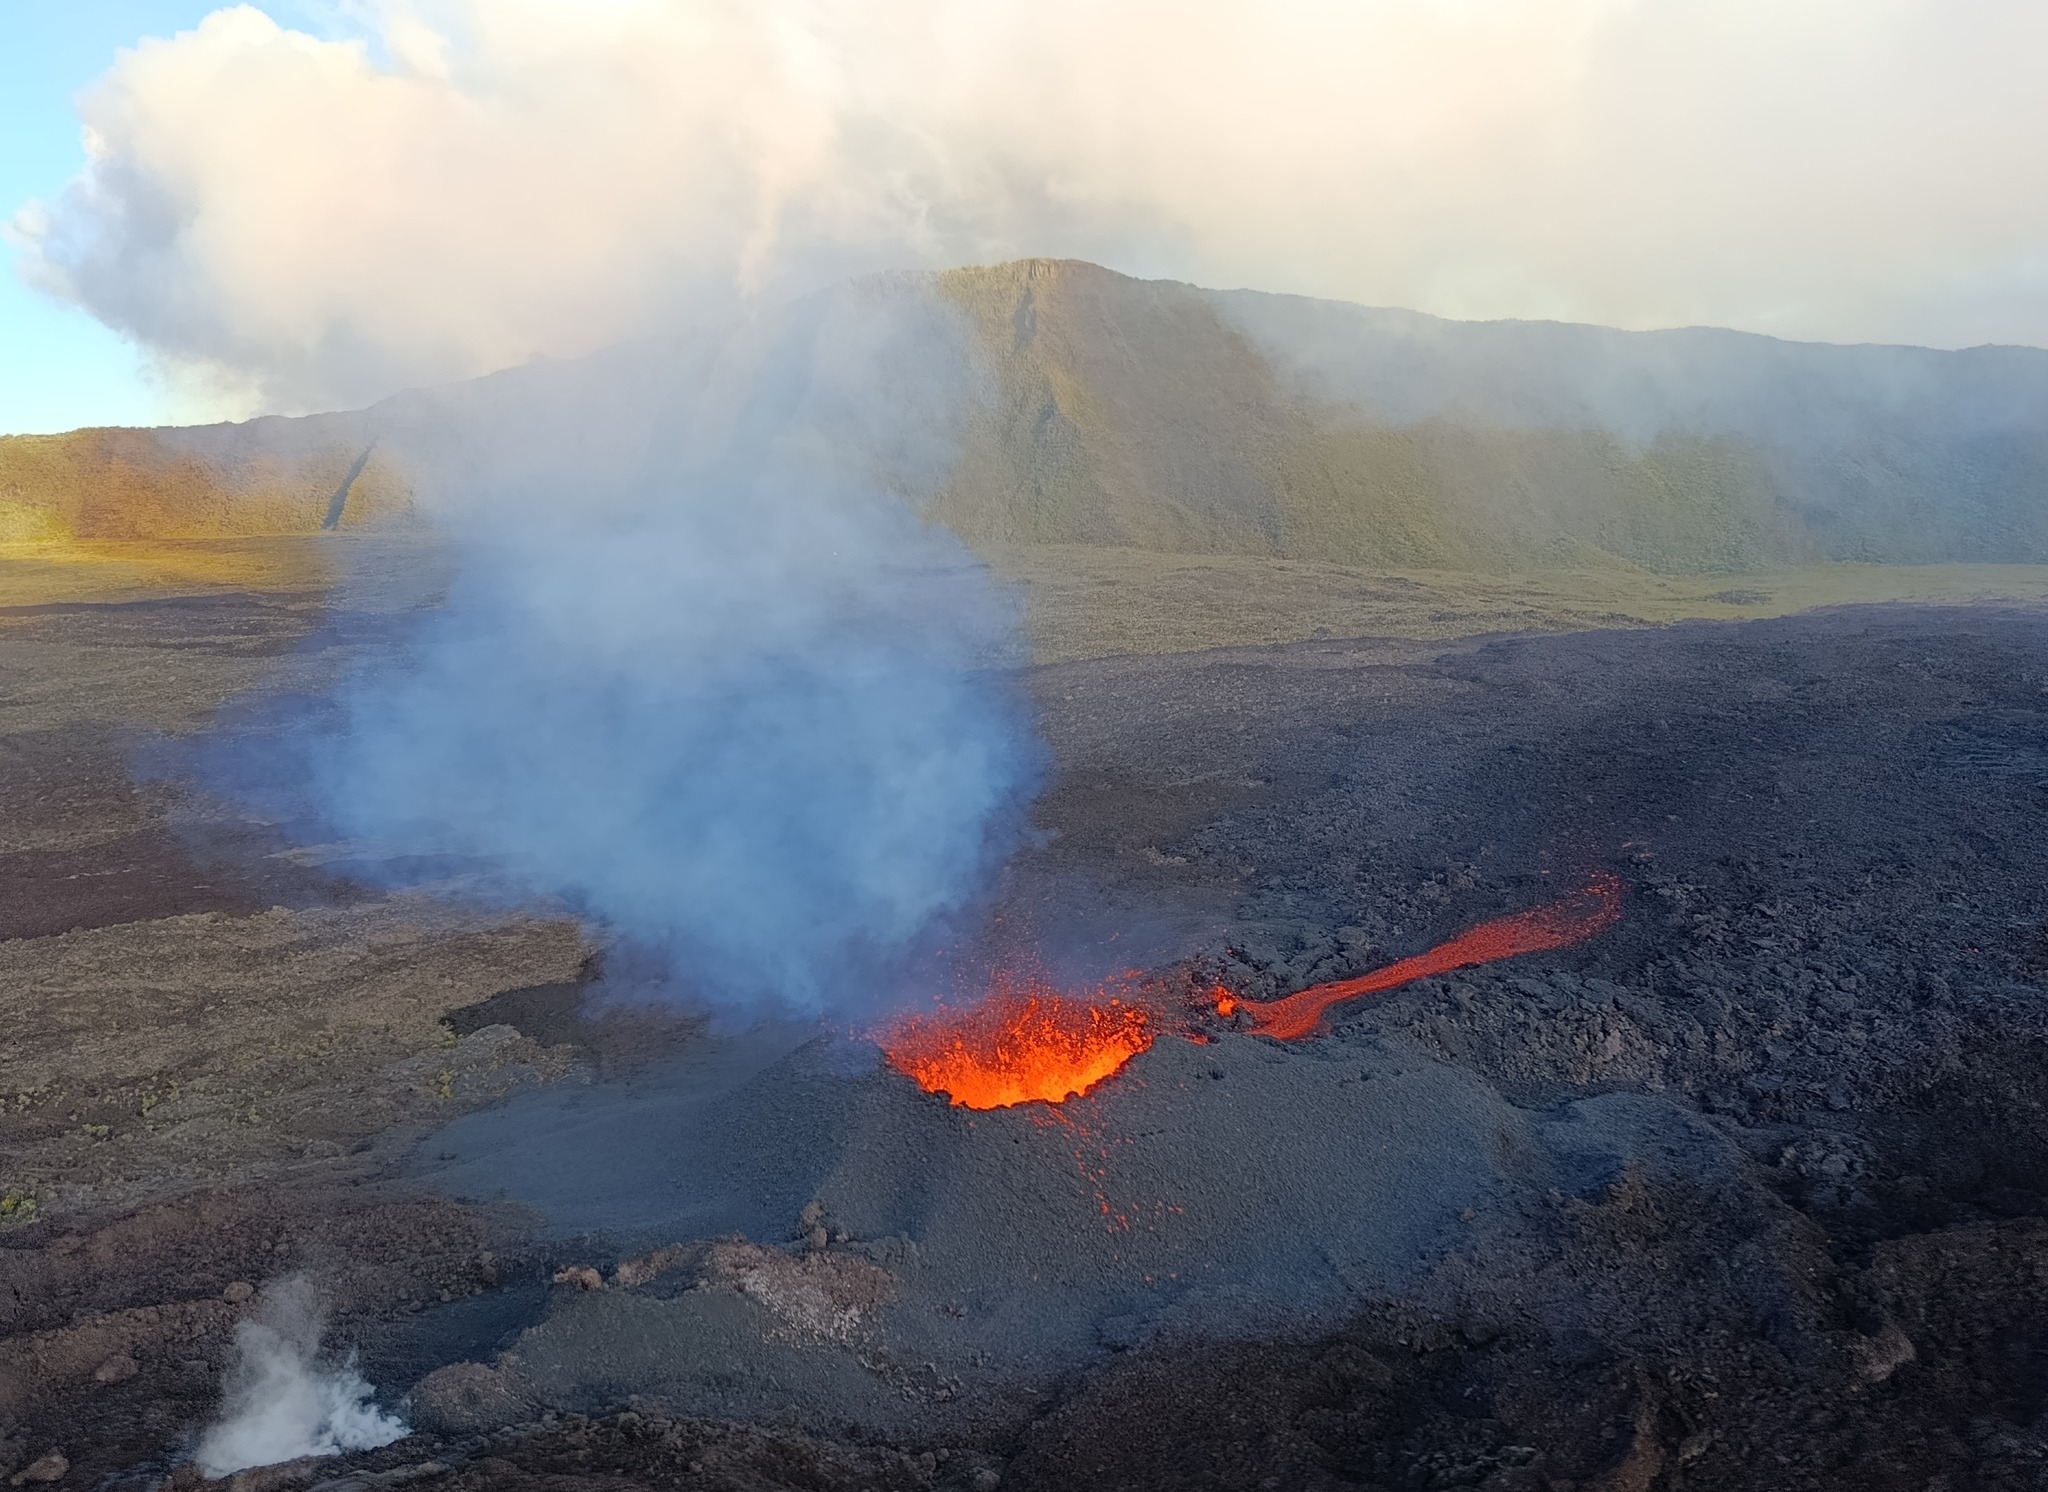
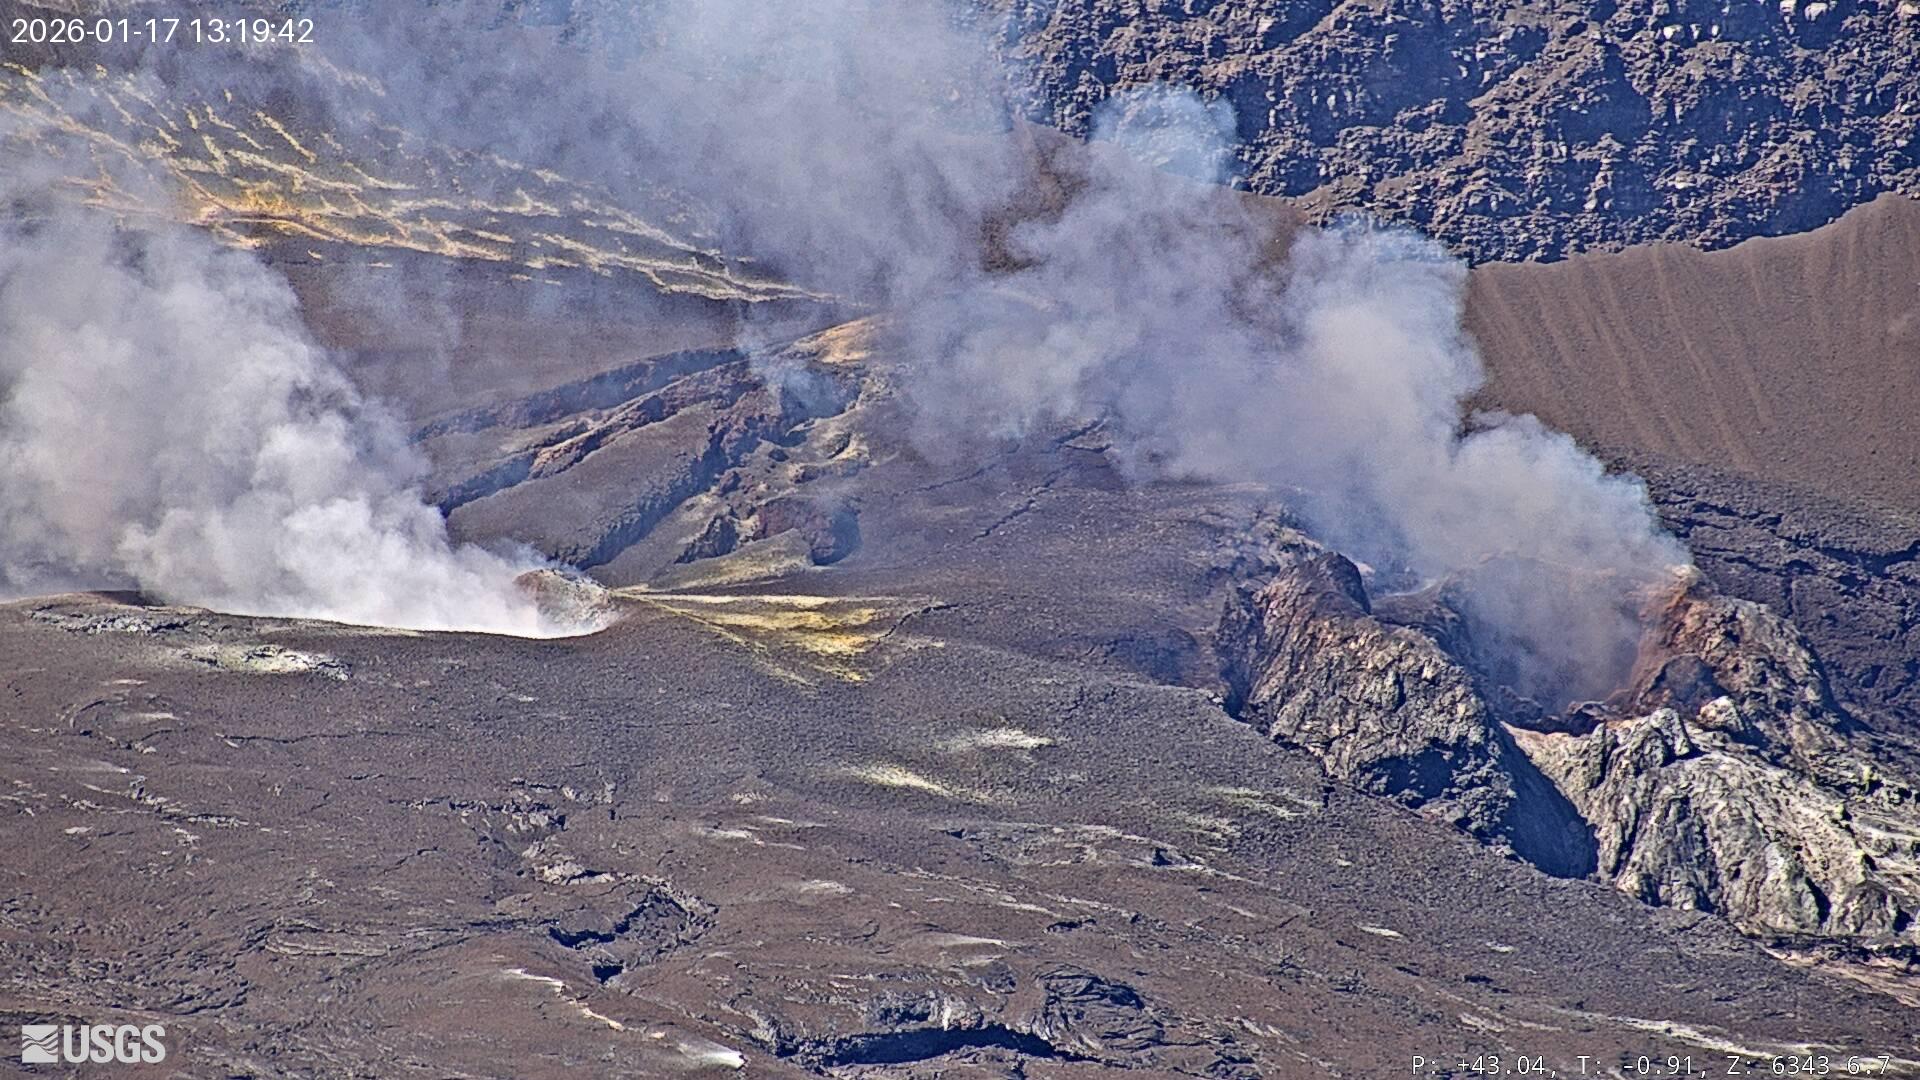
Images of the eruptive sites. Top: from the OVPF-IPGP webcam located at Piton Partage (UTC = Réunion time -4). Bottom: helicopter-borne images taken with the assistance of the SAG and the PGHM between 6:25 and 6:30 a.m. local time (©OVPF-IPGP).
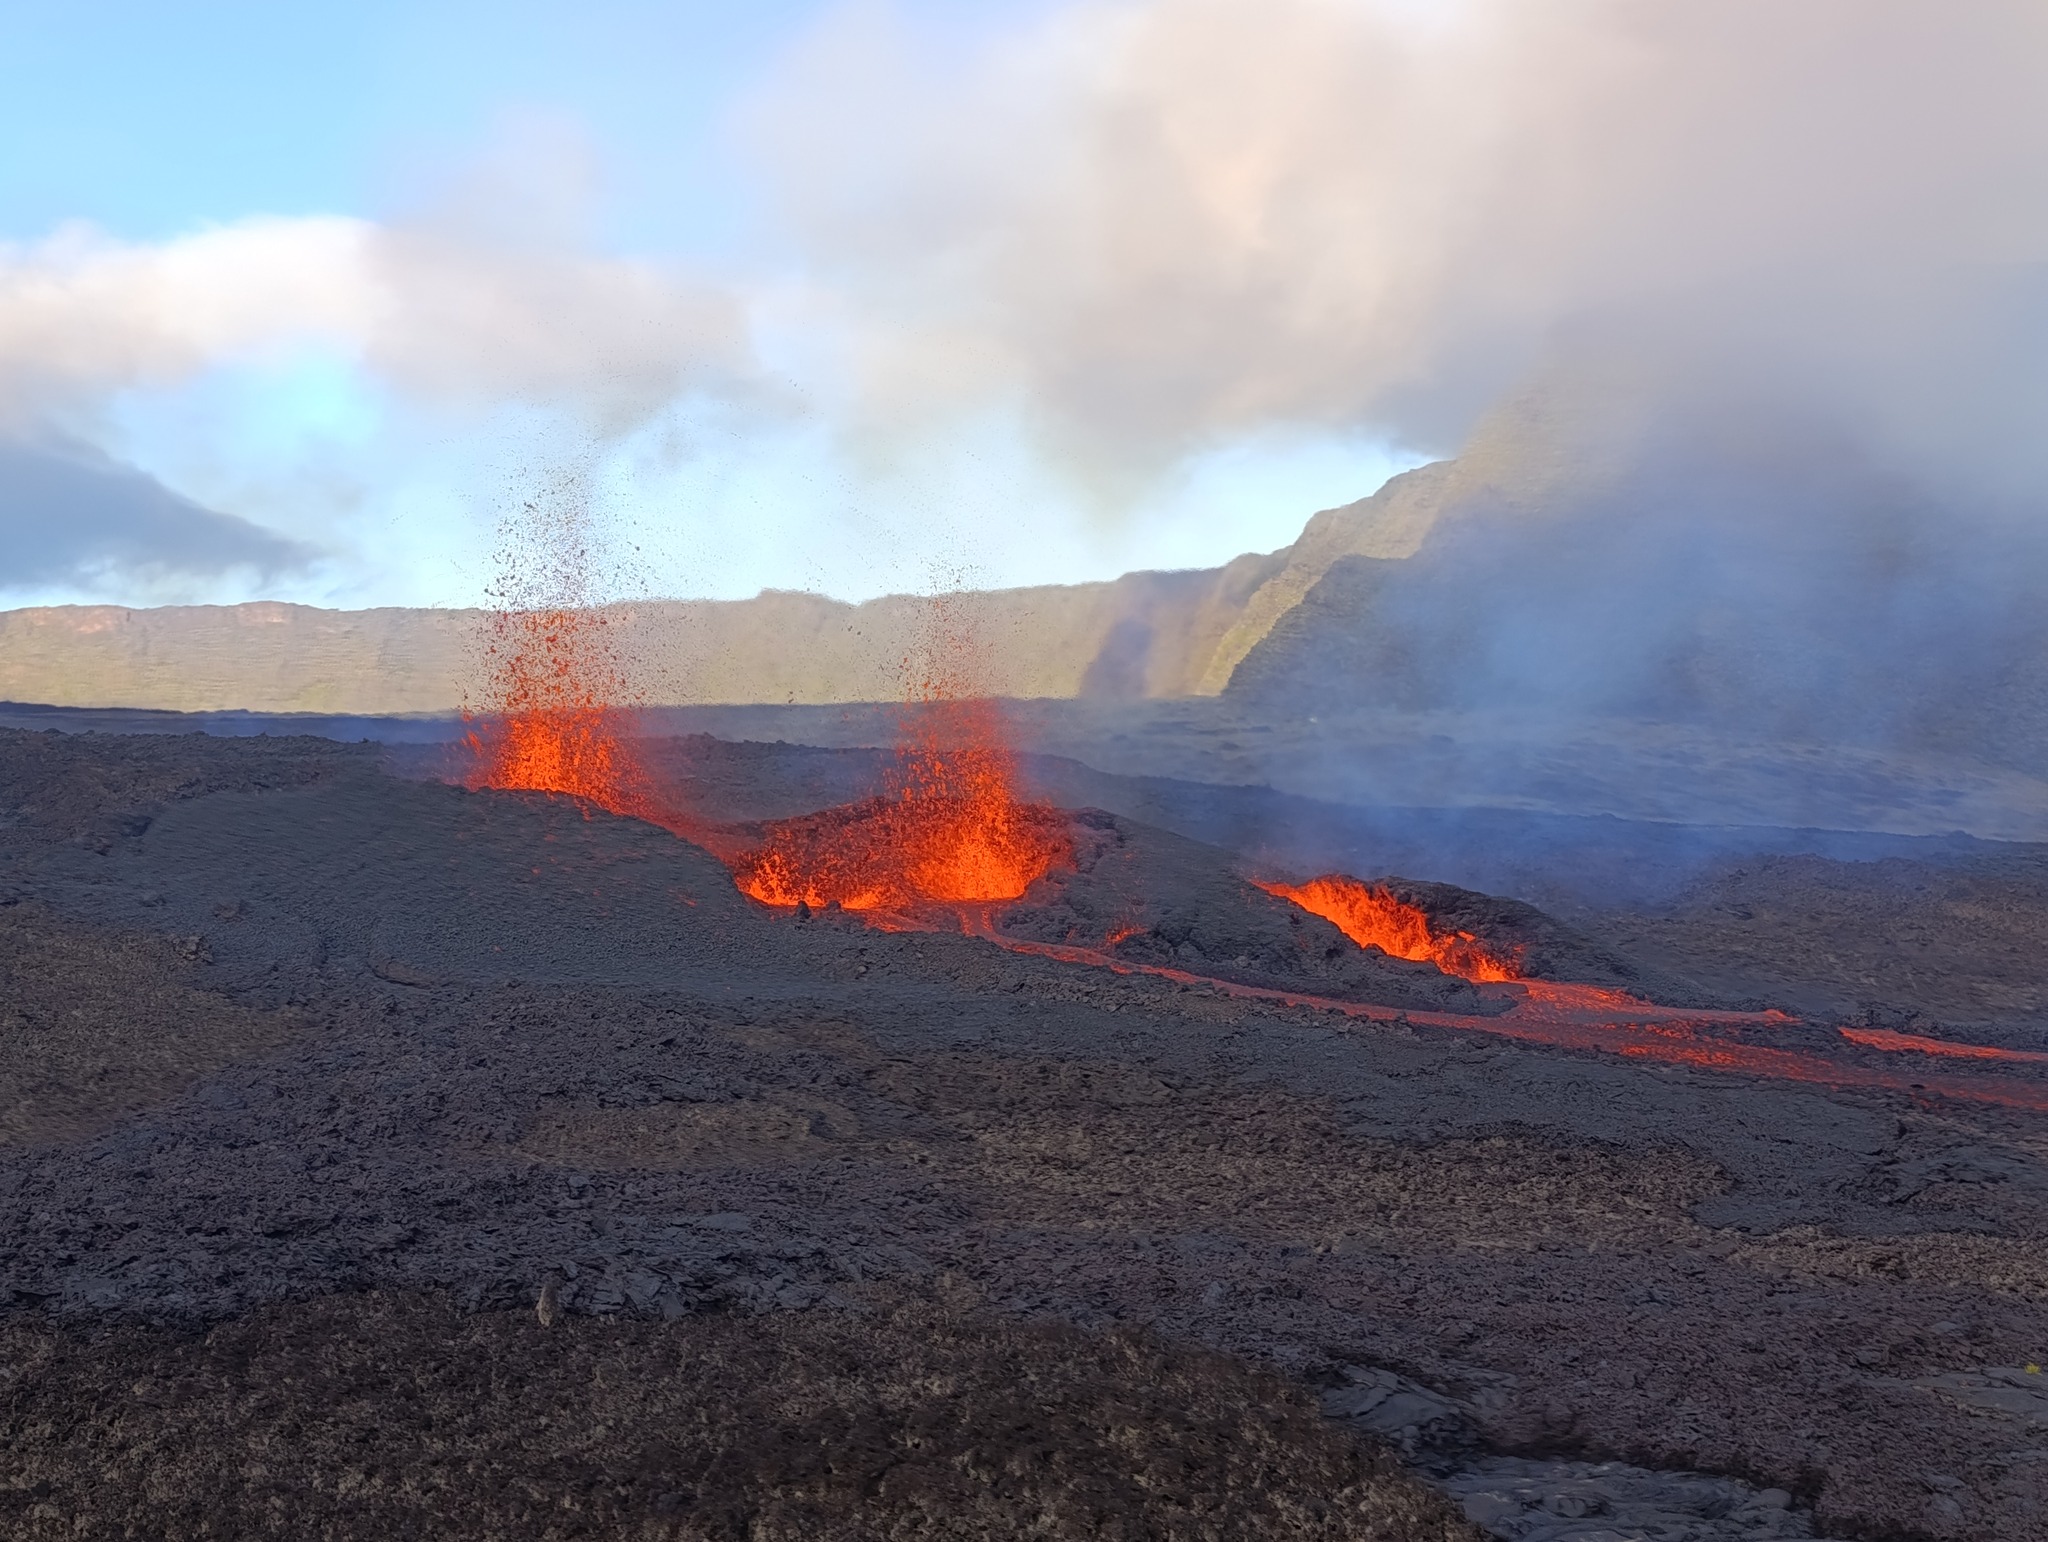
On the two most active fissures, a cone was being built by lava ejecta. The lava fountains were low, not exceeding 20 m in height.
At 6:28 a.m. (local time), the flow front was located approximately 600 m from the Grandes Pentes fault. The lava flows, composed mainly of scree, were advancing very slowly.
Seismicity
Following the opening of eruptive fissures, the amplitude of volcanic tremor (an indicator of lava and gas emissions at the surface) increased late yesterday (between 3:42 PM and 5:00 PM UTC). Since 5:00 PM UTC (9:00 PM local time), the tremor amplitude has been decreasing, although a stabilization appears to be emerging over the last two hours.
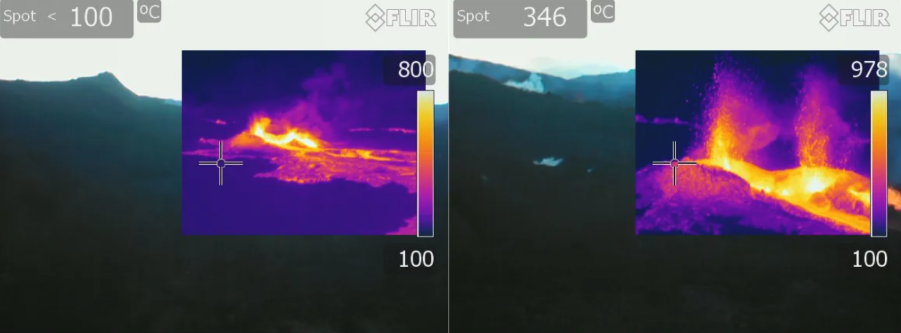
Thermal imaging of the most downstream eruptive site. Helicopter-borne images taken with the assistance of the SAG and the PGHM between 6:25 and 6:30 a.m. local time (©OVPF-IPGP)
Lava Flow
Lava flow estimates established by satellite method on the HOTVOLC platform (OPGC – Clermont Auvergne University) over the past 24 hours indicated flow rates between 2 and 27 m³/sec. Given the cloud cover regularly present over the eruptive site, these flow rates are fluctuating and may be underestimated.
Alert Level: Alert 2-1
Press Release from the Paris Institute of Earth Physics / Piton de la Fournaise Volcanological Observatory, January 20, 2026 – 9:00 AM local time – 5:00 AM UTC
Eruption Ends
The eruption that began on January 18, 2026, at approximately 7:45 PM (local time) ended at approximately 5:00 AM local time, with the cessation of volcanic tremor (an indicator of lava and gas emissions at the surface).
Gas emissions are still being observed, as well as red glows associated with the cooling lava fields.
A team from the OVPF-IPGP is currently on site conducting analyses and taking samples, and has confirmed that surface lava emissions have ceased.
Initial estimates indicate that less than 1 million cubic meters of lava have been emitted since the start of the eruption.
No hypothesis is being ruled out at this time regarding the future developments (definitive cessation, resumption of activity at the same site, or resumption of activity at another site), given the continued seismic activity.
Indeed, seismic activity remains sustained, with an average of 10 earthquakes per hour located beneath the summit area, indicating that the volcano’s surface magma system remains under pressure. New fissure openings are therefore still possible.
Alert Level: Alert 2-1
Source : direction de l’OVPF-IPGP.
Photos : OVPF
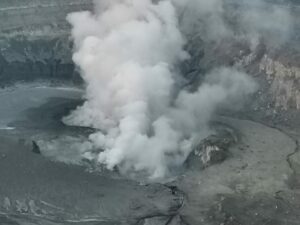
New Zealand , White Island :
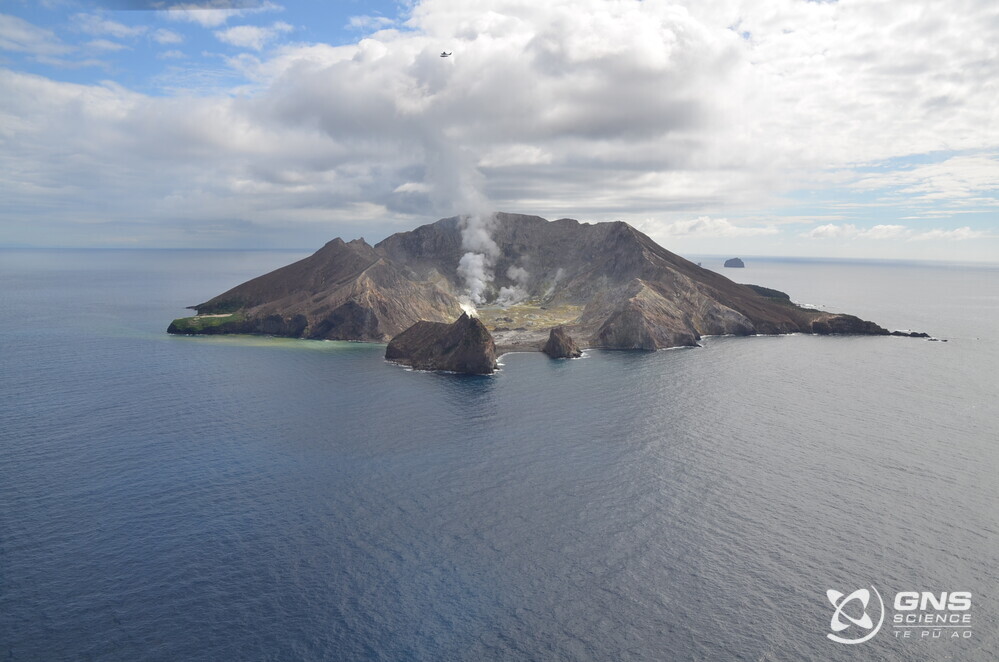
Steam and gas emissions continue at Whakaari/White Island. Volcanic Alert Level remains at 2 and Aviation Colour Code at Yellow.
Published: Tue Jan 20 2026 3:10 PM
Based on observations from a recent gas flight, webcam images and satellite imagery, activity continues to be dominated by steam and gas emissions at Whakaari/White Island. No recent eruptive activity has been recorded. The Volcanic Alert Level remains at 2 and the Aviation Colour Code is Yellow.
From late October to mid-December, Whakaari/White Island exhibited a minor phase of eruptive activity, dominated by weak ash emissions and moderate steam and gas emissions. Since mid-December, there is no evidence of ash being emitted and gas emissions appear to be moderate. Observations from a gas flight last week, along with daytime web camera footage from the Bay of Plenty coastline, have confirmed only moderate steam and gas emissions are occurring from the active vent.
Last week’s gas flight recorded similar values to previous levels, specifically for Sulphur Dioxide (SO₂) whereas the Carbon Dioxide (CO₂) is slightly higher but well within the range of recent measurements. During this same period, satellite imagery has only detected SO₂ gas on one day i.e., 6th January 2026. There has also been a small-moderate landslide within the 1914 scarp area, probably generated by recent heavy rainfall.
The available observational data confirms the overall level of activity at Whakaari/White Island is low and the Volcanic Alert Level remains at 2 (moderate to heightened unrest) and the Aviation Colour Code at Yellow. The eruptive activity has ceased for now; however eruptive volcanic activity could re-escalate with little to no warning. Further sudden, more explosive events could therefore affect the crater floor area and immediate vicinity near the island.
Given our current lack of real-time monitoring data from the island, we cannot distinguish between Volcanic Alert Level (VAL) 1 and 2. As a result, Whakaari/White Island will remain at minimum at VAL 2 until on-island monitoring gets reinstated.
Earth Sciences NZ’s Volcano Monitoring Group and National Geohazards Monitoring Centre will continue to closely monitor Whakaari/White Island for any changes in activity. Without sensors on the island, our monitoring continues to rely on remote cameras, satellite imagery, and periodic observation and gas flights to monitor Whakaari/White Island. We will provide further updates when information becomes available.
Source : Geonet.
Photo : BJ_Scott.
Indonesia , Ili Lewotolok :
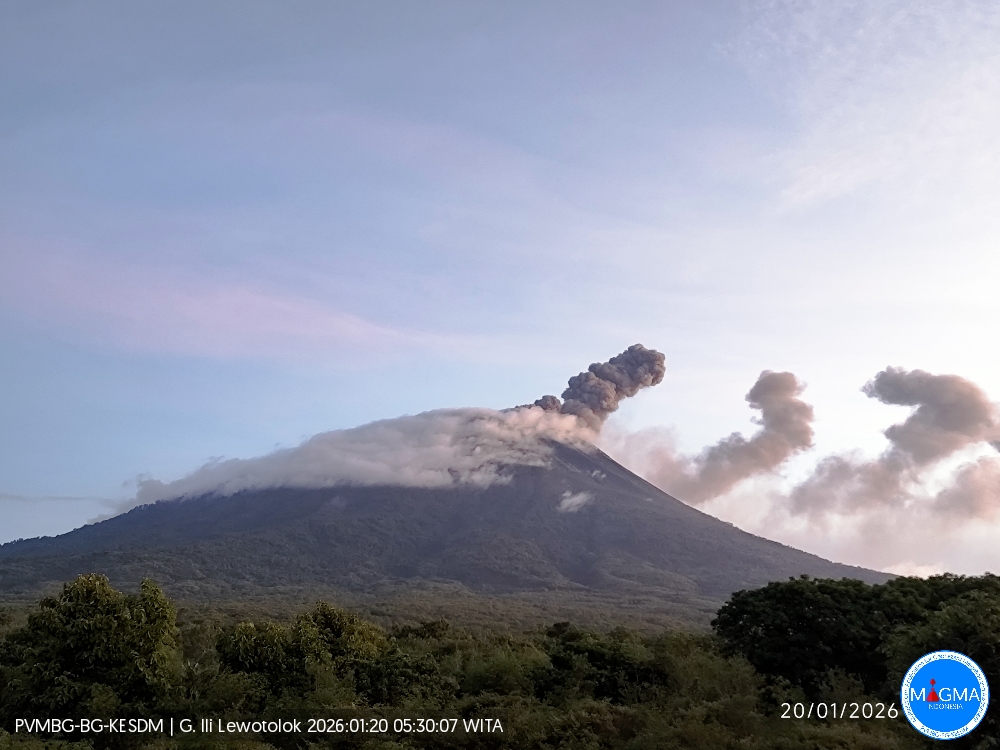
An eruption of Mount Ili Lewotolok occurred on Tuesday, January 20, 2026, at 05:28 WITA. The observed ash column rose approximately 500 meters above the summit (about 1923 meters above sea level). The thick, gray-black ash column drifted eastward. This eruption was recorded by a seismograph with a maximum amplitude of 33.8 mm and a duration of 142 seconds.
VOLCANO OBSERVATORY NOTICE FOR AVIATION – VONA
Issued : January 20 , 2026
Volcano : Ili Lewotolok (264230)
Current Aviation Colour Code : ORANGE
Previous Aviation Colour Code : orange
Source : Ili Lewotolok Volcano Observatory
Notice Number : 2026LEW009
Volcano Location : S 08 deg 16 min 19 sec E 123 deg 30 min 18 sec
Area : East Nusa Tenggara, Indonesia
Summit Elevation : 4554 FT (1423 M)
Volcanic Activity Summary :
Eruption with volcanic ash cloud at 21h28 UTC (05h28 local).
Volcanic Cloud Height :
Best estimate of ash-cloud top is around 6154 FT (1923 M) above sea level or 1600 FT (500 M) above summit. May be higher than what can be observed clearly. Source of height data: ground observer.
Other Volcanic Cloud Information :
Ash cloud moving to east. Volcanic ash is observed to be gray to dark. The intensity of volcanic ash is observed to be thick.
Remarks :
Eruption recorded on seismogram with maximum amplitude 33.8 mm and maximum duration 142 second.
Source et photo : Magma Indonésie .
Colombia , Galeras :
San Juan de Pasto, January 13, 2026, 2:40 PM
Regarding the monitoring of activity at the Galeras volcano, the Colombian Geological Survey (SGC), an agency under the Ministry of Mines and Energy, reports the following:
For the period of January 6-12, 2026, the main variations in monitored parameters compared to the previous week were as follows:
● Despite slight fluctuations in volcanic activity, a slight increase in seismic frequency and energy release was recorded.
Seismicity associated with rock fracturing processes within the volcanic edifice remained predominant.
● The majority of earthquakes occurred in the Northeast sector of the main crater, at distances of less than 9.5 km, at depths of less than 12 km from the summit of Galeras (4,200 m altitude), and reached a maximum magnitude of 2.7. The most intense event was recorded on January 9 at 5:07 a.m. and was felt by some residents of its epicenter, mainly in Pasto.
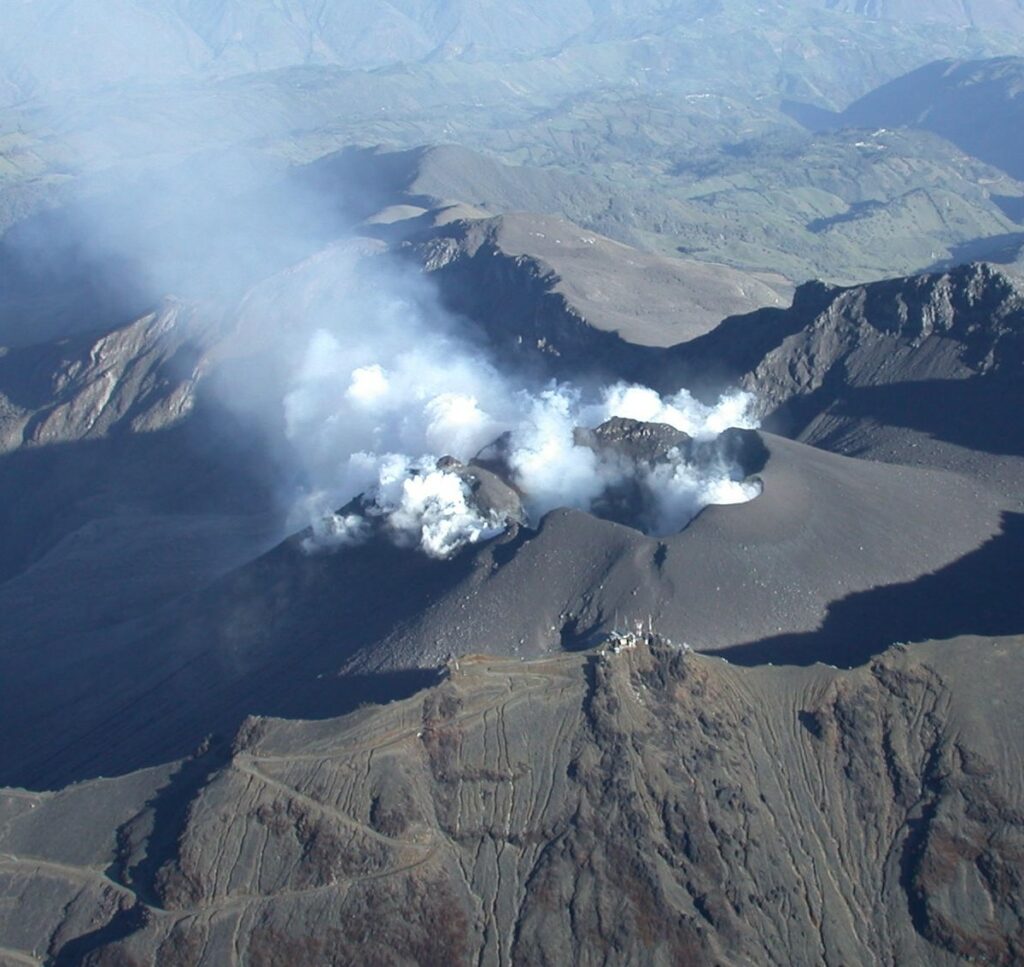
● During the week, small plumes of white gas were observed, at low altitude and with variable dispersion depending on wind direction, originating primarily from the fumarole fields of El Paisita to the north, Las Chavas to the west, and the main crater.
● Other volcanic monitoring parameters remained stable.
Given the above, the Geological Survey of Colombia (SGC) recommends closely monitoring the situation by consulting the weekly bulletins and other information published through its official channels, as well as the instructions of local and departmental authorities and the National Unit for Disaster Risk Management (UNGRD).
Volcanic activity remains at the yellow alert level: active volcano exhibiting changes in the baseline behavior of monitored parameters and other manifestations.
Source et photo : SGC.
Hawaii , Kilauea :
HAWAIIAN VOLCANO OBSERVATORY DAILY UPDATE , U.S. Geological Survey
Monday, January 19, 2026, 8:51 AM HST (Monday, January 19, 2026, 18:51 UTC)
19°25’16 » N 155°17’13 » W,
Summit Elevation 4091 ft (1247 m)
Current Volcano Alert Level: WATCH
Current Aviation Color Code: ORANGE
Activity Summary:
The eruption of Halemaʻumaʻu at the summit of Kīlauea is paused. The forecast for the onset of the next lava fountaining episode is between January 21 to 25, 2026 based on current inflation models. Earthquake swarm activity continued with two clusters yesterday and overnight. No significant activity has been noted along Kīlauea’s East Rift Zone or Southwest Rift Zone.
Summit Observations:
Overnight webcam views continue to show consistent glow from the south vent and weak sporadic glow from the north vent. Constant low-level tremor continues this morning.
Earthquake swarm activity continued with two clusters yesterday and overnight, one starting at 3:49 PM HST January 18 and the other at 3:58 AM HST January 19. Locations continue to be spread fairly widely beneath the southeast part of Halemaʻumaʻu. The swarms are related to migrating magmatic pressure within the summit region but their impact on the next episode of fountaining, if any, is unknown at this time.
Since the end of episode 40, the UWD tiltmeter has recorded 13.3 microradians of inflationary tilt, with an increase of 1.6 microradians in the past 24 hours. This includes two small tilt drops associated with the summit swarms, each was a small fraction of a microradian.
The summit SO2 emission rate was last measured on January 15, at 1550 tonnes per day, which is within the typical range of 1,000 to 5,000 tonnes of SO2 per day observed during previous eruptive pauses and is considerably lower than rates observed during fountaining episodes.
Rift Zone Observations:
Rates of seismicity and ground deformation remain very low in the East Rift Zone and Southwest Rift Zone. SO2 emissions from the East Rift Zone remain below the detection limit.
Source et photo : AVO.