January 12 , 2025.
Hawaii , Kilauea :
HAWAIIAN VOLCANO OBSERVATORY DAILY UPDATE , U.S. Geological Survey
Tuesday, January 13, 2026, 9:14 AM HST (Tuesday, January 13, 2026, 19:14 UTC)
19°25’16 » N 155°17’13 » W,
Summit Elevation 4091 ft (1247 m)
Current Volcano Alert Level: WATCH
Current Aviation Color Code: ORANGE
Activity Summary:
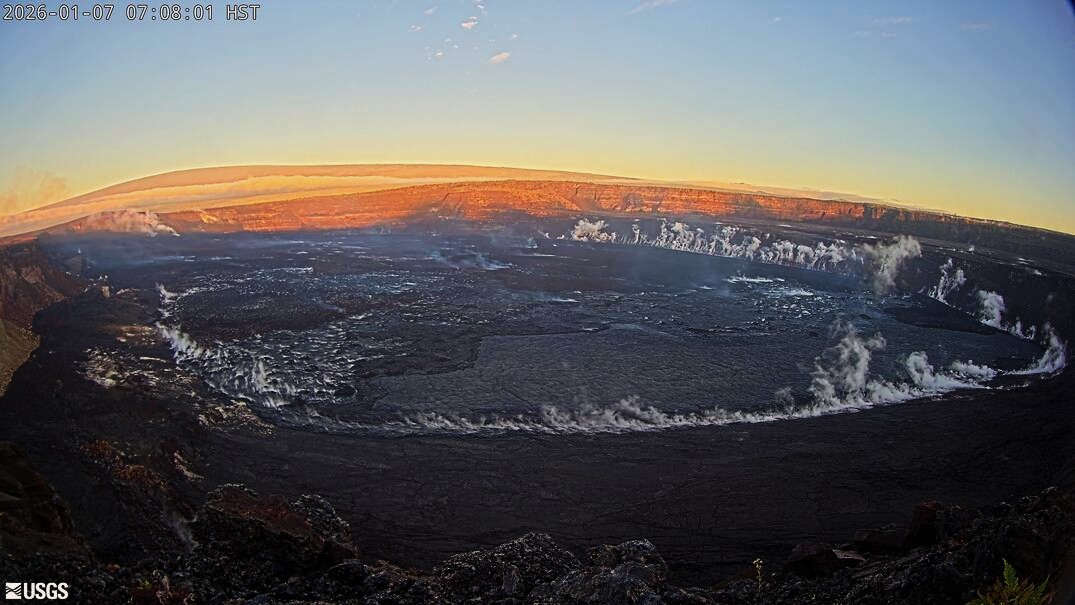
Kīlauea is not erupting. Summit eruption episode 40 lava fountaining began at 8:34 a.m. HST, January 12 and ended 9.7 hours later, at 6:04 p.m., after reaching maximum heights of about 800 feet (250 meters). The onset of the next lava fountaining episode is likely about 2 weeks away, but more time and data are needed to forecast. No significant activity has been noted along Kīlauea’s East Rift Zone or Southwest Rift Zone.
Summit Observations:
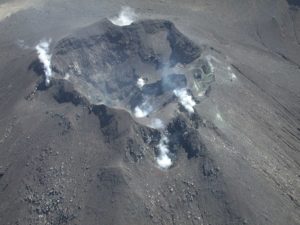
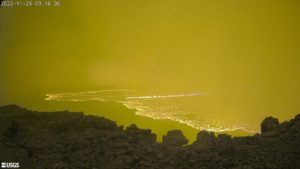
Overnight webcam views show episode 40 lava flows continuing to creep along on the floor of Halemaʻumaʻu crater closest to the eruptive vents. Incandescent spots and movement of flows are expected to continue for the next several days, especially in the area around the vents. Incandescence was also visible within both the north and south vents overnight.
A series of about 22 small earthquakes occurred in the Kīlauea summit region at depths of 1.2-2.5 miles (2-4 km) below the surface between midnight and 3 a.m. HST last night. These earthquakes were not associated with changes in other monitoring datasets and were likely related to re-pressurization of Kīlauea summit region follow the end of episode 40.
Since the end of episode 40, Kīlauea has inflated 1.5 microradians as recorded on the UWD tiltmeter this morning.
Volcanic gas emission rates have dropped significantly since the end of episode 40 but probably remain in the range of 1,000 to 5,000 tonnes of SO2 per day typically observed during previous eruptive pauses.
Rift Zone Observations:
Rates of seismicity and ground deformation remain very low in the East Rift Zone and Southwest Rift Zone. SO2 emissions from the East Rift Zone remain below the detection limit.
Analysis:
The rapid rebound of inflationary tilt and presence of low-level volcanic tremor after episode 40 indicate that another lava fountaining episode is likely to occur. However, there is insufficient data for modeling. Past eruption patterns suggest that the next episode is likely about 2 weeks away.
Source et photo : HVO
Italy , Stromboli :
WEEKLY BULLETIN, January 5, 2026 to January 11, 2026 (issue date: January 13, 2026)
ACTIVITY SUMMARY
Based on monitoring data, the following points should be noted:
1) VOLCANOLOGICAL OBSERVATIONS: During this period, ordinary Strombolian-type eruptive activity was observed. The total hourly frequency fluctuated between high values (16 to 18 events/hour). The intensity of the explosions was mostly low to medium in the North and Central-South crater areas.
2) SEISMOLOGY: The monitored seismic parameters showed no significant variation.
3) GROUND DEFORMATION: The ground deformation monitoring networks did not show significant variations.
The tilt measurement network is still affected by disturbances that compromise its reliability.
4) GEOCHEMISTRY: Low SO2 flux.
High CO2 flux from the ground in the Pizzo area (STR02).
C/S ratio in the pen: average values.
Dissolved helium isotope ratio (R/Ra) in the thermal aquifer: no update. Last data: 12/12/2025 (high value: 4.44).
CO2 flux from the ground in the San Bartolo area: high values.
CO2 flux from the ground in the Scari area: almost stable at approximately 130 g/m²/day.
5) SATELLITE OBSERVATIONS: Satellite-observed thermal activity in the summit area was generally low, with a few isolated thermal anomalies of moderate intensity.

VOLCANOLOGICAL OBSERVATIONS
During the observation period, Stromboli’s eruptive activity was characterized by analyzing images recorded by the INGV-OE monitoring cameras located at 190 m (SCT-SCV) and at Punta dei Corvi (SPCT). Explosive activity was primarily produced by five eruptive vents located in the northern crater area and by at least two vents located in the central-southern area.
Due to heavy cloud cover on January 7 and 9, the crater terrace was not visible for a sufficient number of hours to accurately describe the eruptive activity.
Observations of explosive activity captured by monitoring cameras
In the northern (N) crater area, five active winds were observed: two in sector N1 and three in sector N2. These vents produced explosive activity of low (less than 80 m high) and medium intensity (less than 150 m high) intensity. The eruptive products were primarily coarse material (bombs and lapilli). The average frequency of explosions ranged from 14 to 17 events per hour.
In the Central-South (CS) crater area, two main winds were observed. One produced explosions of fine material mixed with coarse material, while the other produced explosions of low to medium intensity coarse material. The average frequency of explosions ranged from less than 1 to 3 events per hour.
Source : INGV.
Photo : Stromboli stati d’animo / Sebastiano Cannavo
Italy / Sicily , Etna :
WEEKLY BULLETIN, January 5, 2026 to January 11, 2026 (issue date: January 13, 2026)
ACTIVITY SUMMARY
Based on monitoring data, the following points should be noted:
1) VOLCANOLOGICAL OBSERVATIONS: Effusive activity in the Valle del Bove, with degassing of the summit craters.
2) SEISMOLOGY: Moderate seismic activity due to fracturing; the average tremor amplitude oscillates between average and low values.
3) INFRASOUND: Low infrasound activity during the first two days of the week in question. Counting and location are unreliable during the remainder of the week. 4) SOIL DEFORMATIONS: The soil deformation monitoring networks have measured variations at the inclinometer stations and the DRUV dilatometer, associated with the ongoing eruptive activity.
5) GEOCHEMISTRY:
High SO₂ flux.
Soil CO₂ flux (EtnaGas Network): decreasing from average to low.
Partial pressure of dissolved CO₂ in groundwater (EtnaAcque Network): no update.
Helium isotope ratio at peripheral sites: average, decreasing (latest data from December 22).
6) SATELLITE OBSERVATIONS: Over the past week, thermal activity observed by satellite in the summit area has generally been moderate.
VOLCANOLOGICAL OBSERVATIONS
During the week under review, Etna’s volcanic activity was monitored through the analysis of images from the INGV – Osservatorio Etneo (INGV-OE) surveillance cameras and satellite imagery, as well as through direct field observations conducted by INGV-OE staff on January 5, 6, 7, and 9. Surveillance camera observations were irregular due to adverse weather conditions, particularly affecting the summit area.
Overall, the observation period was characterized by effusive activity in the Valle del Bove, which began on January 1, and by degassing from the summit craters.
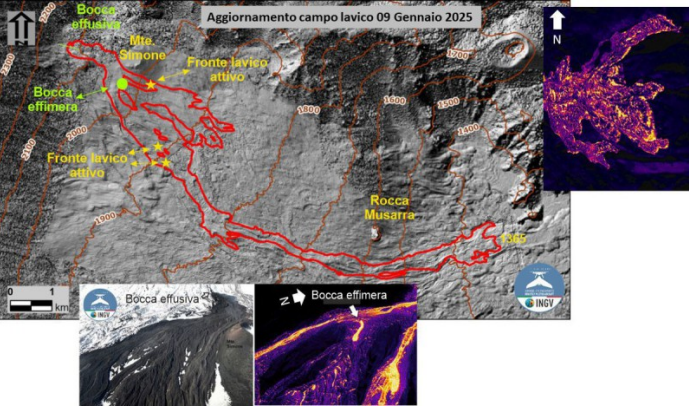
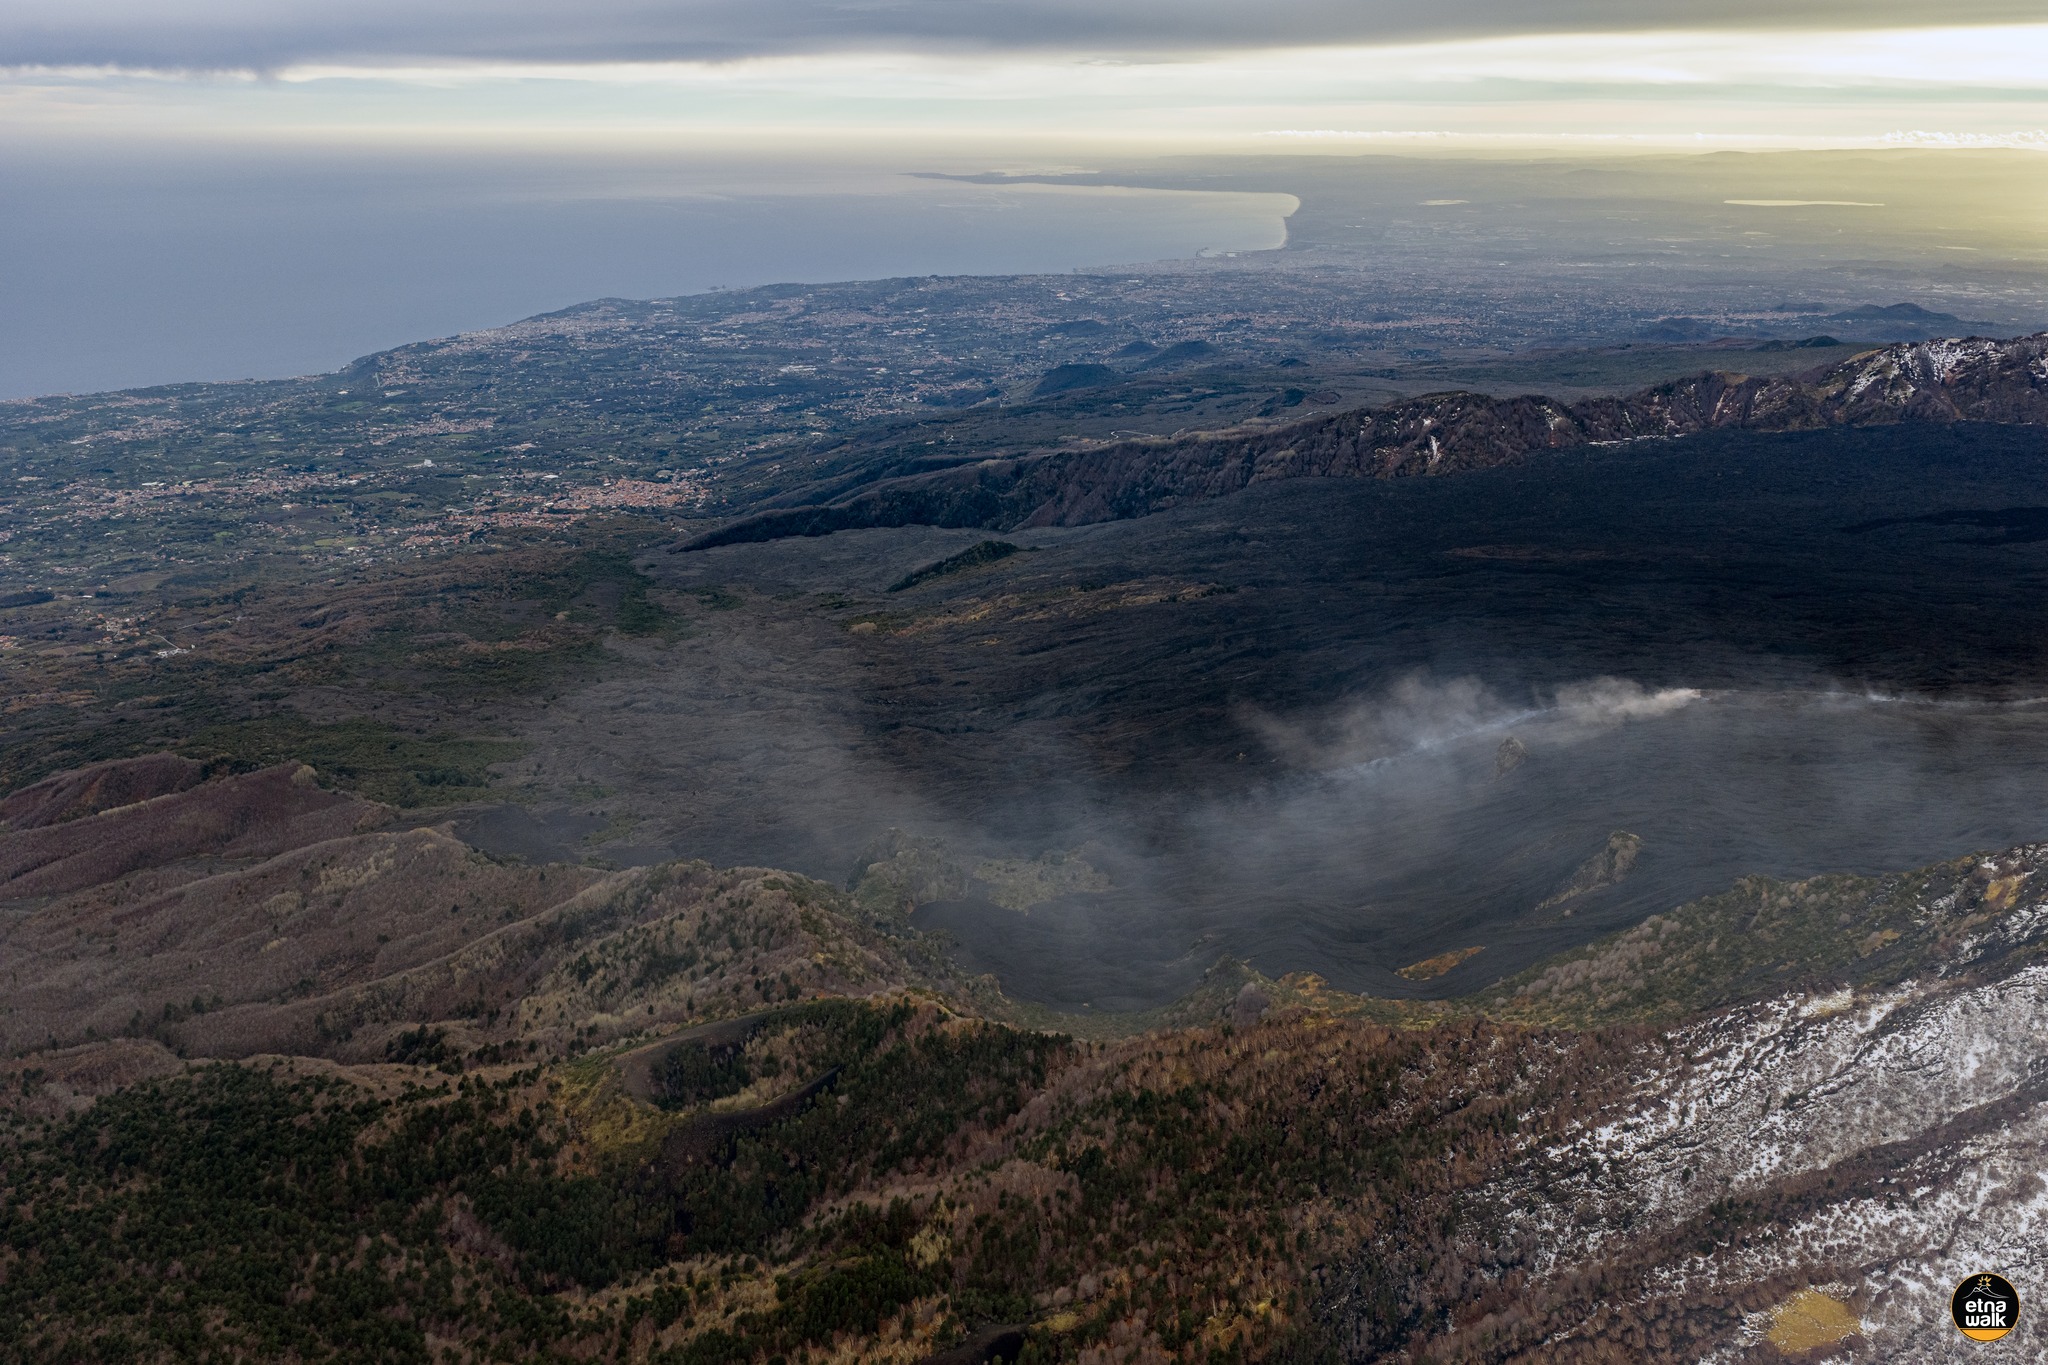
Map of the lava field, created from an orthomosaic and a DEM obtained by processing drone images and the SKYSAT satellite image from January 9, 2026. The shaded relief of the summit area of Mount Etna was obtained from processing drone images acquired in June and October 2025 and January 2026. Geoidal contour lines.
In particular, on January 5 and 6, a new lava flow, partially overlapping the main flow that had been active in the preceding days, reached an altitude of 1365 m, splitting into several branches before stopping between January 6 and 7. Subsequently, the active part of the lava field gradually contracted, and during a survey conducted on January 9, the lava fronts were still located above 1900 m, near Monte Simone. The passage of a severe weather system on January 10 and 11 significantly limited surveillance camera observations, but sporadic lightning was visible at the eruptive vents in the upper part of the Valle del Bove.
By January 9, the lava field had reached a maximum length of 3,150 m and a minimum altitude of 1,365 m, covering an area of 5 × 10⁵ m² and a volume of 4 × 10⁶ m³ (40% margin of error).
Source : INGV.
Photos : Giuseppe Distefano / Etna Walk , INGV.
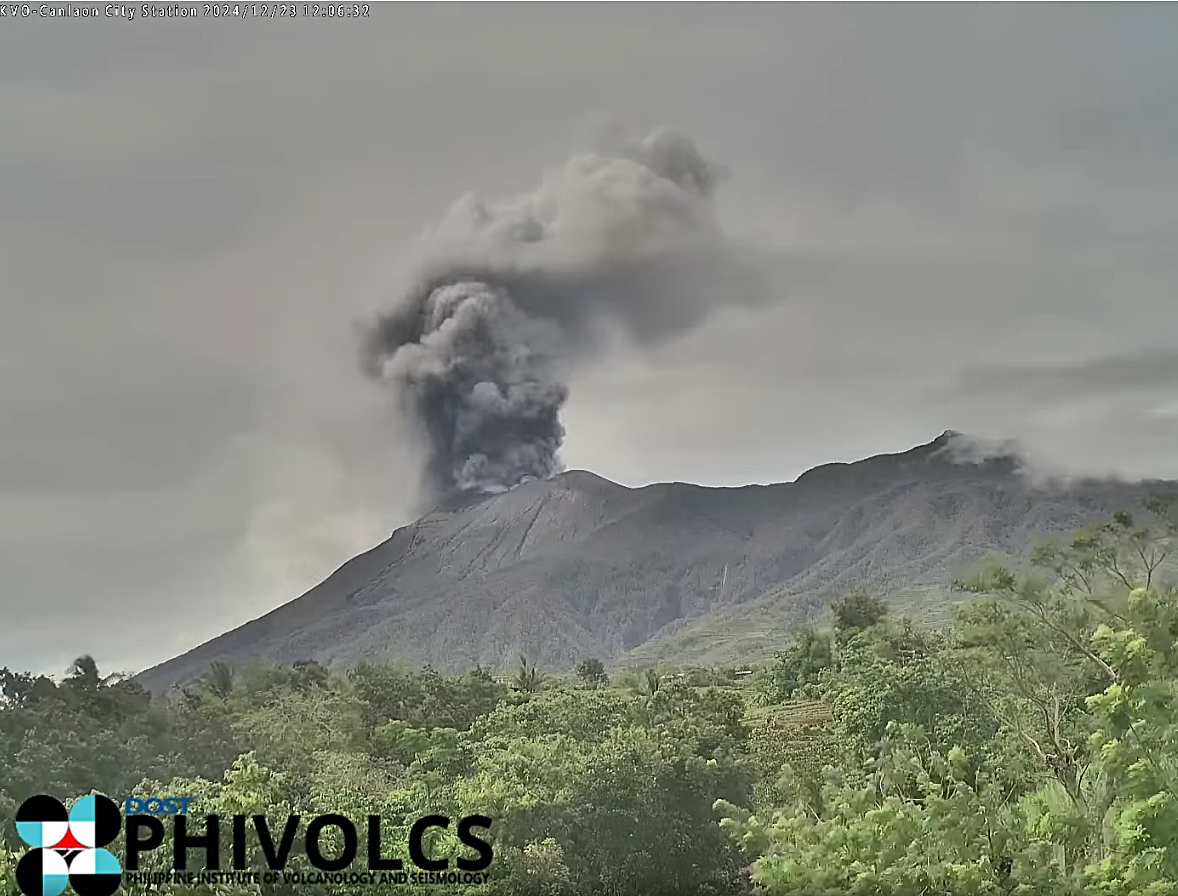
Philippines , Kanlaon :
KANLAON VOLCANO ADVISORY , 14 January 2026 , 11:30 AM
Notice of increased seismic activity at Kanlaon Volcano.
A total of forty-five (45) volcano-tectonic or VT earthquakes have been recorded by the Kanlaon Volcano Network since 12:00 AM today, 14 January 2026. These events ranged in strength between ML 0.6 and ML 3.9 and were generated at 0 to 13 kilometers depths beneath the northwestern flanks of the volcanic edifice. The strongest of these events were reportedly felt at Intensities I to IV in La Carlota City, Bago City and Bacolod City, Negros Occidental and Canlaon City, Negros Oriental. VT earthquakes are generated by rock fracturing processes and the increase in VT activity strongly indicates progressive rock-fracturing beneath the volcano as rising magma or magmatic gas drives a path towards the surface. Volcanic sulfur dioxide (SO2) gas emissions from the summit crater of Kanlaon based on campaign mDOAS measurements yesterday, 13 January 2026, averaged 1,248 tonnes/day, near the medium-term average of 1,767 tonnes/day since 1 January 2026, but earlier rose to 4,126 tonnes/day on 9 January 2026. The overall parameters indicate that renewed magma intrusion is taking place beneath the edifice which could potentially lead to moderately explosive eruption.
The public is reminded that Alert Level 2 prevails over Kanlaon, which means that the volcano is in a state of increased unrest. The increase in VT events could lead to increased chances of steam-driven or phreatic eruptions or short-lived weak to moderately explosive eruptions occurring at the summit that could generate life-threatening volcanic hazards such as pyroclastic density currents or PDCs, ballistic projectiles, ashfall, rockfall and others. It is strongly recommended that communities within the 4-km Permanent Danger Zone or PDZ strictly remain evacuated and those within the 6-km radius from the summit crater be vigilant and ready in case unrest worsens. In addition, increased vigilance against potential syn-eruption lahars and sediment-laden streamflows in channels draining the edifice is strongly advised should intense rains occur during eruptive unrest. Civil aviation authorities must also advise pilots to avoid flying close to the volcano’s summit as ash from any sudden eruption can be hazardous to aircraft.
DOST-PHIVOLCS maintains close monitoring of Kanlaon Volcano and any new development will be immediately communicated to all concerned stakeholders.
Source et photo : DOST-PHIVOLCS
Colombia , Nevado del Ruiz :
Manizales, January 13, 2026, 6:15 PM
Regarding the monitoring of activity at the Nevado del Ruiz volcano, the Colombian Geological Survey (SGC), an agency under the Ministry of Mines and Energy, reports the following:
During the week of January 6-12, 2026, the volcano continued to exhibit unstable behavior. Compared to the previous week, the main variations in monitored parameters were as follows:
– Seismic activity associated with rock fracturing within the volcanic edifice increased, both in the number of recorded earthquakes and in the seismic energy released. The recorded earthquakes were primarily located in the Arenas crater and on the eastern, southeastern, southwestern, and northern flanks of the volcano, within 5 km of the crater and at depths ranging from less than 1 km to 6 km. In addition, several earthquakes were recorded at distances greater than 6 km and up to 12 km from the crater, at depths between 5 km and 8 km. The highest magnitude of the week was 1.2, corresponding to the earthquake recorded on January 7 at 8:15 a.m., located 1 km east-northeast of the crater, at a depth of 3 km below the summit of the volcano.

– Seismicity associated with fluid dynamics in volcanic conduits decreased, both in the number of recorded earthquakes and in seismic energy released. The energy levels of these seismic signals were low. No ash emissions associated with these events were confirmed during the week, due to heavy cloud cover in the region and the low recording of signals associated with this phenomenon.
– The emission of water vapor and volcanic gases, primarily sulfur dioxide (SO₂), into the atmosphere from the Arenas crater was variable and low. The estimated SO₂ flux, associated with degassing processes, decreased compared to the previous week. This decrease can be partially attributed to the high variability in wind direction, which was unfavorable to the measurement stations.
– The gas and water vapor plume remained below 900 m above the summit of the volcano. Regarding its dispersal direction, the plume exhibited a variable pattern, primarily drifting towards the south-southwest, northeast, north-northeast, and southeast flanks of the volcanic structure.
– During satellite monitoring of thermal anomalies at the bottom of Arenas Crater, heavy cloud cover limited their detection; however, some low-energy anomalies were reported.
Source et photo : SGC.