January 29 , 2026.
Alaska , Great Sitkin :
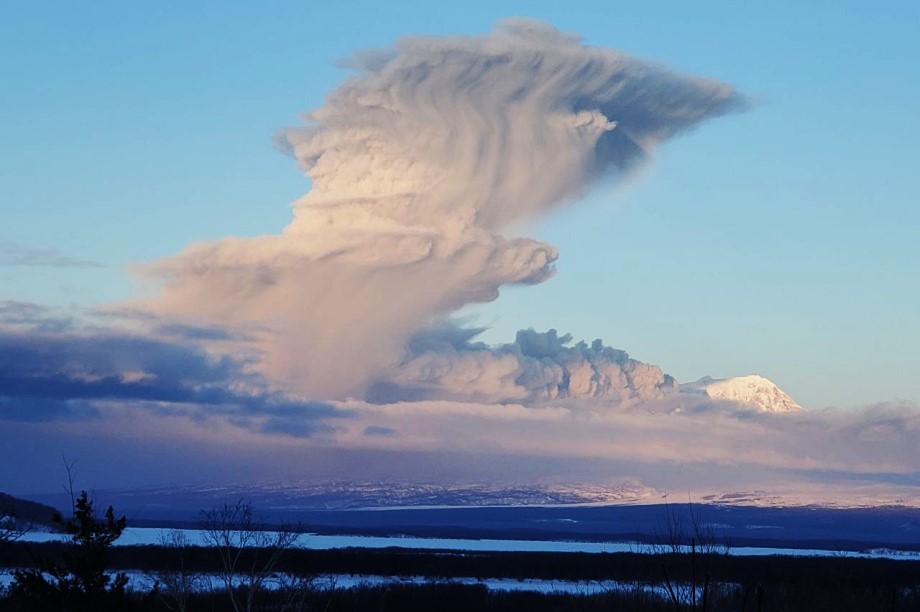
Lava continues to erupt slowly within the summit crater of Great Sitkin Volcano. A few small local earthquakes were detected over the past day. Southward motion of the south flank of the lava dome and associated local rockfalls were observed in satellite radar imagery. Weak steaming from the active lava dome was also observed in otherwise mostly cloudy satellite imagery. Webcam views were obscured by clouds.
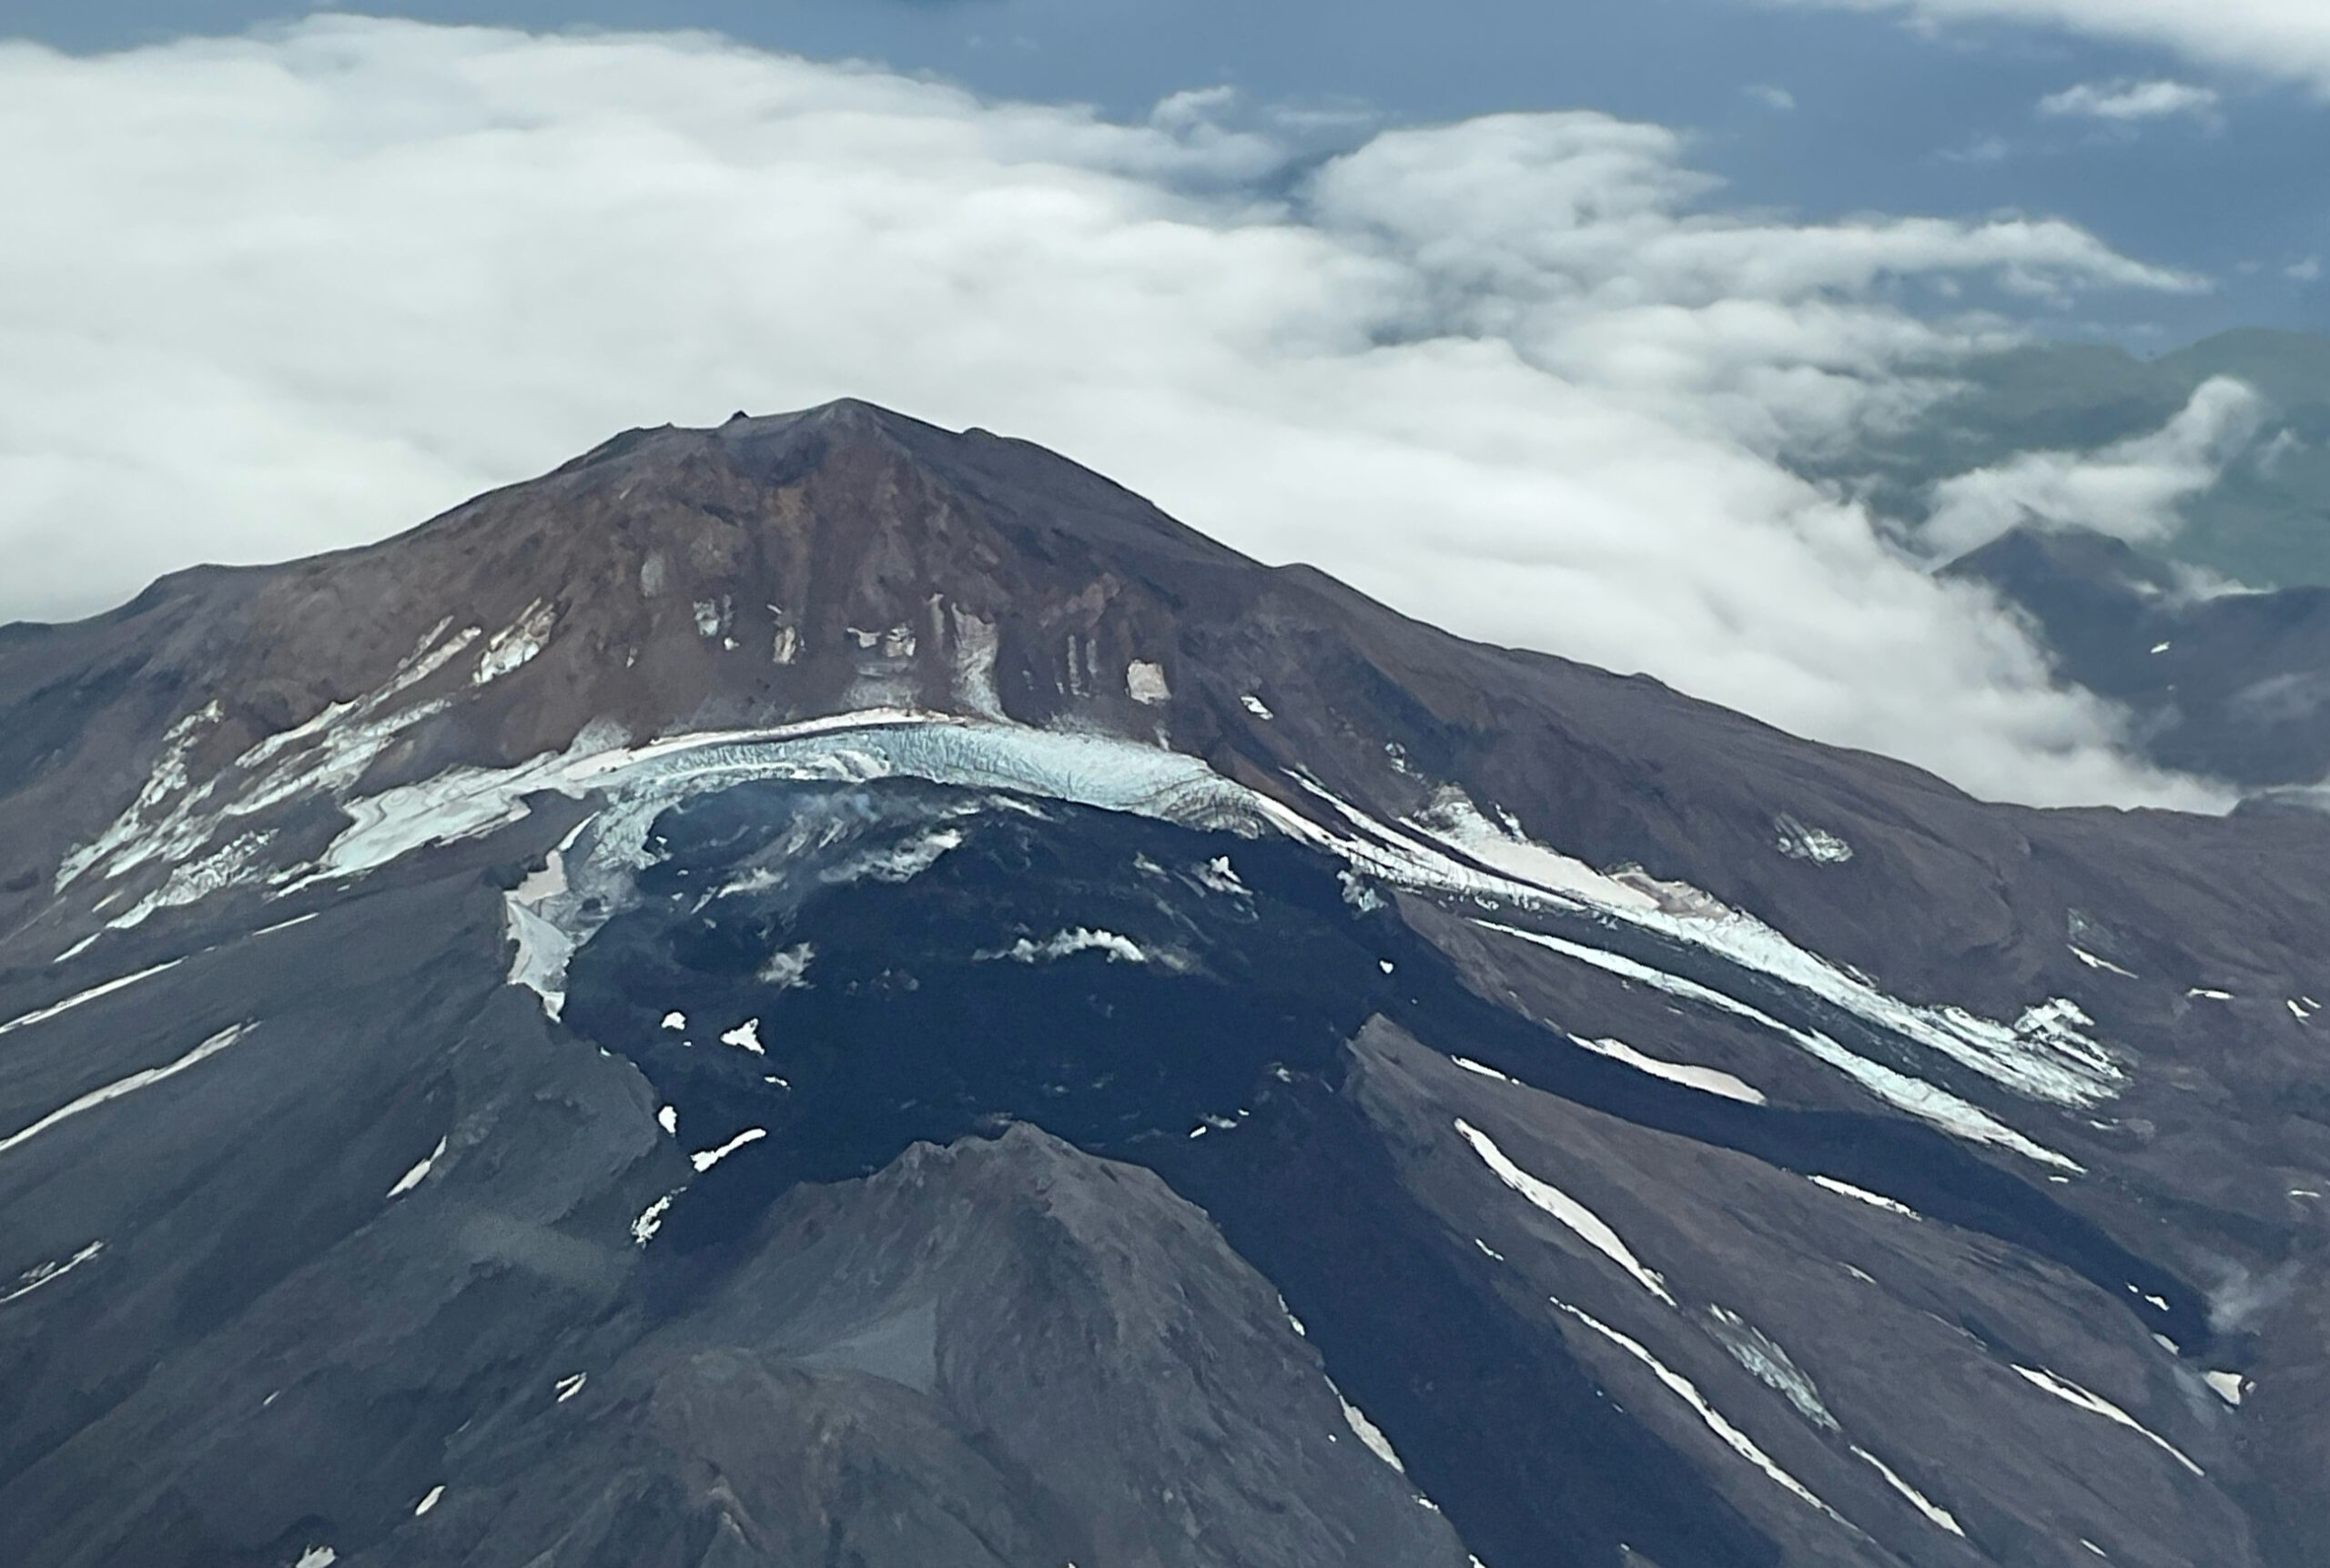
A close up view of the summit crater of Great Sitkin, taken from the air. The currently growing lava flow is steaming in places.
The current lava eruption began in July 2021 and since then has filled most of the summit crater and advanced into valleys below. There have been no explosions at Great Sitkin Volcano since an event in May 2021. The volcano is monitored using local seismic and infrasound sensors, satellite data and webcams, and regional infrasound and lightning networks.
Source : AVO
Photo : McConnell, Angela.
Kamchatka , Sheveluch :
KVERT VOLCANIC ACTIVITY NOTICE (VAN)
Issued: January 29 , 2026
Volcano: Sheveluch (CAVW #300270)
Current aviation colour code: ORANGE
Previous aviation colour code: orange
Source: KVERT
Notice Number: 2026-09
Volcano Location: N 56 deg 38 min E 161 deg 19 min
Area: Kamchatka, Russia
Summit Elevation: 3283 m (10768.24 ft), the dome elevation ~2500 m (8200 ft)
Volcanic Activity Summary:
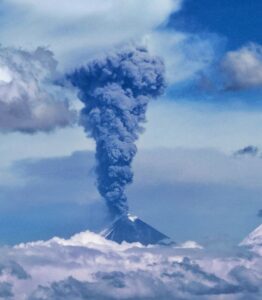
The explosive-extrusive eruption of the volcano continues. A gas emission with ash continues, a plume extended for 35 km to the southwest of the volcano.
The explosive-extrusive eruption of the volcano continues. The danger of ash explosions up to 12 km (39,400 ft) a.s.l. remains. Ongoing activity could affect international and low-flying aircraft.
Volcanic cloud height:
4000 m (13120 ft) AMSL Time and method of ash plume/cloud height determination: 20260129/0050Z – Himawari-9 14m15
Other volcanic cloud information:
Distance of ash plume/cloud of the volcano: 35 km (22 mi)
Direction of drift of ash plume/cloud of the volcano: WSW / azimuth 237 deg
Time and method of ash plume/cloud determination: 20260129/0050Z – Himawari-9 14m15
Start time of explosion and how determined: 20260129/0030Z – Satellite data
Duration of explosion: ~ 2 hr
Source : KVERT.
Photo : Yu. Demyanchuk. ( via kamtoday . ru )
Indonesia , Ibu :
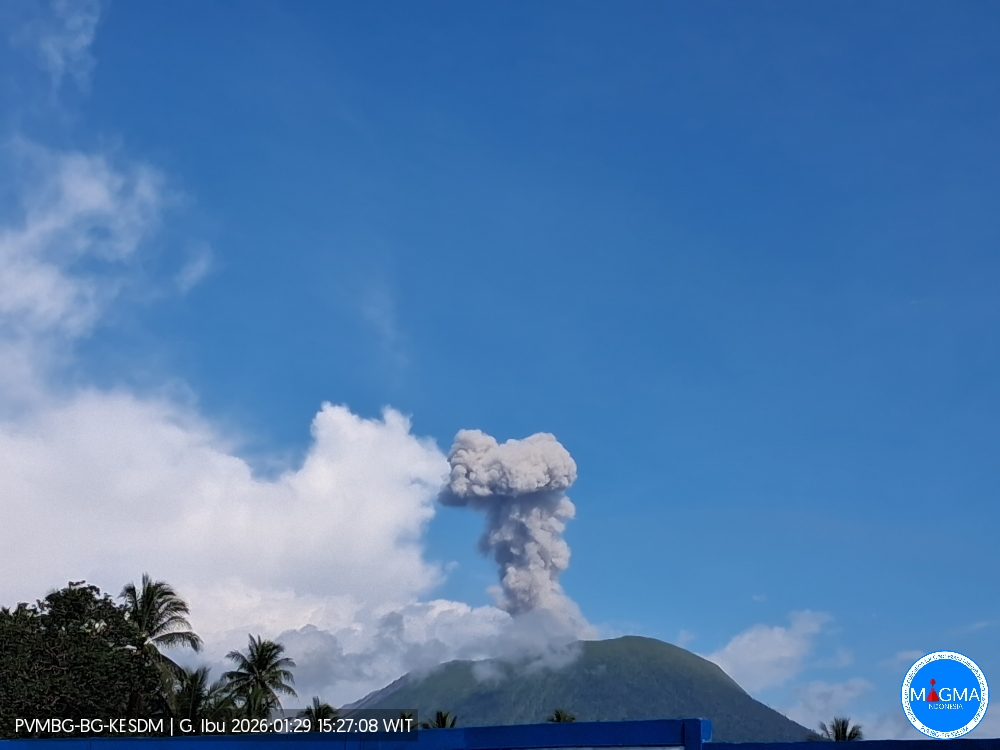
Mount Ibu erupted on Thursday, January 29, 2026, at 3:24 PM WIT. An ash column was observed approximately 700 meters above the summit (at an altitude of about 2,025 meters). This ash column, white to gray in color, was moderately to strongly intense and drifted northeast. The eruption was recorded by a seismograph, with a maximum amplitude of 28 mm and a duration of 38 seconds.
VOLCANO OBSERVATORY NOTICE FOR AVIATION – VONA
Issued : January 29 , 2026
Volcano : Ibu (268030)
Current Aviation Colour Code : ORANGE
Previous Aviation Colour Code : orange
Source : Ibu Volcano Observatory
Notice Number : 2026IBU038
Volcano Location : N 01 deg 29 min 17 sec E 127 deg 37 min 48 sec
Area : North Maluku, Indonesia
Summit Elevation : 4240 FT (1325 M)
Volcanic Activity Summary :
Eruption with volcanic ash cloud at 06h24 UTC (15h24 local).
Volcanic Cloud Height :
Best estimate of ash-cloud top is around 6480 FT (2025 M) above sea level or 2240 FT (700 M) above summit. May be higher than what can be observed clearly. Source of height data: ground observer.
Other Volcanic Cloud Information :
Ash cloud moving to northeast. Volcanic ash is observed to be white to gray. The intensity of volcanic ash is observed from medium to thick.
Remarks :
Eruption recorded on seismogram with maximum amplitude 28 mm and maximum duration 38 second.
Source et photo : PVMBG.
Colombia , Nevado del Ruiz :
Manizales, January 27, 2026, 2:30 PM
Regarding the monitoring of activity at the Nevado del Ruiz volcano, the Colombian Geological Survey (SGC), an agency under the Ministry of Mines and Energy, reports the following:
During the week of January 20-26, 2026, the volcano continued to exhibit unstable behavior. The main variations in monitored parameters compared to the previous week are as follows:
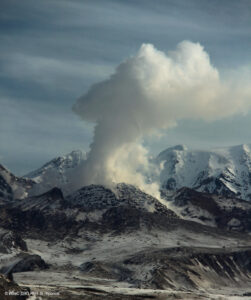
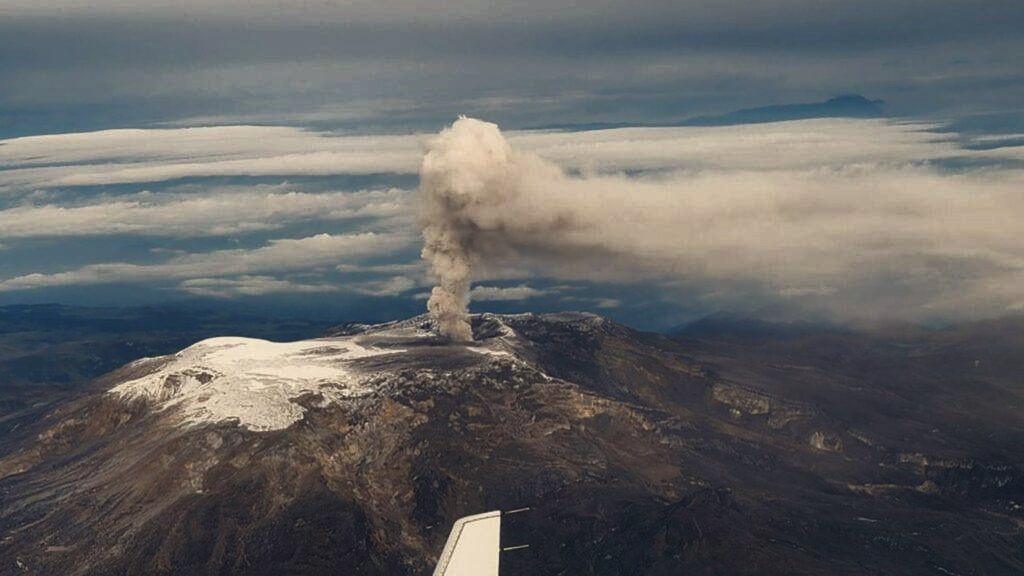
– Seismicity associated with fluid dynamics within the volcanic conduits increased, both in the number of recorded earthquakes and in the seismic energy released. These were primarily short-duration signals associated with pulsatile ash emissions, ranging from low to occasionally moderate energy. Long-duration, low-energy signals also continued to be recorded, some of which were slightly higher than those recorded in previous weeks. The use of cameras (conventional or thermographic) to monitor the volcano has confirmed several pulsatile ash emissions, as well as variations in the apparent temperature of the materials emitted during these emissions.
Seismic activity associated with rock fracturing within the volcanic edifice increased, both in the number of recorded earthquakes and in the seismic energy released. The earthquakes were primarily located in the Arenas crater, at depths of up to 2 km, and on the volcano’s western, eastern, and southeastern flanks, within 4 km of the crater and at depths between 2 and 7 km. Less frequent and sporadic earthquakes occurred on the other flanks of the volcano, at distances of up to 13 km from the crater and at depths between 2 and 7 km. The largest earthquake of the week, with a magnitude of 2.2, was recorded on January 24, during a period of increased seismic activity in the volcano’s northwest sector. This value corresponded to the earthquake recorded at 9:04 a.m., located 3 km from the crater and at a depth of 6 km from the volcano’s summit.
The emission of water vapor and volcanic gases, primarily sulfur dioxide (SO₂), into the atmosphere continued through the Arenas crater. Daily estimates of the SO₂ flux showed variability, with values slightly lower than those of the previous week. SO₂ levels remained low because wind direction and speed did not allow for optimal measurements at the monitoring stations. Additional satellite monitoring also revealed low levels of SO₂ emissions. The vertical height of the column of gas, steam, or ash remained below 700 m above the volcano’s summit for most of the time, while its dispersal reached up to 1,000 m during the ash emission at 6:51 p.m. on January 24. As for the direction of dispersal, the column spread toward different flanks of the volcano, primarily toward the south-southwest and southwest flanks.
Thermal anomalies at the bottom of the Arenas crater remained weak. Satellite monitoring continued to be limited by the thick cloud cover in the volcanic area.
Source et photo : SGC.
Hawaii , Kilauea :
HAWAIIAN VOLCANO OBSERVATORY DAILY UPDATE , U.S. Geological Survey
Wednesday, January 28, 2026, 9:27 AM HST (Wednesday, January 28, 2026, 19:27 UTC)
19°25’16 » N 155°17’13 » W,
Summit Elevation 4091 ft (1247 m)
Current Volcano Alert Level: WATCH
Current Aviation Color Code: ORANGE
Activity Summary:
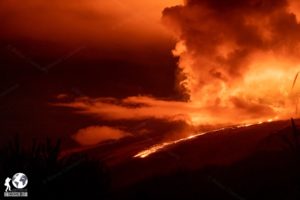
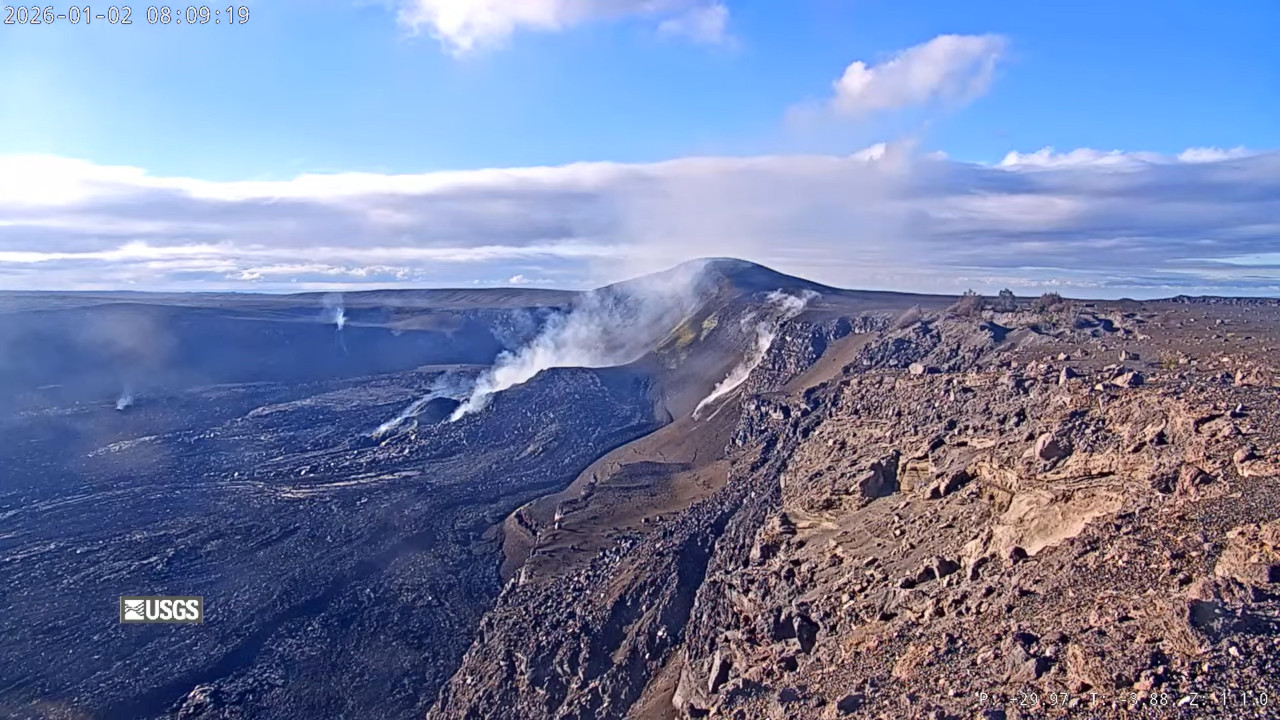
The Halemaʻumaʻu eruption of Kīlauea is paused. Intermittent glow was visible overnight from both vents. Summit inflation and seismic tremor continued over the past 24 hours. Based on preliminary data, the current forecast for the onset of episode 42 lava fountaining is between February 9 and 20. No significant activity has been noted along Kīlauea’s East Rift Zone or Southwest Rift Zone.
Summit Observations:
Intermittent moderate glow from the south vent and intermittent minor glow from the north vent was visible on webcams overnight.
The Uēkahuna tiltmeter (UWD) has recorded 9 microradians of inflation since the end of episode 41, including 1 microradian of invlation in the past 24 hours.
Seismic tremor continued in the past 24 hours with 2-3 pulses of increased tremor about every ten minutes. About 3 earthquakes were located beneath Kīlaueaʻs summit in the past 24 hours.
The sulfur dioxide (SO2) emission rate from the summit was last measured on January 14 at 1,550 tonnes per day, which is within the typical range of 1,000 to 5,000 tonnes of SO2 per day observed during previous eruptive pauses. This is considerably lower than rates observed during lava fountaining episodes.
Rift Zone Observations:
Rates of seismicity and ground deformation remain very low in the East Rift Zone and Southwest Rift Zone. SO2 emissions from the East Rift Zone remain below the detection limit.
Source et photo : HVO.