February 11 , 2026.
Italy , Stromboli :
WEEKLY BULLETIN from: February 2, 2026 to February 8, 2026. (Issuance date: February 10, 2026)
ACTIVITY SUMMARY
Based on monitoring data, the following points should be noted:
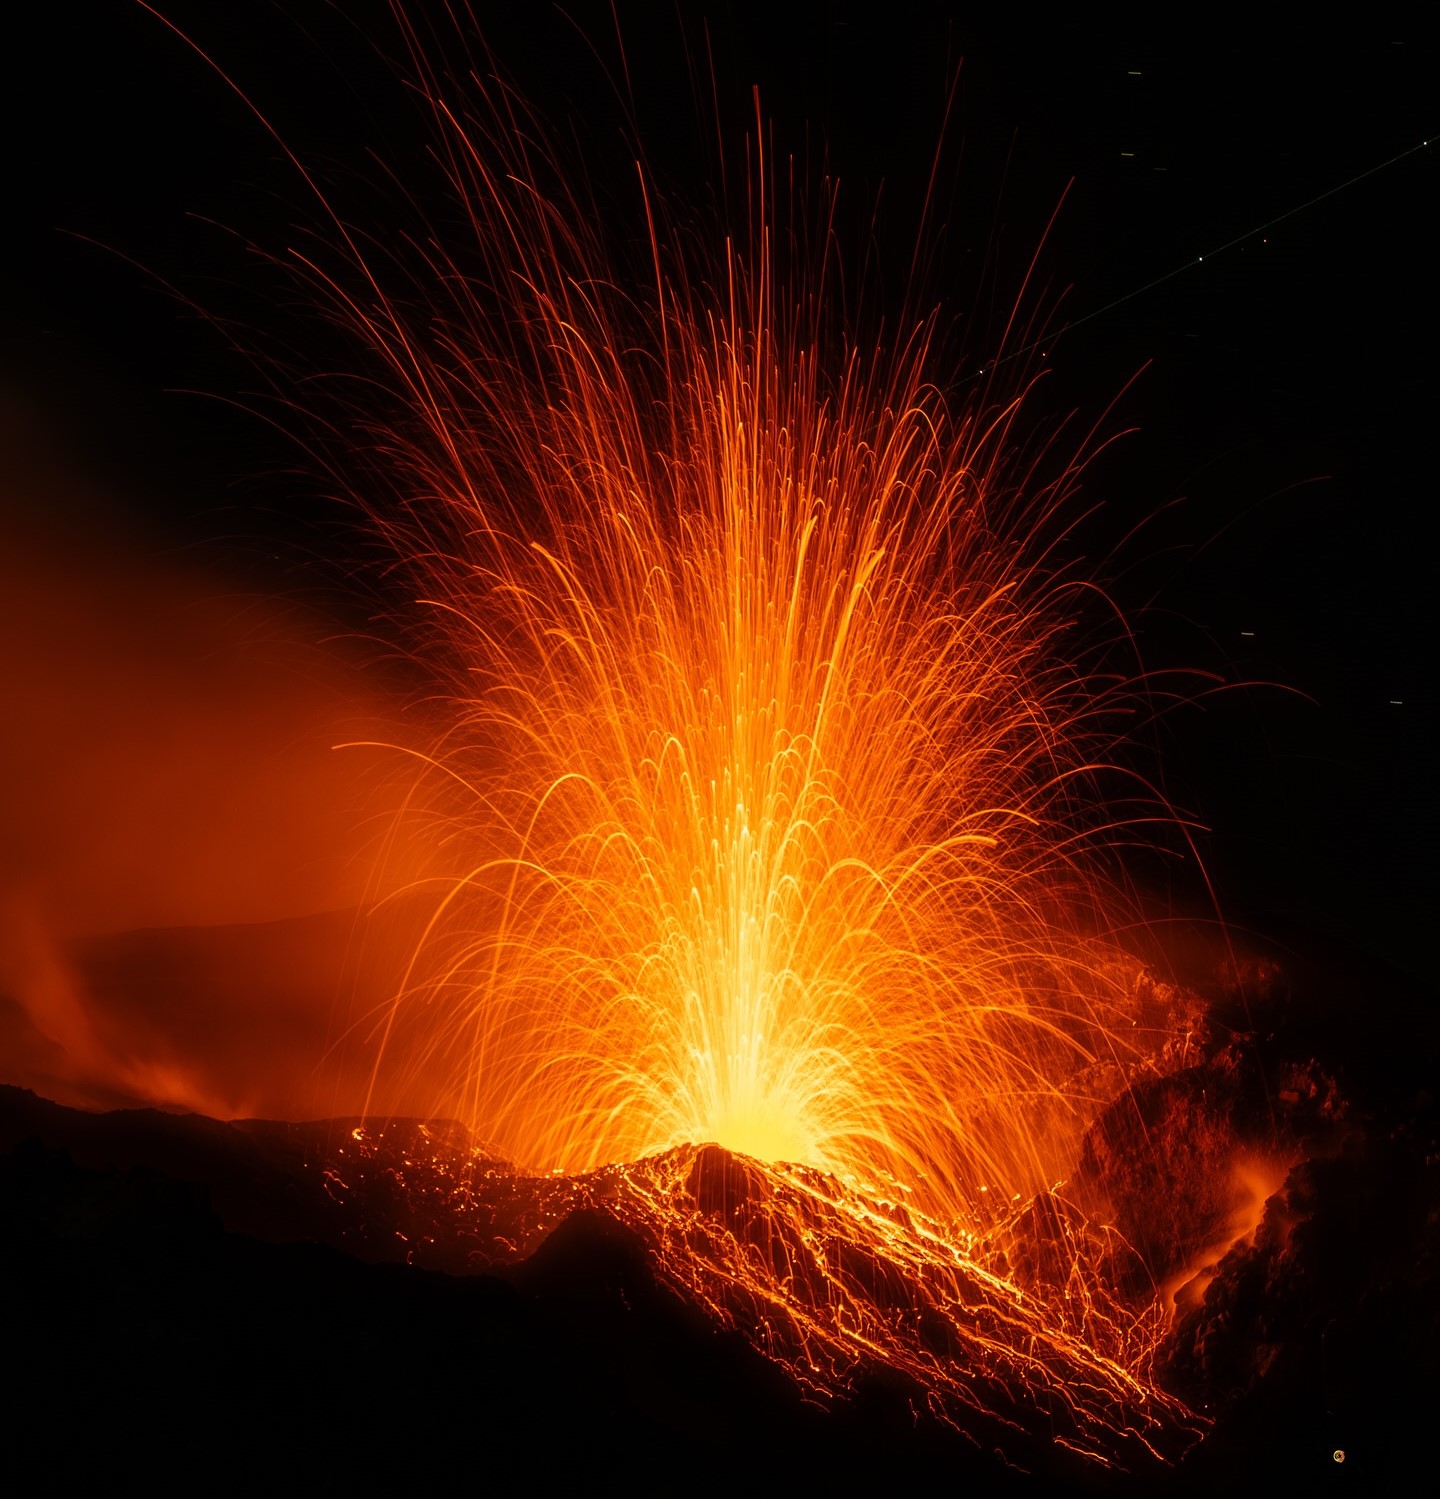
1) VOLCANOLOGICAL OBSERVATIONS: During this period, ordinary Strombolian-type eruptive activity was observed. The total hourly frequency fluctuated between average values (13 events/h) and high values (21 events/h). The intensity of the explosions was mainly low to medium in the North and Central-South crater areas.
2) SEISMOLOGY: The monitored seismic parameters showed no significant changes.
3) GROUND DEFORMATION: The ground deformation monitoring networks showed no significant changes. The tilt measurement network is still affected by disturbances that compromise its reliability.
4) GEOCCHEMISTRY: Average SO₂ flux.
High CO₂ flux from the ground in the Pizzo area (STR02).
Average C/S ratio in the pen.
Dissolved helium isotope ratio (R/Ra) in the thermal aquifer: no update. Last data: December 2, 2025 (high value: 4.44).
CO₂ flux from the ground in the San Bartolo area: average to high values.
CO₂ flux from the ground in the Scari area: near stable (average value).
5) SATELLITE OBSERVATIONS: Satellite-observed thermal activity in the summit area was generally low, with a few isolated thermal anomalies of moderate intensity.
VOLCANOLOGICAL OBSERVATIONS
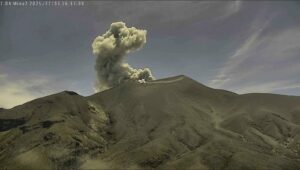
During the observation period, Stromboli’s eruptive activity was characterized by analyzing images recorded by the INGV-OE monitoring cameras located at 190 m (SCT-SCV) and at Punta dei Corvi (SPCT). Explosive activity was primarily produced by five eruptive vents located in the northern zone of the crater and by at least two vents located in the central-southern zone.
Due to heavy cloud cover on February 5, 6, and 7, the crater terrace was not visible for a sufficient number of hours to accurately describe the eruptive activity.
Observations of explosive activity captured by the monitoring cameras
In the northern (N) zone of the crater, five active vents were observed: two in sector N1 and three in sector N2. These vents produced explosive activity of low intensity (less than 80 m high) and medium intensity (less than 150 m high). The eruptive products were primarily coarse materials (bombs and lapilli).
The average frequency of explosions ranged from 12 to 18 events per hour.
In the Central-South (CS) crater area, two main vents were observed, exhibiting explosions of fine material mixed with coarse material, ranging from low to medium intensity. The average frequency of explosions ranged from -1 to 4 events per hour.
Source : INGV.
Photo : Stromboli stati d’animo / Sebastiano Cannavo .
Italy / Sicily , Etna :
WEEKLY BULLETIN from: February 2, 2026 to February 8, 2026. (Issuance date: February 10, 2026)
ACTIVITY SUMMARY
Based on monitoring data, the following points should be noted:
1) VOLCANOLOGICAL OBSERVATIONS: Degassing at varying rates at summit craters.
2) SEISMOLOGY: Low seismic activity due to fracturing. Tremor amplitude generally low.
3) INFRASOUND: Low infrasound activity.
4) GROUND DEFORMATION: Ground deformation monitoring networks did not show significant variations during the week.
5) GEOCHEMISTRY: SO₂ flux at an average level.
Soil CO₂ flux (EtnaGas Network): average values. Partial pressure of dissolved CO₂ in groundwater (EtnaWater Network): no update.
Helium isotope ratio at peripheral sites: average values (latest data from January 28, 2026).
6) SATELLITE OBSERVATIONS: Over the past week, thermal activity observed by satellite in the summit area has generally been low.
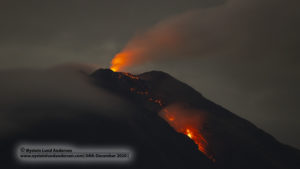
VOLCANOLOGICAL OBSERVATIONS
During the week in question, monitoring of Mount Etna’s volcanic activity was carried out through the analysis of images from the surveillance cameras of the INGV-Etneo Observatory (INGV-OE).
Observations from the surveillance cameras were irregular due to adverse weather conditions at the summit.
Cloud cover and strong winds present at the summit for almost the entire study period severely limited observations of volcanic activity. During the rare clearings above the summit crater, such as on February 9, gas emissions of varying intensity were observed in the craters.
Source : INGV.
Photo : INGV.
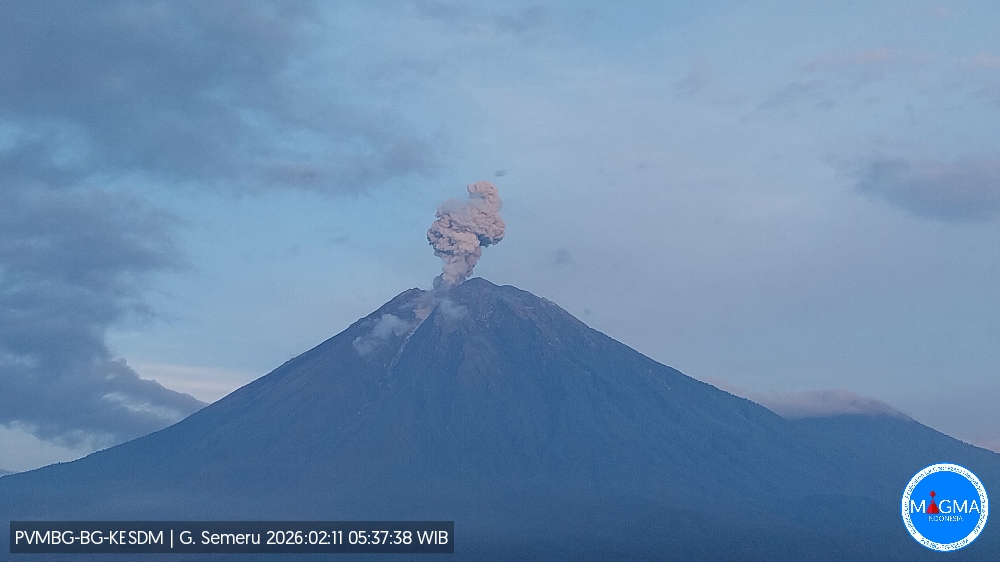
Indonesia , Semeru :
Mount Semeru experienced an eruption on Wednesday, February 11, 2026 at 5:36 AM WIB. An ash column was observed approximately 1,000 meters above the summit (at an altitude of about 4,676 meters). This ash column, white to gray in color, was of moderate intensity and directed towards the northeast. At the time of writing, the eruption was still ongoing.
VOLCANO OBSERVATORY NOTICE FOR AVIATION – VONA
Issued : February 11 , 2026
Volcano : Semeru (263300)
Current Aviation Colour Code : ORANGE
Previous Aviation Colour Code : orange
Source : Semeru Volcano Observatory
Notice Number : 2026SMR300
Volcano Location : S 08 deg 06 min 29 sec E 112 deg 55 min 12 sec
Area : East java, Indonesia
Summit Elevation : 11763 FT (3676 M)
Volcanic Activity Summary :
Eruption with volcanic ash cloud at 22h36 UTC (05h36 local).
Volcanic Cloud Height :
Best estimate of ash-cloud top is around 14963 FT (4676 M) above sea level or 3200 FT (1000 M) above summit. May be higher than what can be observed clearly. Source of height data: ground observer.
Other Volcanic Cloud Information :
Ash cloud moving to northeast. Volcanic ash is observed to be white to gray. The intensity of volcanic ash is observed to be medium.
Remarks :
Eruption recorded on seismogram with maximum amplitude 22 mm and maximum duration 116 second.
Source et photo : Magma Indonésie .
Colombia , Chiles / Cerro Negro :
San Juan de Pasto, February 10, 2026, 3:30 PM
Regarding the monitoring of activity at the Chiles-Cerro Negro Volcanic Complex (CVCCN), the Colombian Geological Survey (SGC), an agency under the Ministry of Mines and Energy, reports the following:
During the period from February 3 to 9, 2026, the main variations in monitored parameters compared to the previous week were as follows:
● Within the context of fluctuating seismic activity, a decrease was recorded in both the number of seismic events and the energy released.
Seismicity associated with rock fracturing processes remained predominant, followed by seismicity related to fluid dynamics.
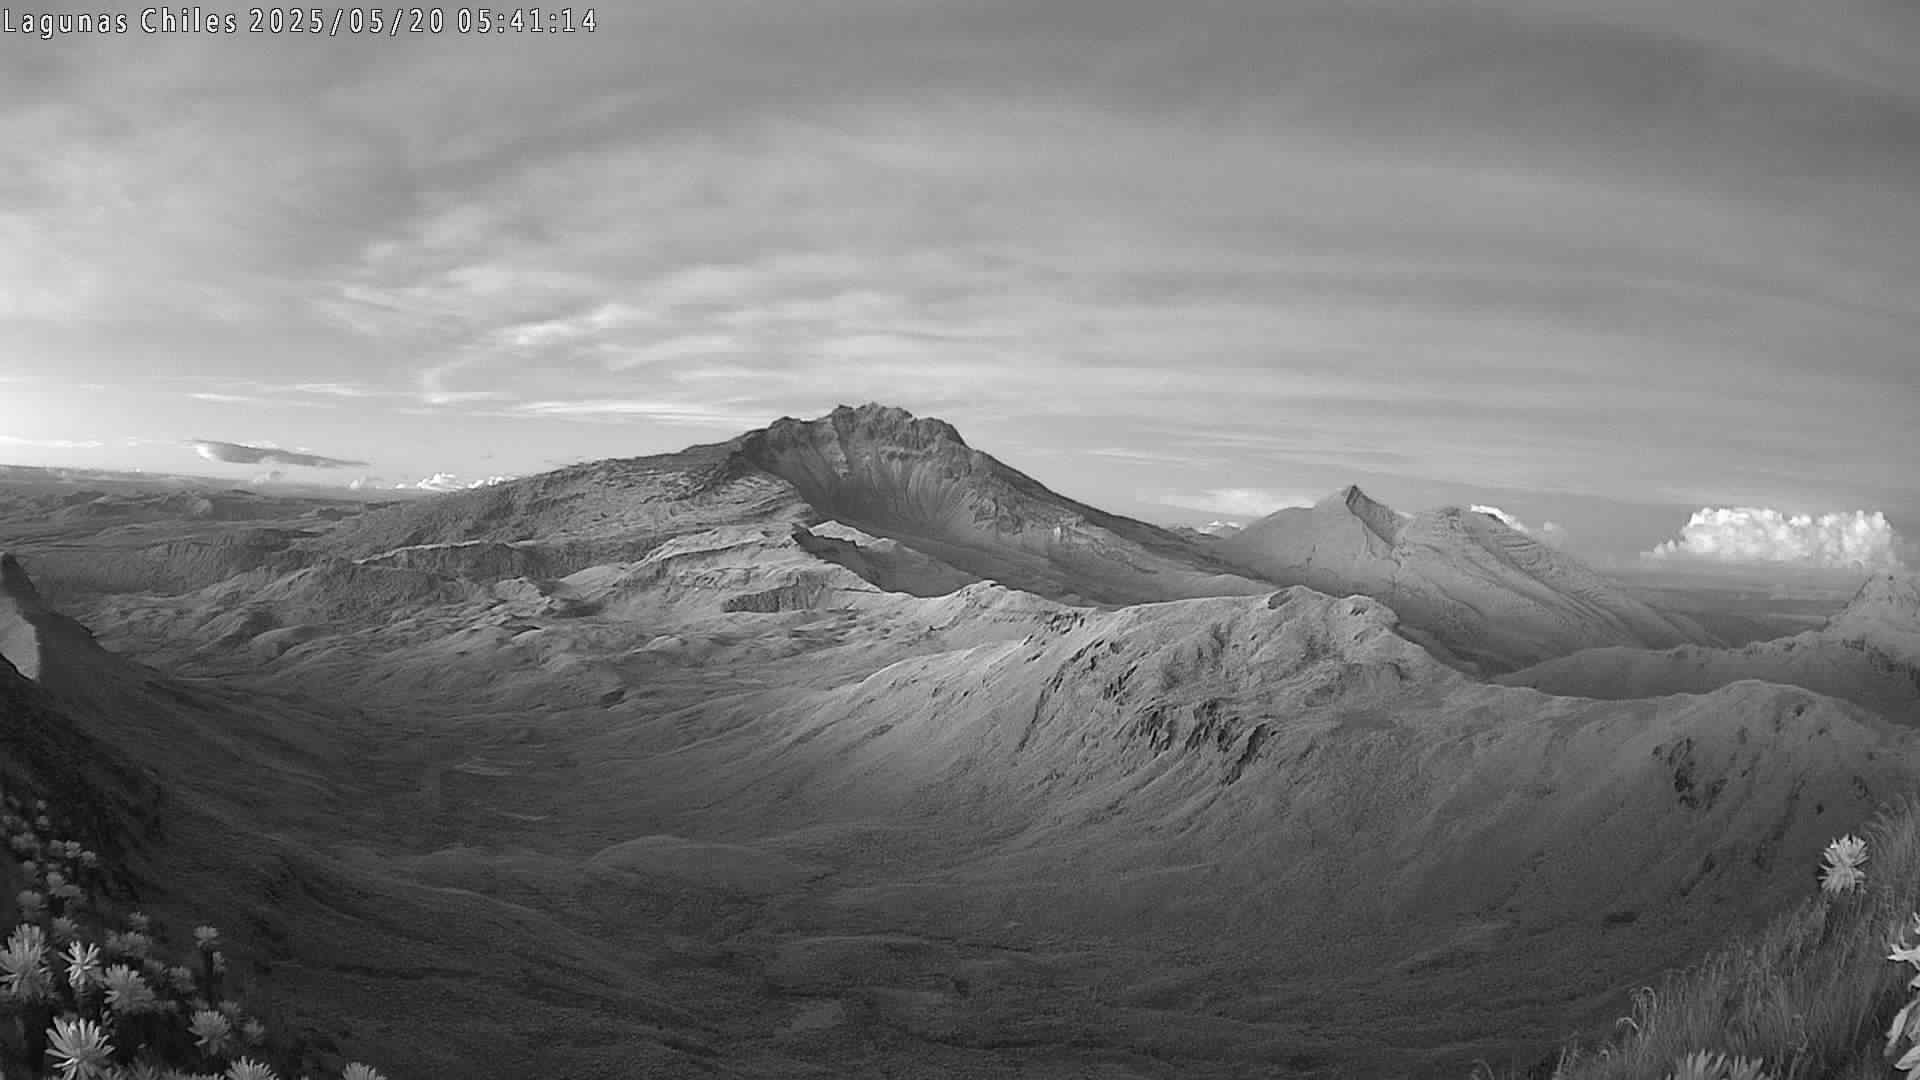
● Most of the localized earthquakes were concentrated at the summit of Chiles Volcano and along its western and southern flanks; two occurred in the northwest sector. Depths generally ranged from 1.6 to 7.1 km below the summit (4,700 m altitude). The maximum magnitude of 2.1 was recorded on February 3 at 3:57 p.m., with an epicenter northwest of the Chiles summit and a depth of 4.5 km. No tremors were reported.
● Analysis of data collected by satellite sensors and ground stations continues to reveal variations related to deformation processes in the volcanic zone.
Based on the assessment and correlation of monitored parameters, the Geological Survey of Colombia (SGC) recommends closely monitoring the evolving situation by consulting weekly bulletins and other information published through its official channels, as well as instructions from local and departmental authorities and the National Disaster Risk Management Unit (UNGRD).
Volcanic activity remains at the yellow alert level: active volcano exhibiting changes in the baseline behavior of monitored parameters and other manifestations.
Source et photo : SGC.
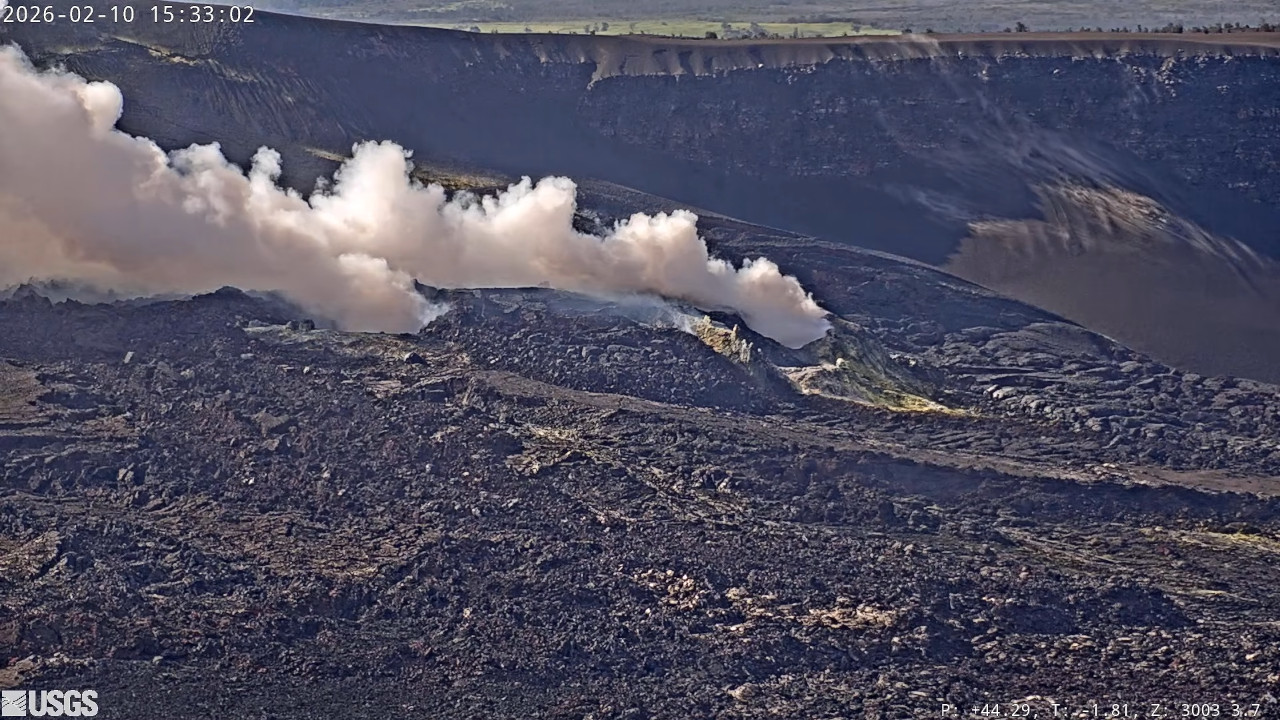
Hawaii , Kilauea :
HAWAIIAN VOLCANO OBSERVATORY DAILY UPDATE , U.S. Geological Survey
Tuesday, February 10, 2026, 9:40 AM HST (Tuesday, February 10, 2026, 19:40 UTC)
19°25’16 » N 155°17’13 » W,
Summit Elevation 4091 ft (1247 m)
Current Volcano Alert Level: WATCH
Current Aviation Color Code: ORANGE
Activity Summary:
The Halemaʻumaʻu eruption of Kīlauea is paused. Summit inflation switched to deflation yesterday morning, and deflation continues today. Glow at both the south and north vents was visible in the webcams overnight. The forecast for the onset of episode 42 lava fountaining is between February 12 and 15 based on current models of summit deformation.
No significant activity has been noted along Kīlauea’s East Rift Zone or Southwest Rift Zone.
Summit Observations:
Moderate glow was visible at the south and north vents overnight in the webcams.
Seismic tremor continued over the past 24 hours and has been relatively steady over the past day. Earthquake activity was low.
The Uēkahuna tiltmeter (UWD) showed the onset of deflationary tilt yesterday morning, and deflation continues today. Total deflation in the past day is slightly over 2.5 microradians. This deflation interrupts the inflationary trend since the end of episode 41, with a total of 24.7 microradians of inflationary tilt since the end of that episode.
The sulfur dioxide (SO2) emission rate from the summit was last measured on February 2 at 5,172 tonnes per day, which is slightly higher than the typical range of 1,000 to 5,000 tonnes of SO2 per day observed during previous eruptive pauses. This is considerably lower than rates observed during lava fountaining episodes. This morning, webcams show that the plume from the summit vents is being carried to the southwest. The National Weather Service forecast indicates north northeast winds at 24-29 mph this morning, decreasing to 15-20 mph in the afternoon.
Rift Zone Observations:
Rates of seismicity and ground deformation remain very low in the East Rift Zone and Southwest Rift Zone. SO2 emissions from the East Rift Zone remain below the detection limit.
Source et photo : HVO.