March 08 , 2024.
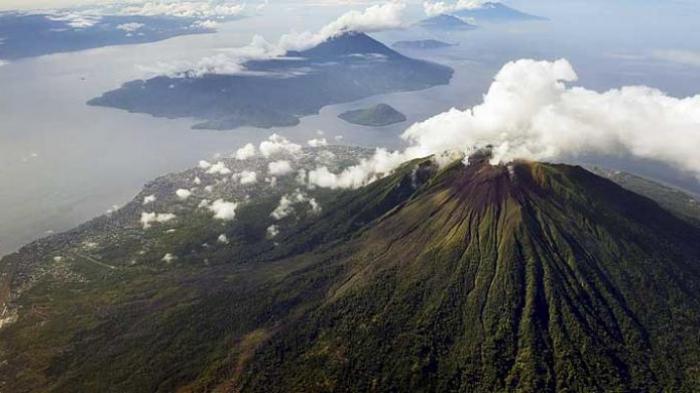
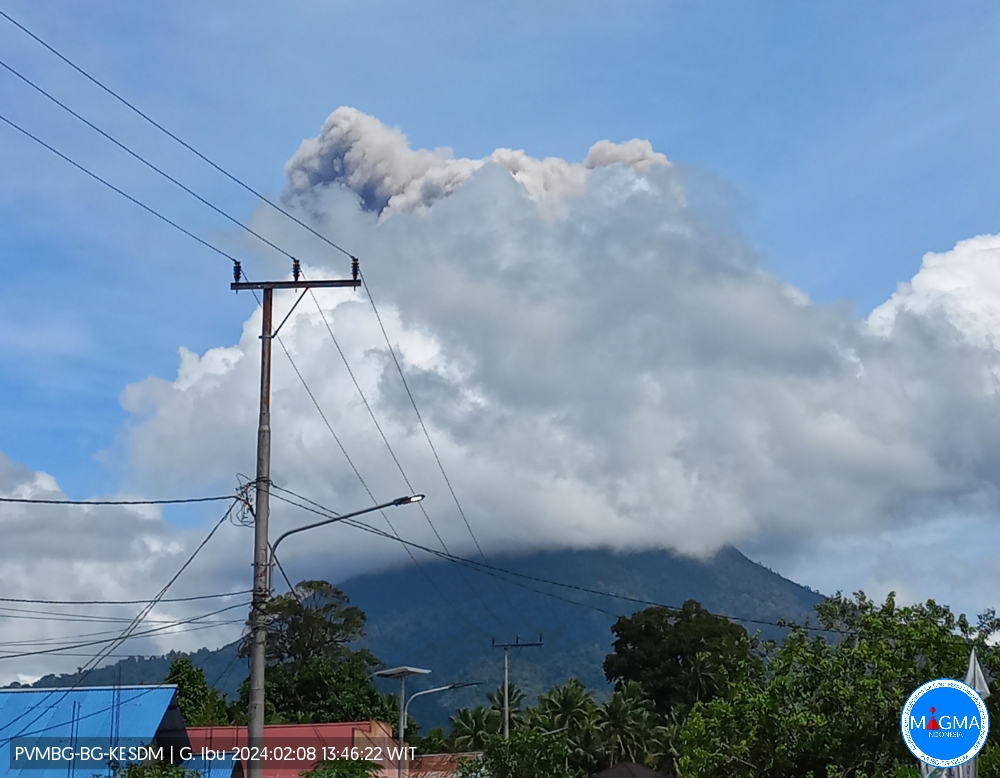
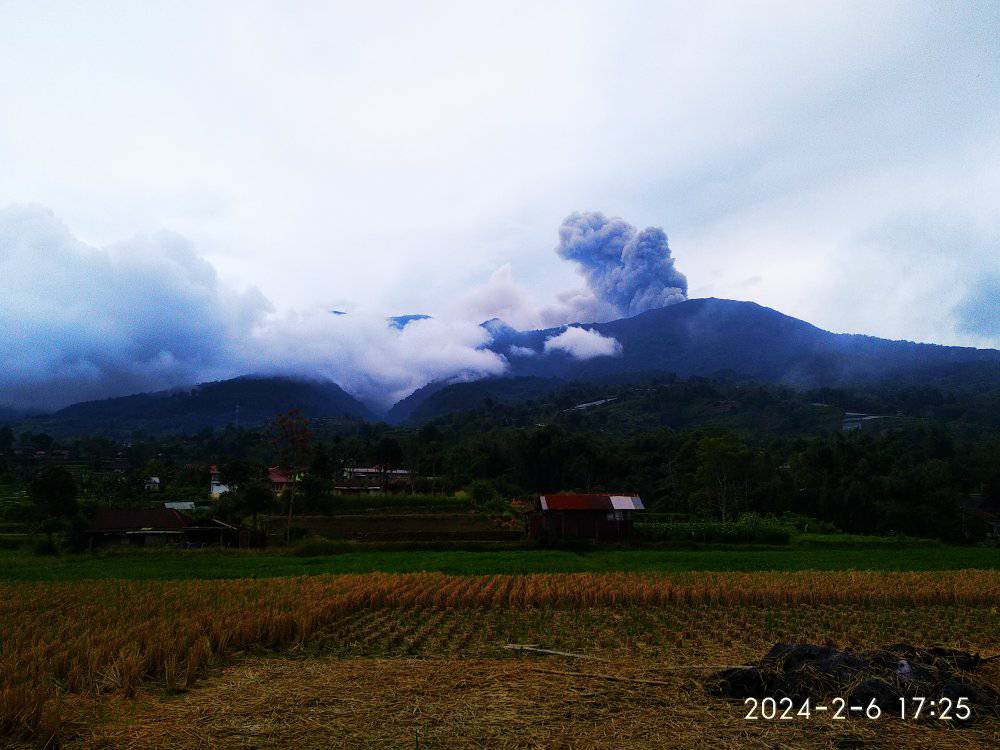
Indonesia , Ili Lewotolok :
An eruption of Mount Ili Lewotolok occurred on Thursday, March 7, 2024 at 1:29 p.m. WITA with the height of the ash column observed at ± 800 m above the summit (± 2223 m above sea level). The ash column was observed to be gray with thick intensity, oriented towards the East. This eruption was recorded on a seismograph with a maximum amplitude of 4.6 mm and a duration of 49 seconds.
SEISMICITY OBSERVATIONS:
82 emission earthquakes with an amplitude of 2 to 15.7 mm and earthquake duration of 20 to 218 seconds.
1 Non-harmonic tremor with an amplitude of 3.8 mm and an earthquake duration of 321 seconds.
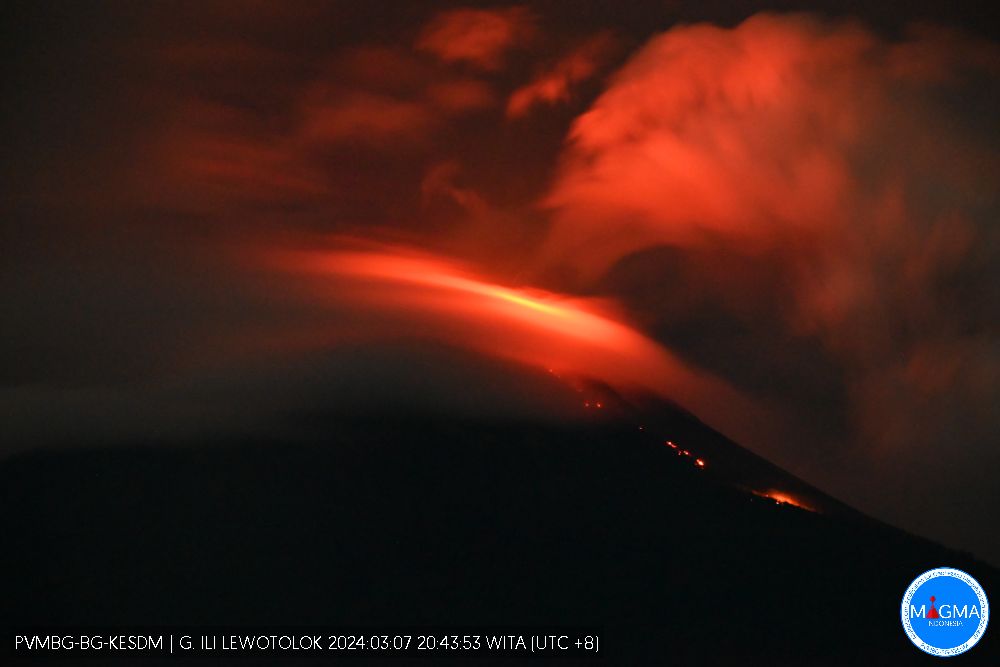
PVMBG reported that the eruption at Lewotolok continued during 28 February-5 March. Daily white-and-gray ash plumes rose as high as 900 m above the summit and drifted NW, E, and SE. The lava flow on the SE flank was 2 km long and the flow on the S flank was 600 m long; the distal end of the longer flow did not advance, though lava effusion continued, and new flows possibly overlapped the older flows. The Alert Level remained at 3 (on a scale of 1-4) and the public was warned to stay 2 km away from the vent and 3 km away from the vent on the S and SE flank. According to a news article residents were asked to bring their livestock into the villages.
Source : Magma Indonésie. GVP.
Photo : PVMBG
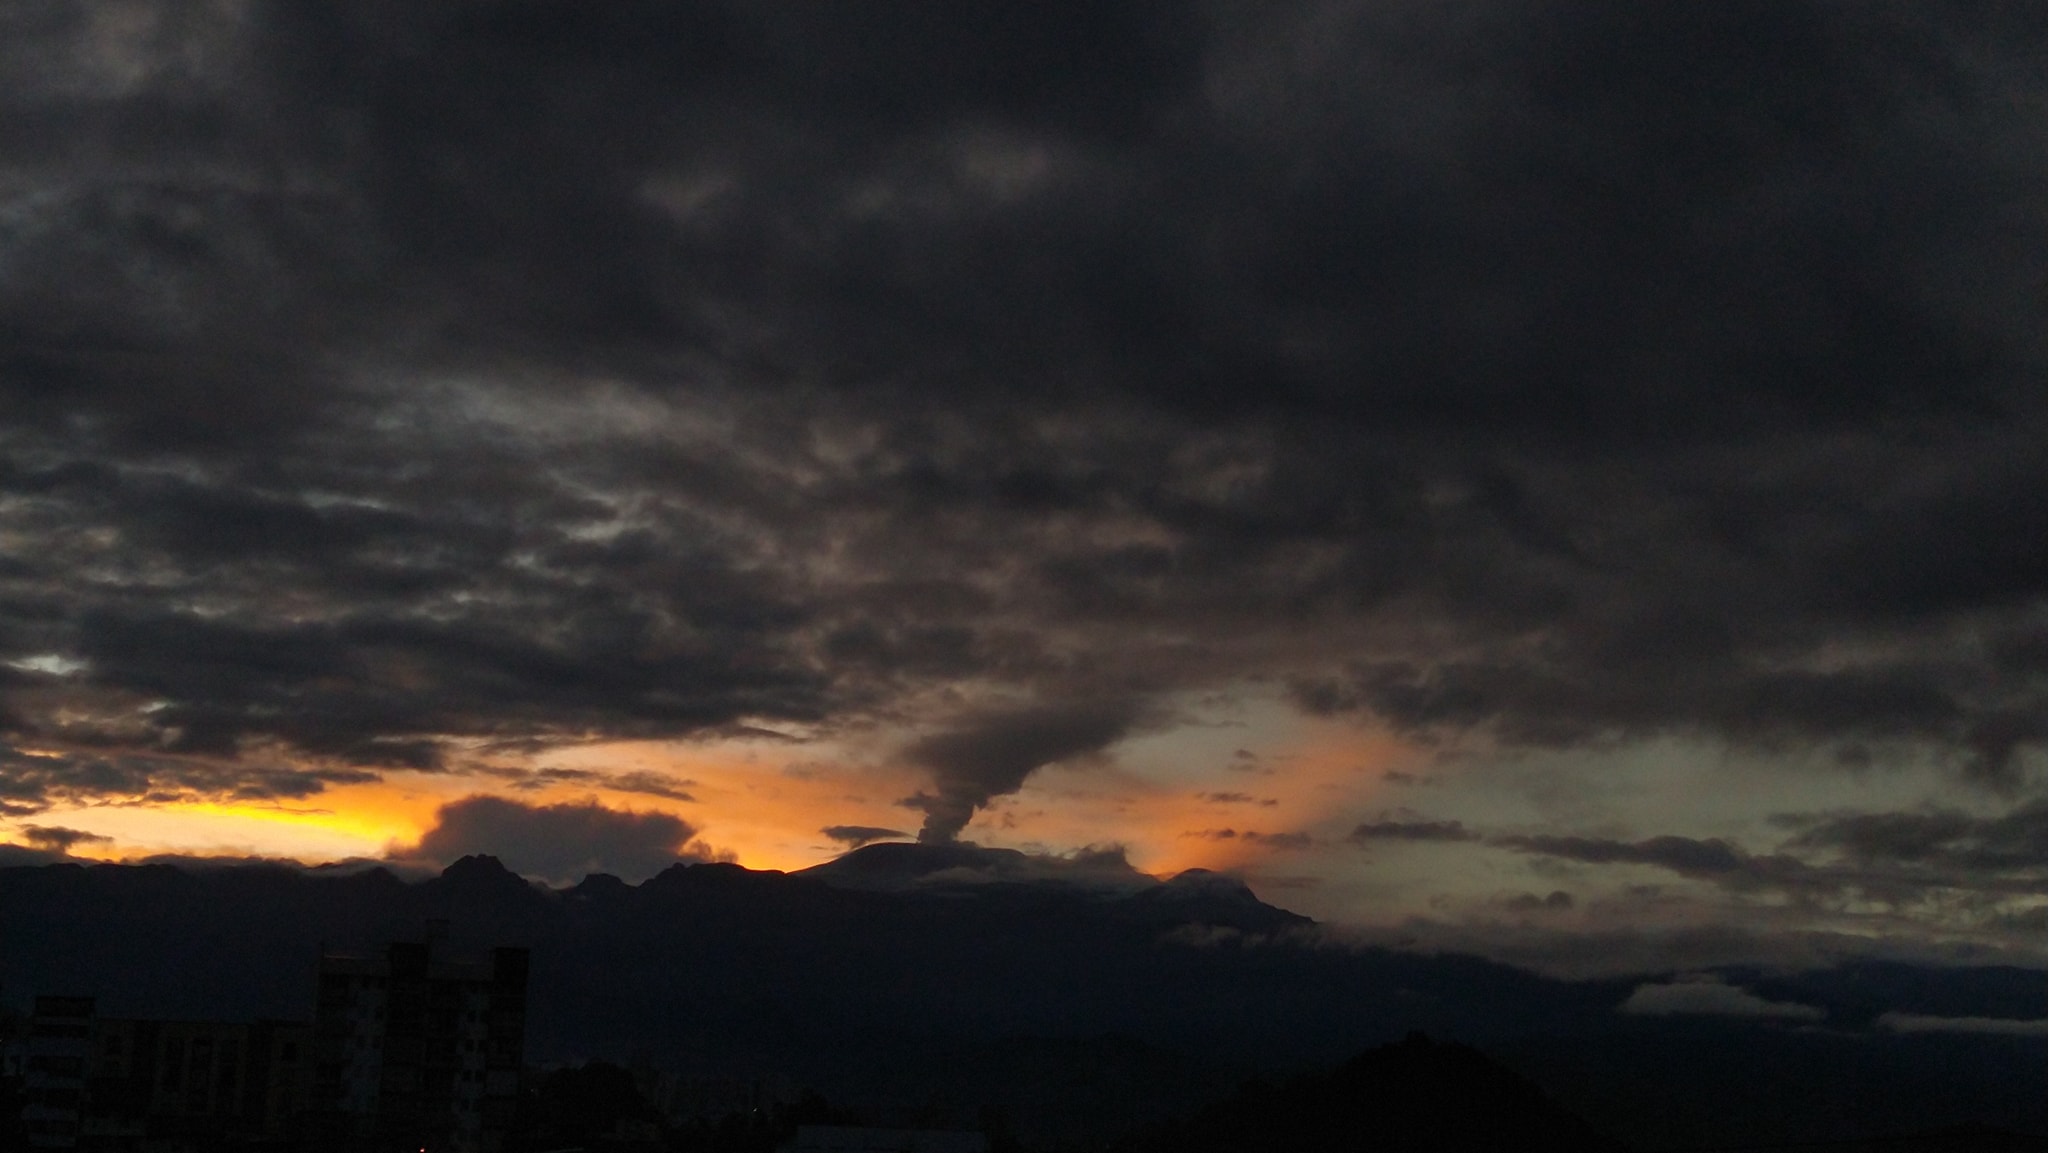
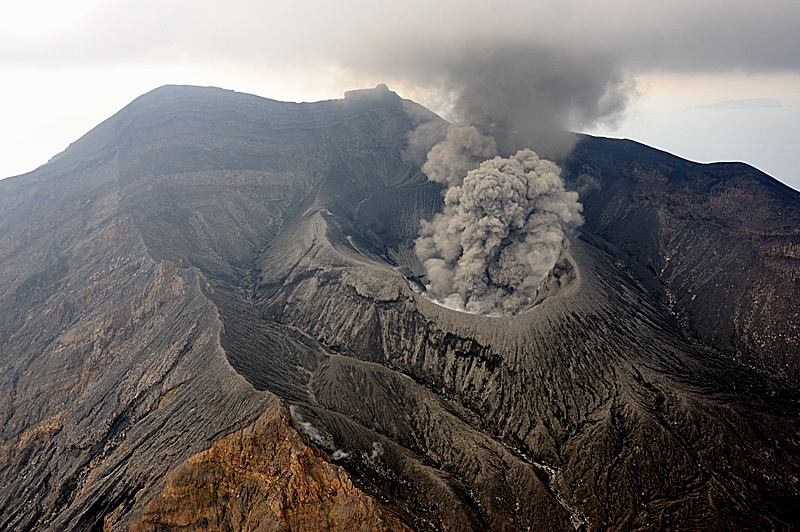
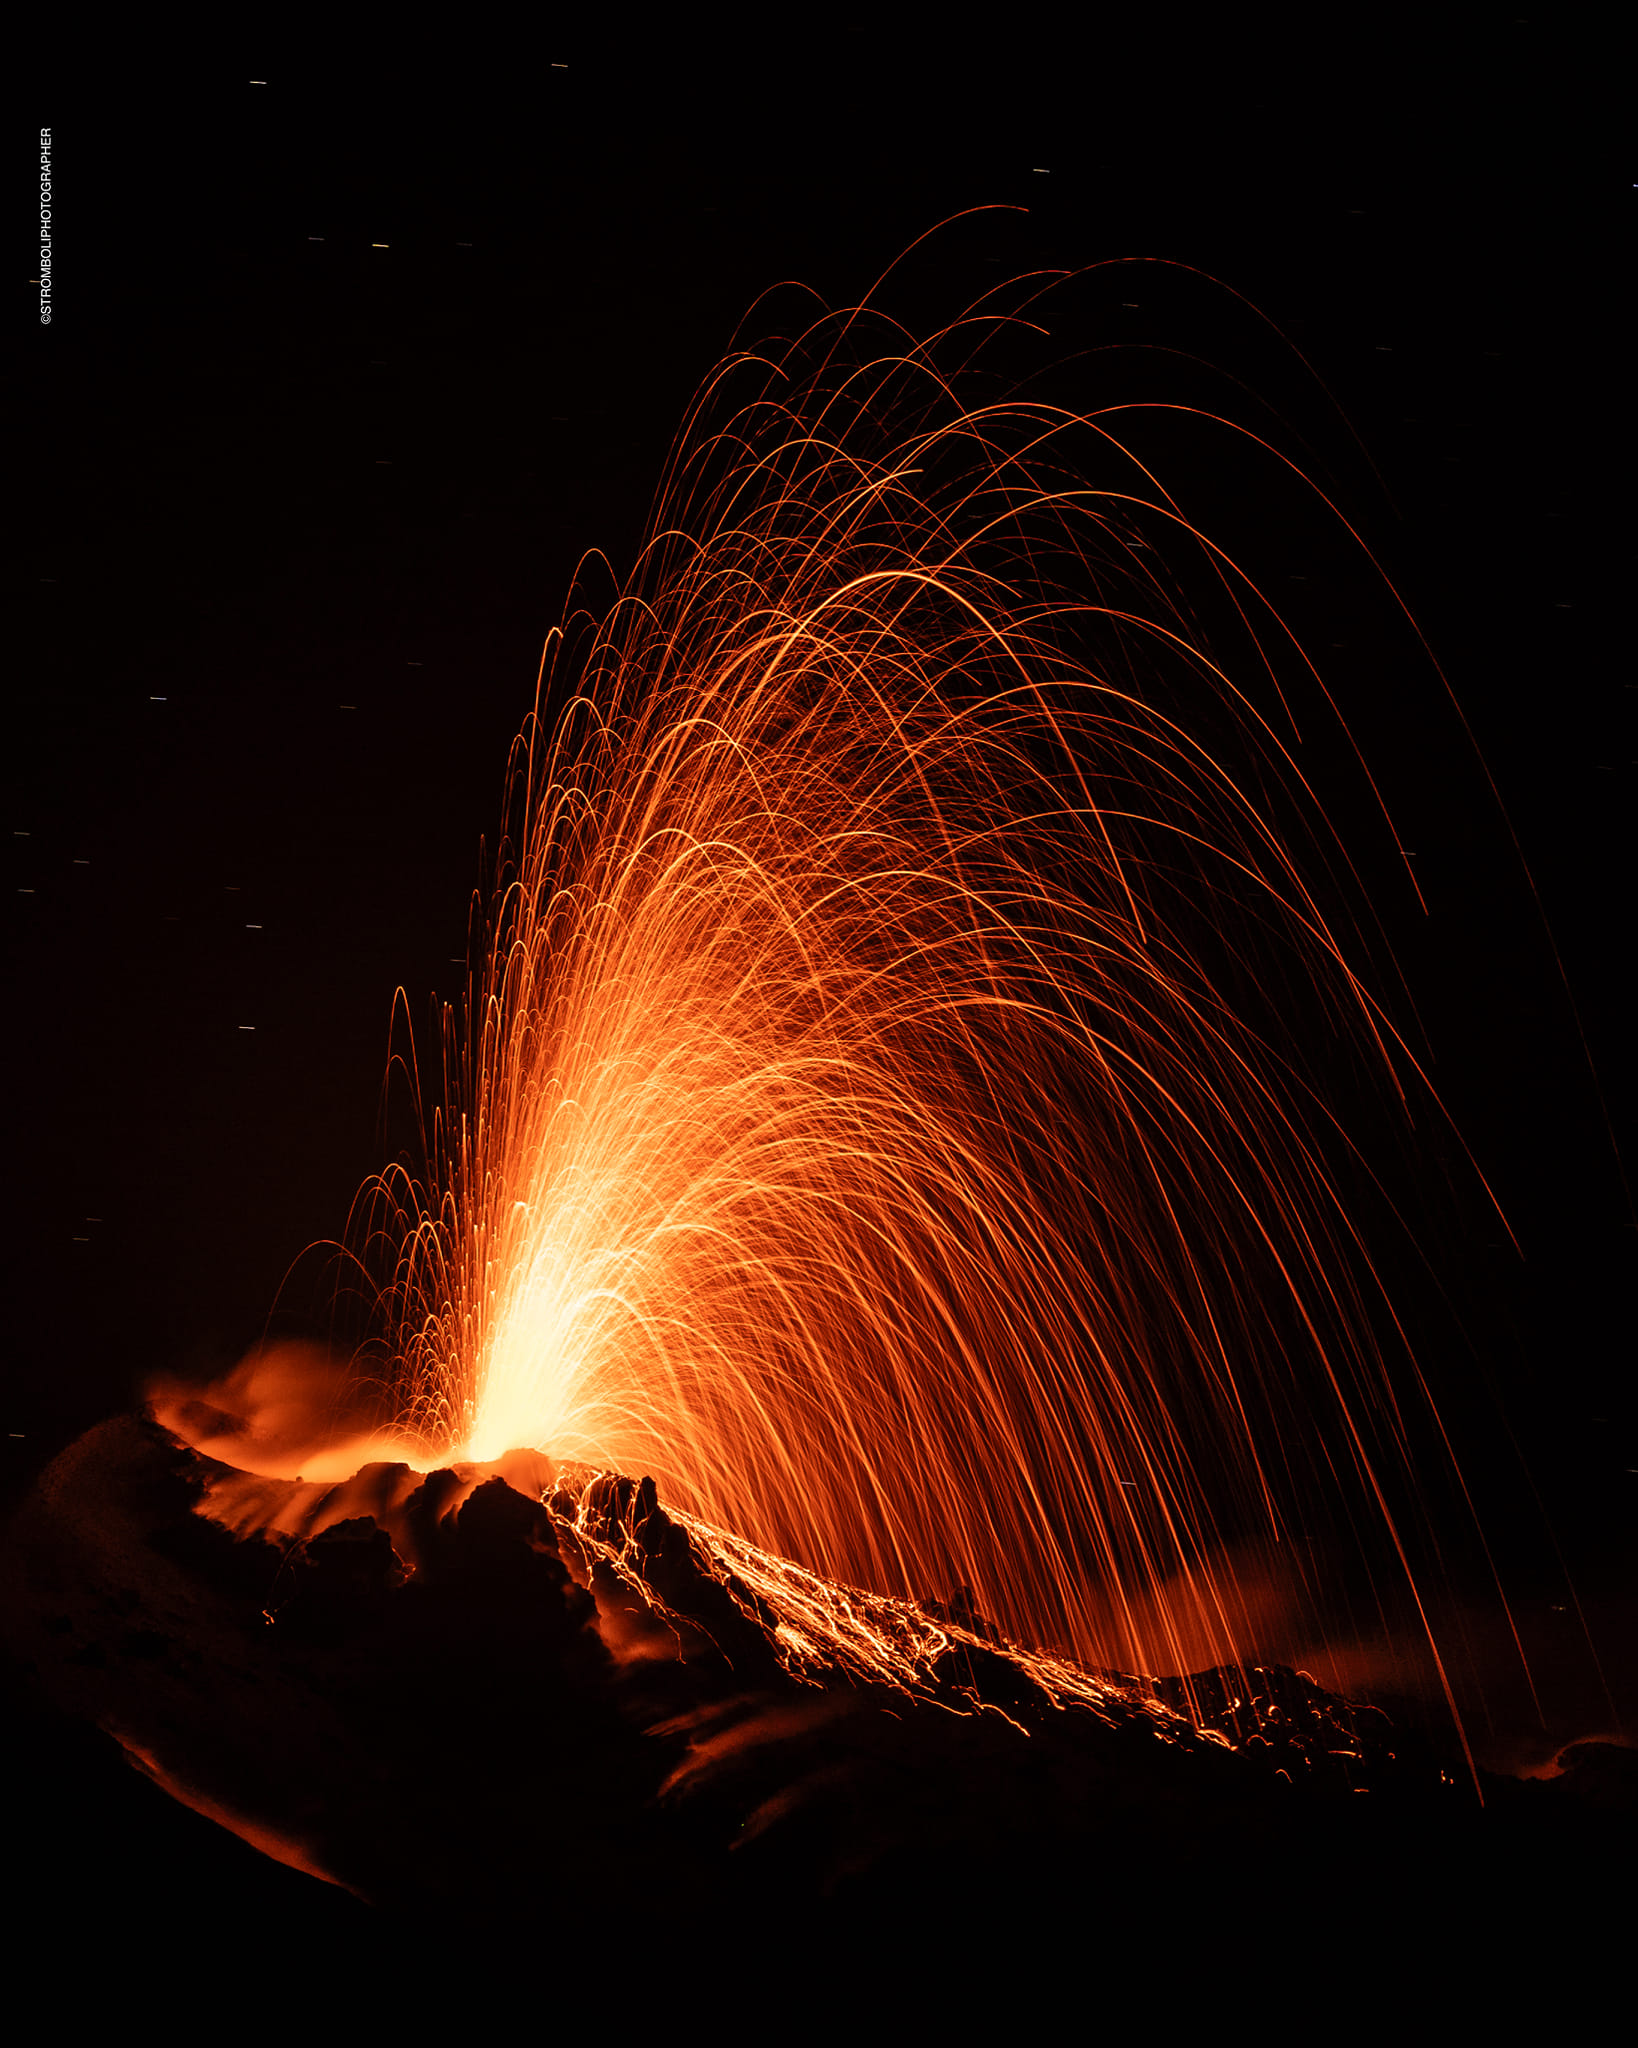
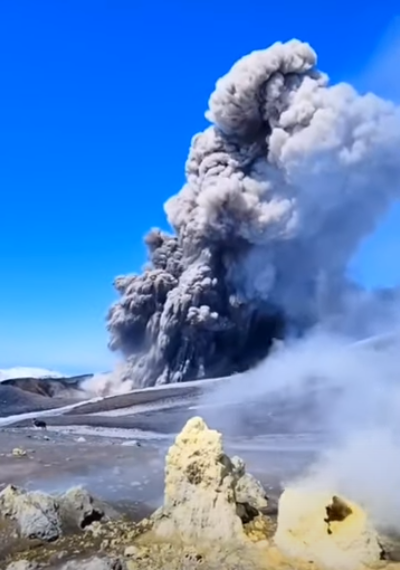
Russia / Kuril Islands , Ebeko :
VOLCANO OBSERVATORY NOTICE FOR AVIATION (VONA)
Issued: March 06 , 2024
Volcano: Ebeko (CAVW #290380)
Current aviation colour code: ORANGE
Previous aviation colour code: orange
Source: KVERT
Volcano Location: N 50 deg 41 min E 156 deg 0 min
Area: Northern Kuriles, Russia
Summit Elevation: 1156 m (3791.68 ft)
Volcanic Activity Summary:
A moderate explosive eruption of the volcano continues. According to visual data from Severo-Kurilsk, explosions sent ash up to 2.5 km a.s.l., and ash cloud drifted to the south-east of the volcano.
A moderate explosive eruption of the volcano continues. Ash explosions up to 6 km (19,700 ft) a.s.l. could occur at any time. Ongoing activity could affect low-flying aircraft and airport of Severo-Kurilsk.
Volcanic cloud height:
2000-2500 m (6560-8200 ft) AMSL Time and method of ash plume/cloud height determination: 20240306/2048Z – Visual data
Other volcanic cloud information:
Distance of ash plume/cloud of the volcano: 5 km (3 mi)
Direction of drift of ash plume/cloud of the volcano: SE
Time and method of ash plume/cloud determination: 20240306/2048Z – Visual data
Source : Kvert
Photo : Flower of love ( capture d’écran )
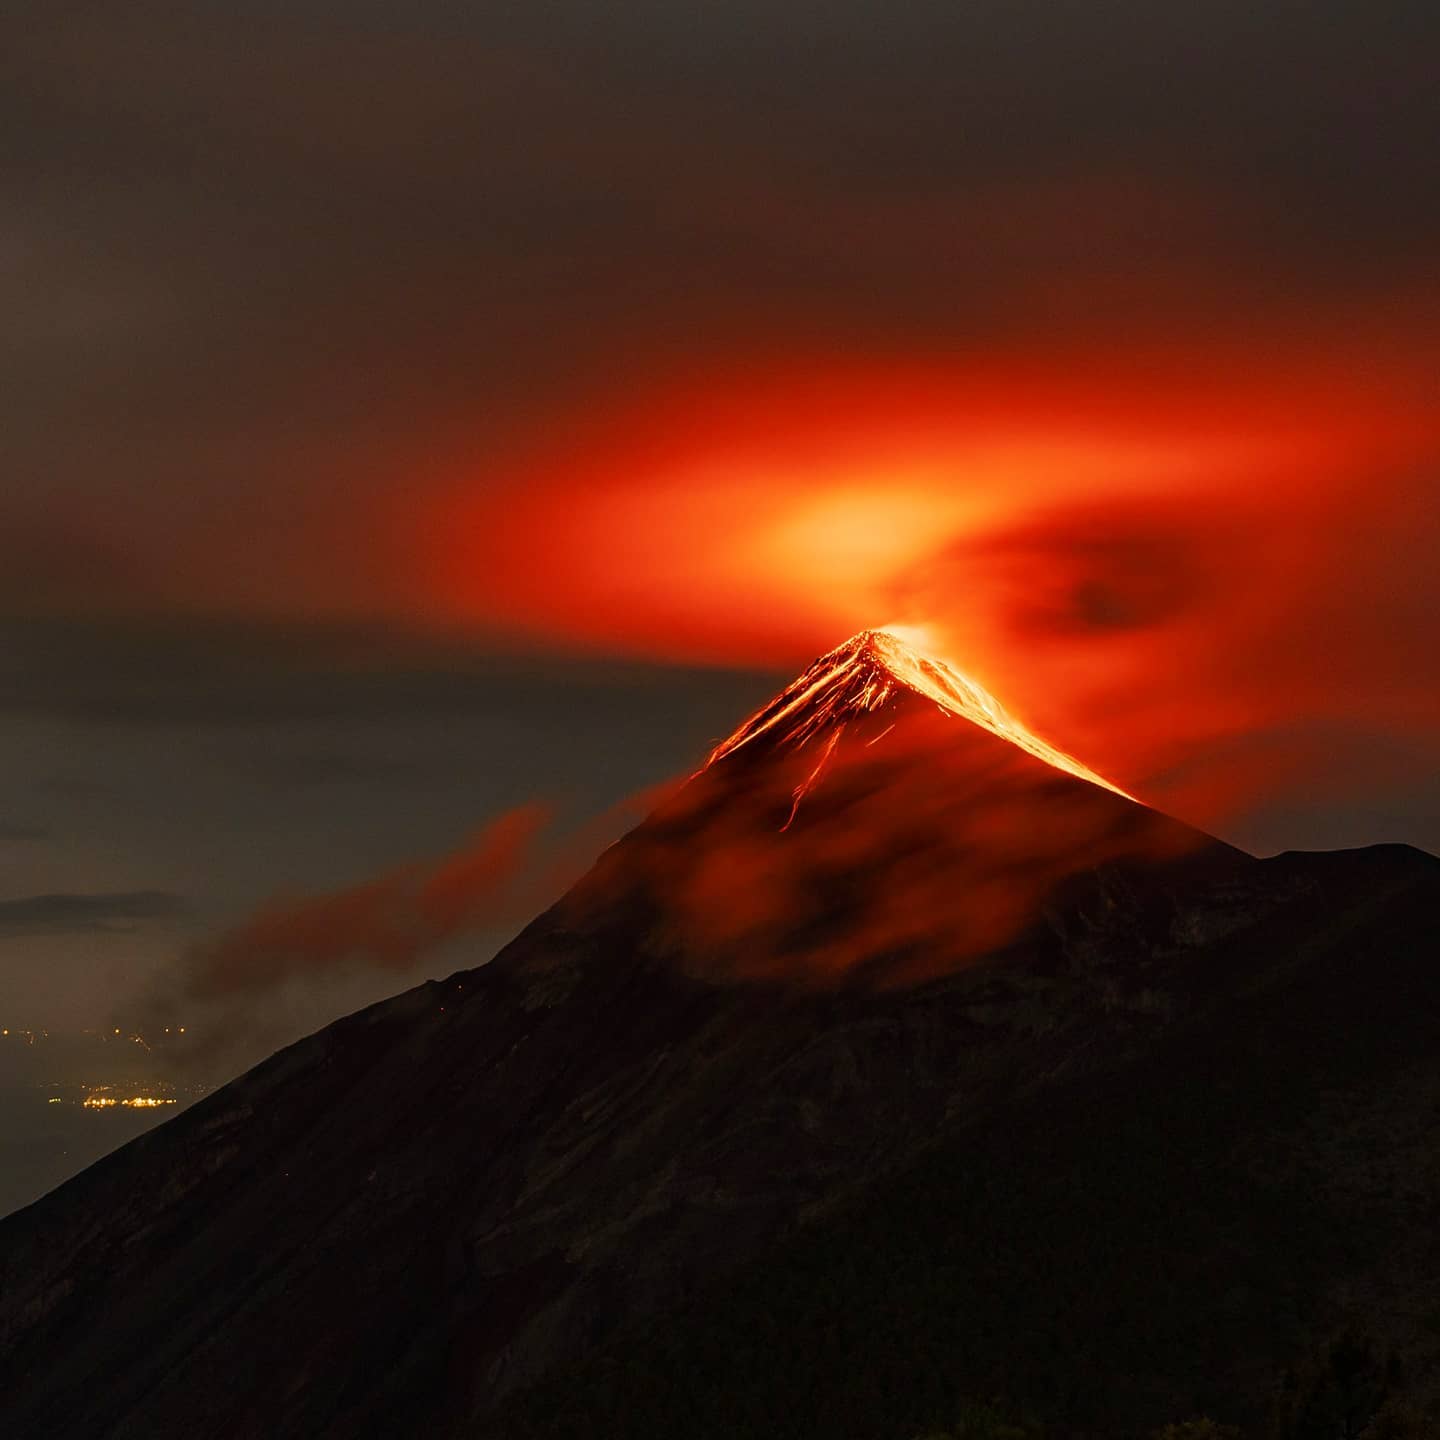
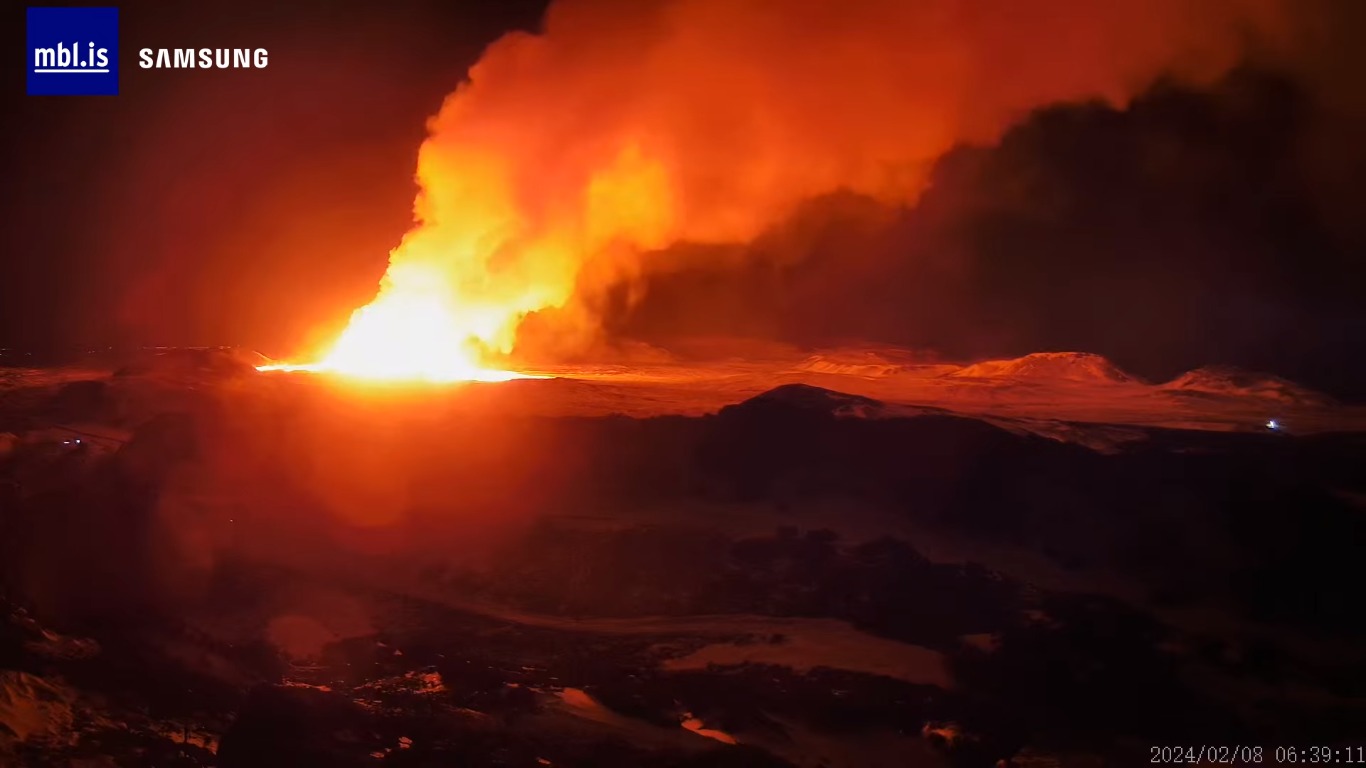
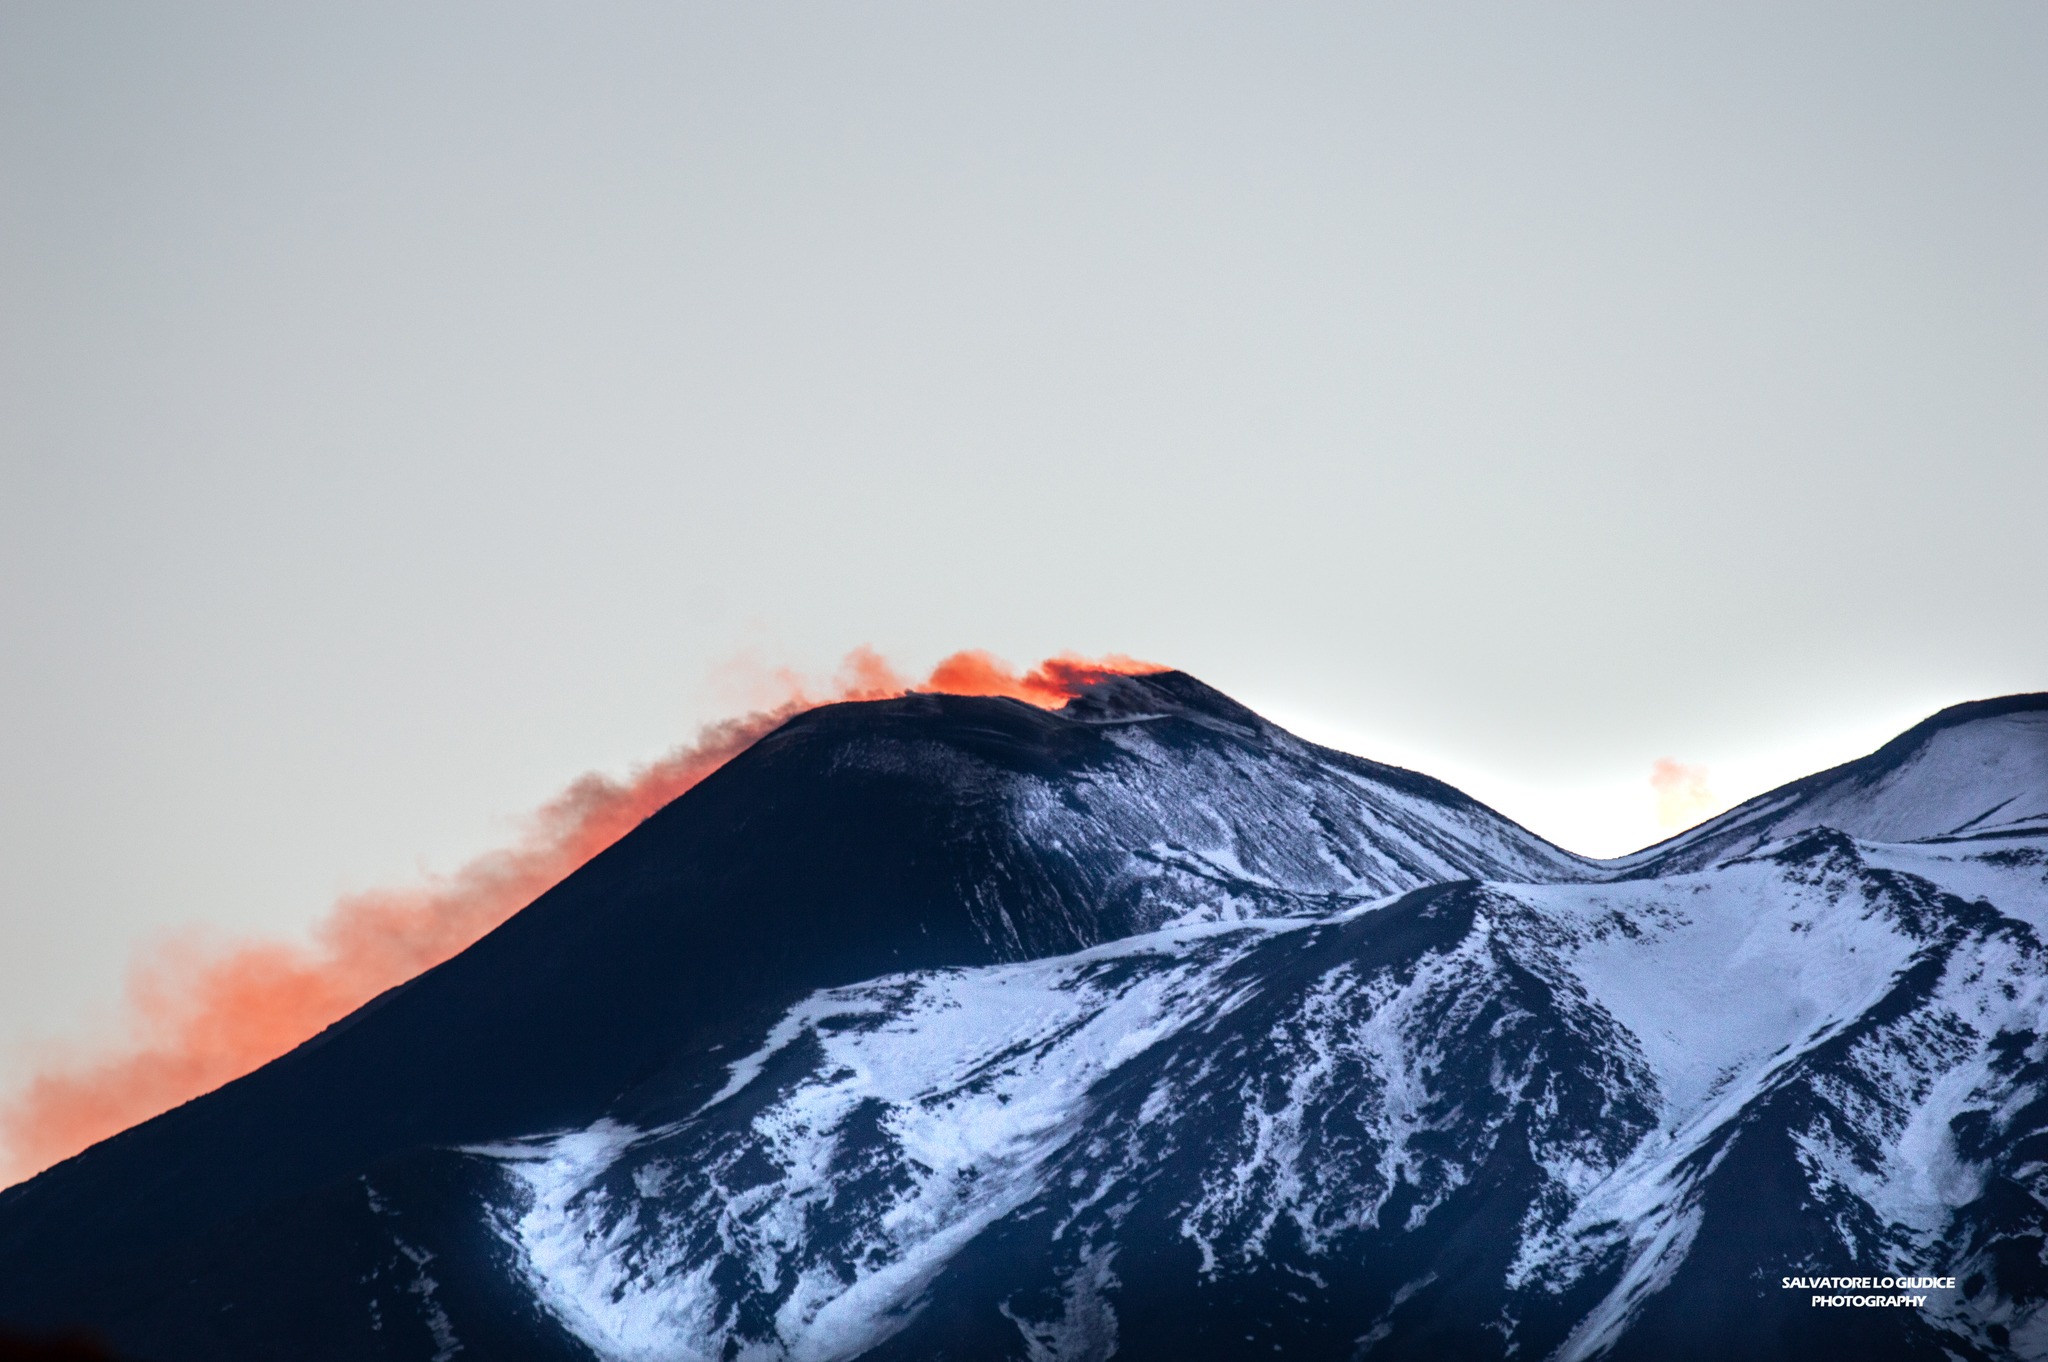
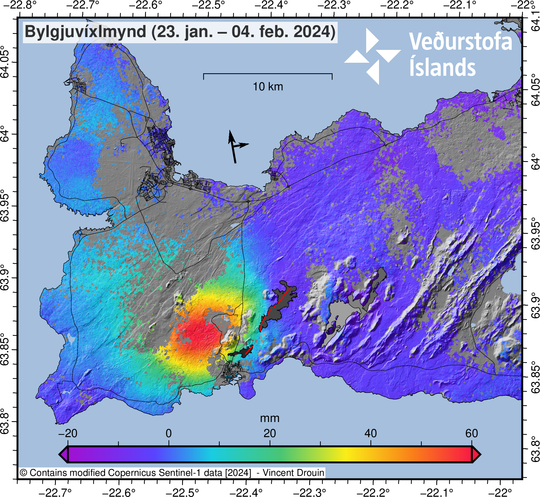
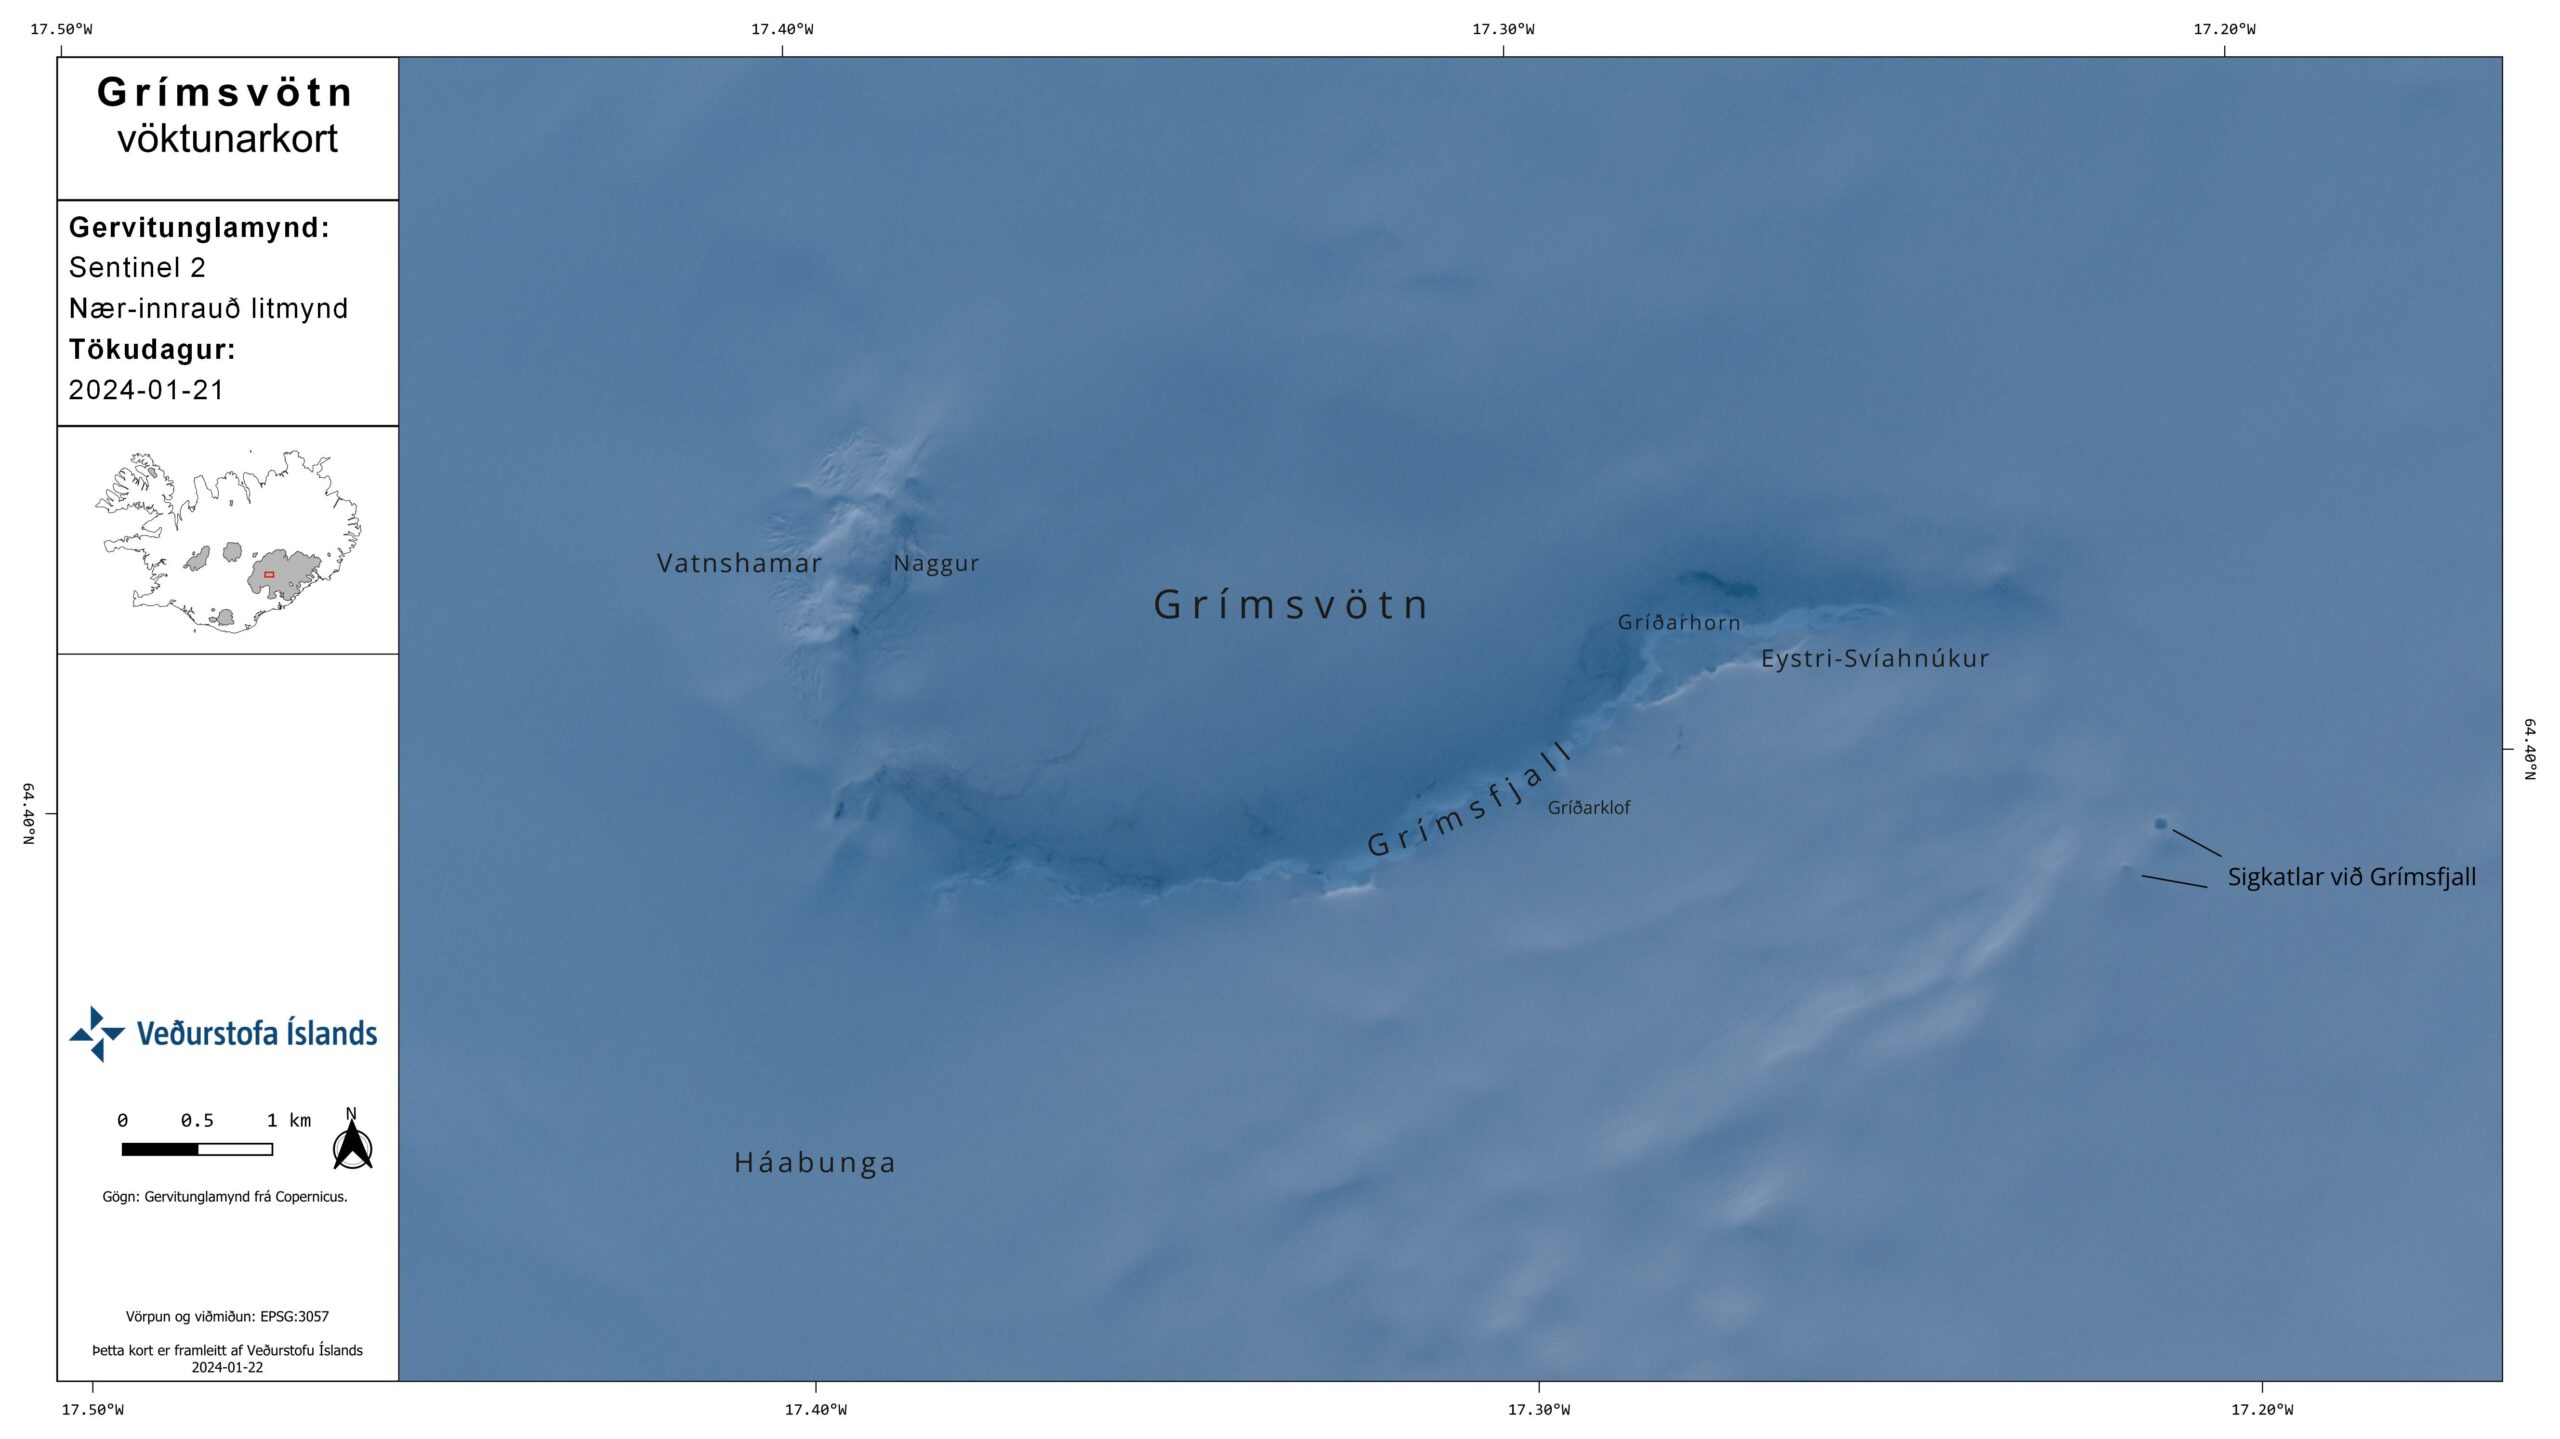
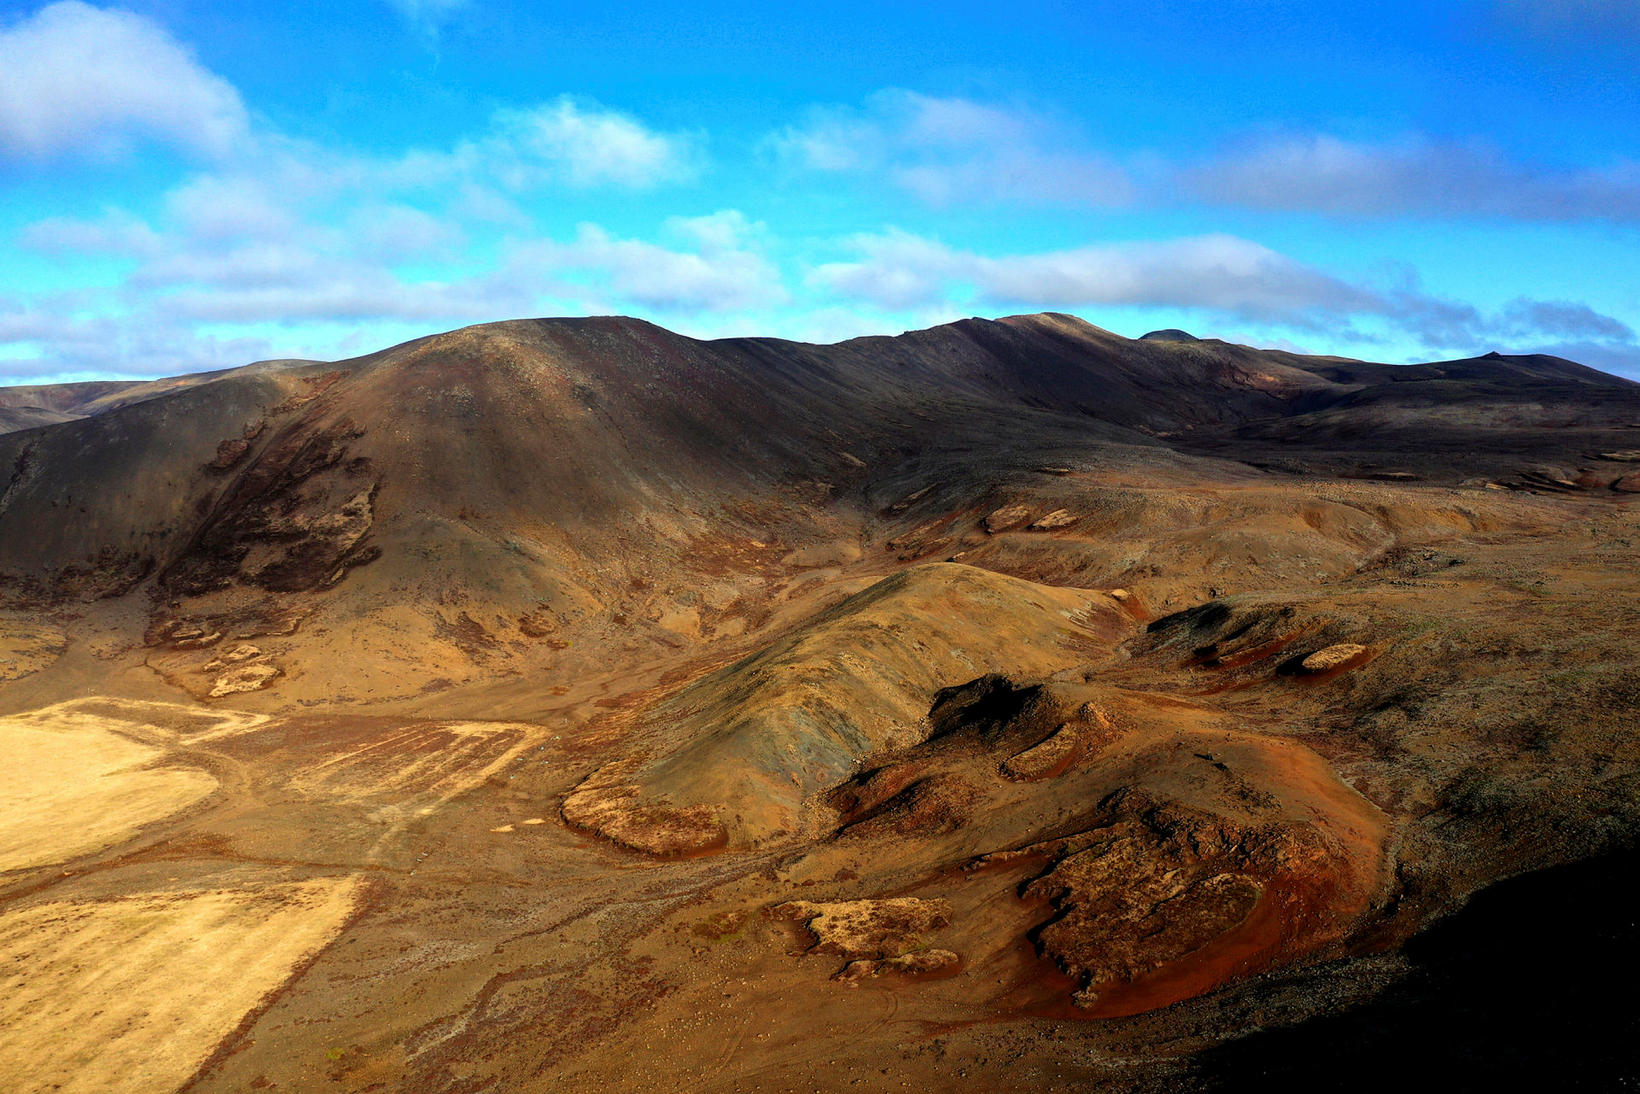
Iceland , Reykjanes Peninsula:
Increased likelihood of volcanic eruption. Updated hazard assessment. Zones 2 and 3 have been merged into one zone
Updated 7. March at 17:00 UTC
Likely sequence of events over the next several days:
The volume of magma beneath Svartsengi continues to increase, which could result in a new dike intrusion and possibly an eruption.
An eruption could occur with very short notice, possibly less than 30 minutes.
The most likely eruption site is between Stóra-Skógafell and Hagafell.
Seismic activity associated with the volcanic unrest has been decreasing since Saturday, with very few earthquakes detected in the past few days. However, unfavorable weather conditions have disrupted seismic monitoring by dampening small events, so there have likely been additional minor earthquakes that could not be detected.
Weather conditions over the next 24 hours will likely hinder the Meteorological Office’s earthquake monitoring system. The forecast indicates that Reykjanes will experience strong winds from the southeast accompanied by rain and limited visibility, especially in mountainous regions. Precipitation will decrease in the early morning, with occasional showers coinciding with reduced visibility expected tomorrow and the following days. Winds are expected to decrease over the weekend, coming from the southeast or northwest on Sunday.
Inflation continues at Svartsengi, and model calculations based on GNSS data from March 3rd to 6th indicate that approximately 1.2 million cubic meters of magma has been injected into the magma chamber during these days. Therefore, approximately 10 million cubic meters of magma has accumulated in the magma chamber overall since the last eruption. The current situation is therefore similar to what it was before the eruption on March 2nd.
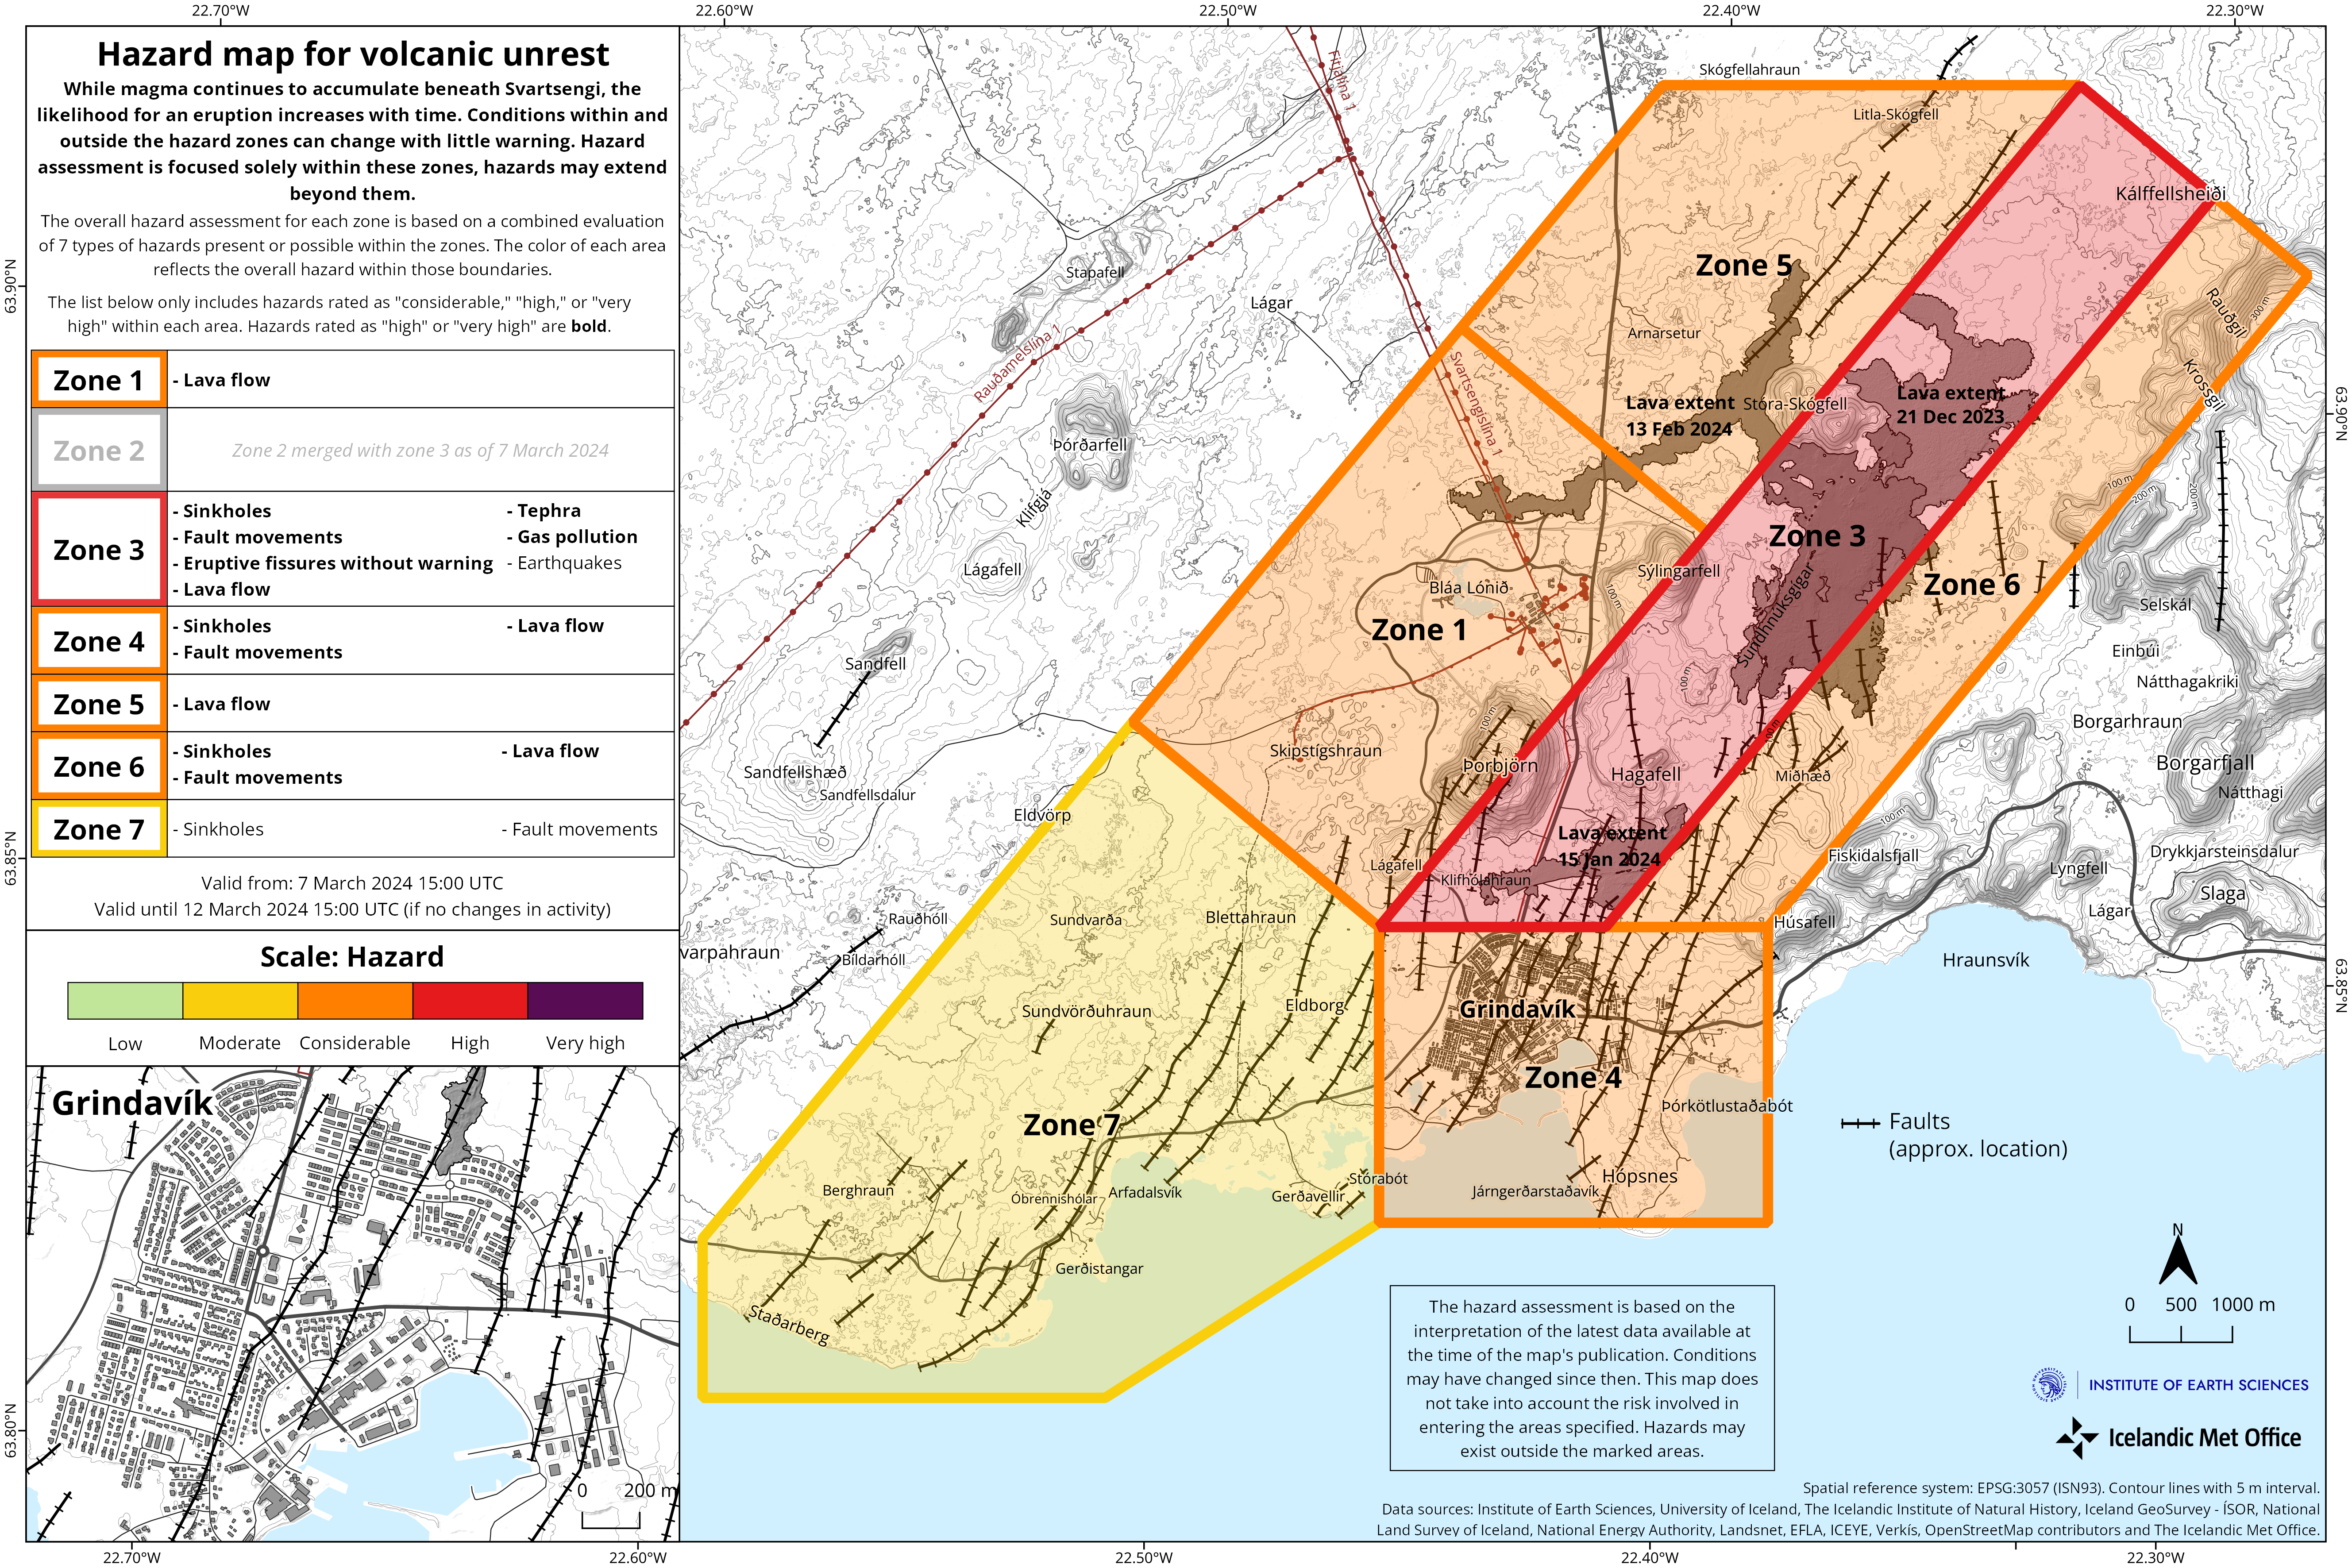
Updated hazard assessment
The Meteorological Office has updated the hazard assessment map. The hazard level remains unchanged from the last map. One change has been made to the zoning; Zones 2 and 3 have been merged into one single zone. Given the development of the activity, there is no longer a reason to assess the risk in these areas separately. The new hazard assessment map took effect at 3 p.m. today, Thursday, March 7th. This hazard assessment is valid until March 12th, barring any changes to the situation.
Source : IMO
Photos : mbl.is/Eggert Jóhannesson , IMO
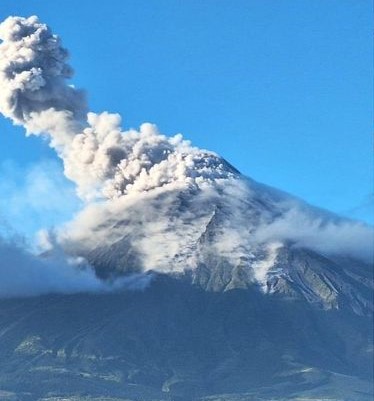
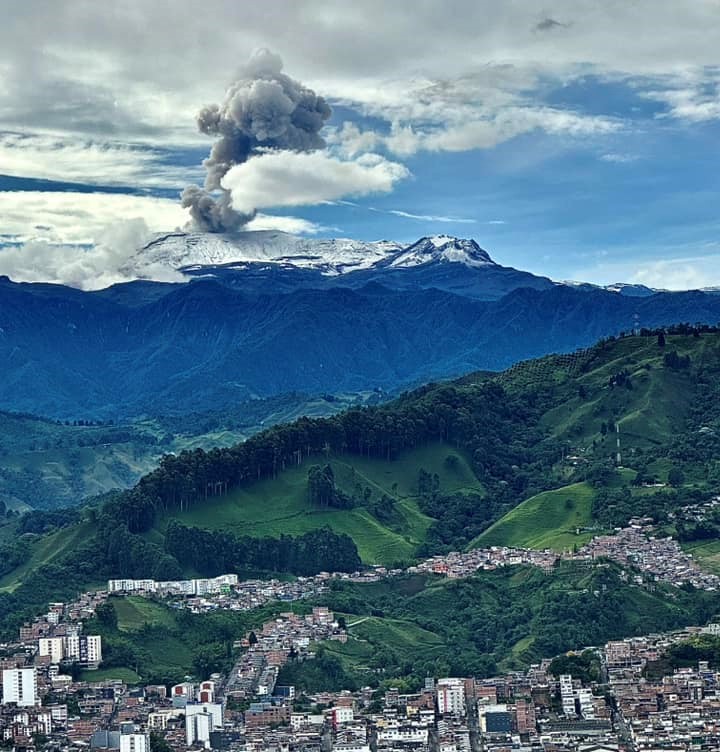
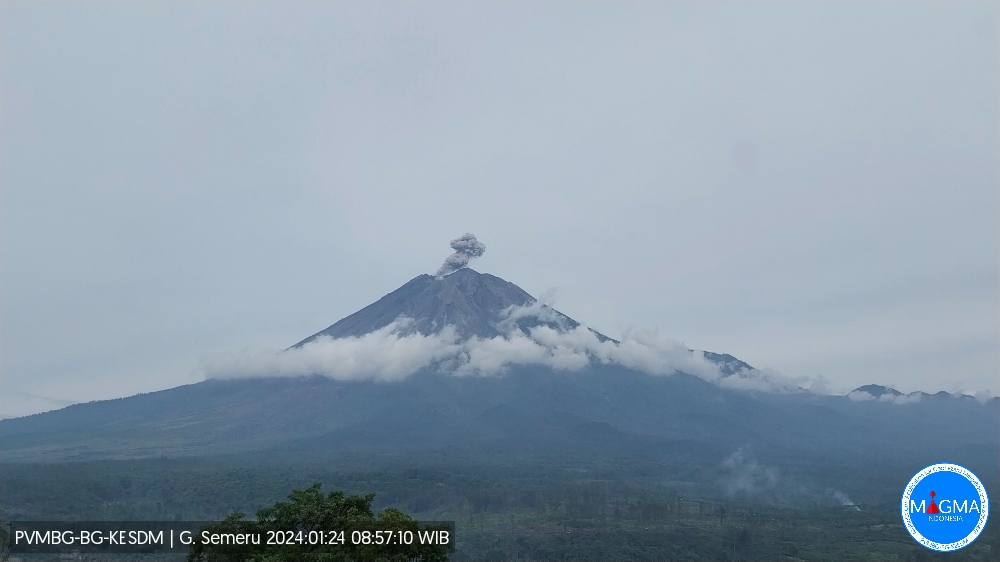
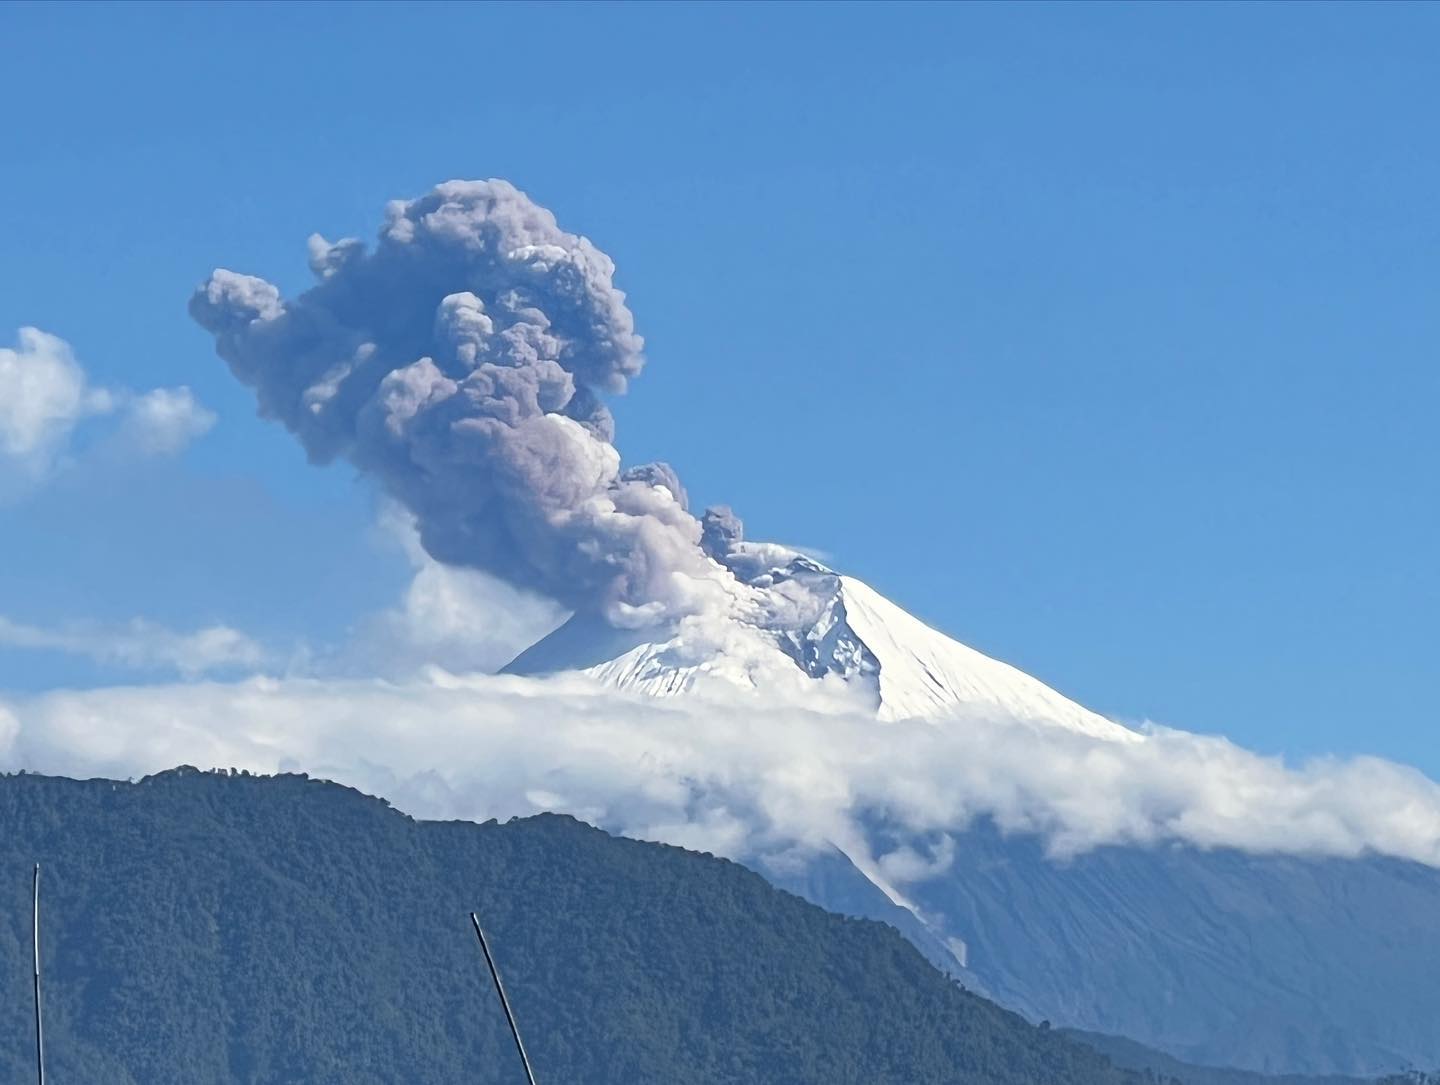
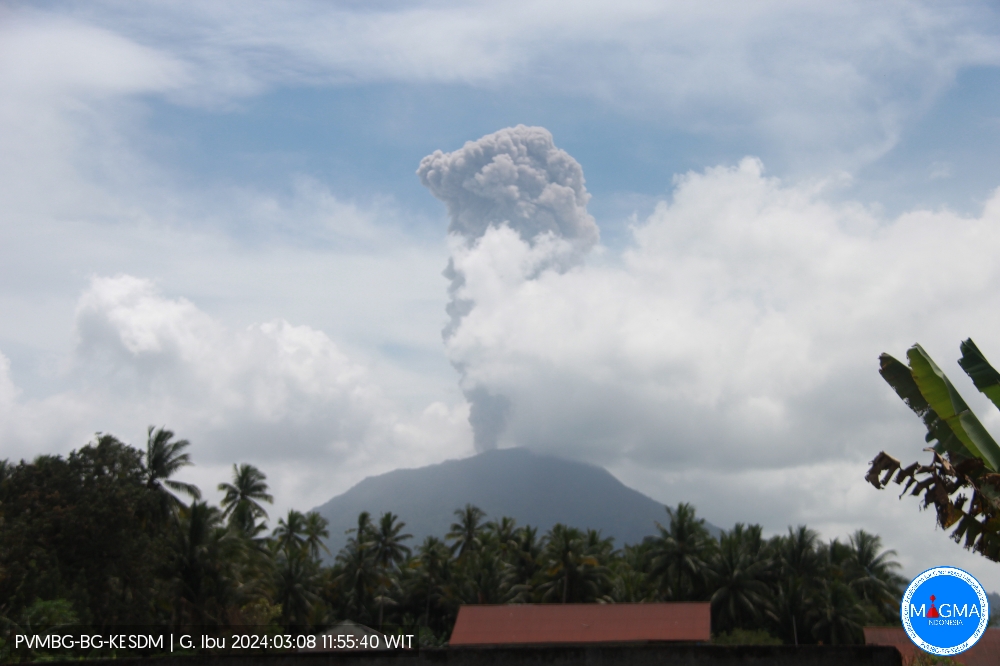
Indonesia , Ibu :
An eruption of Mount Ibu occurred on Friday, March 8, 2024 at 11:41 a.m. WIT with the height of the ash column observed at ±2,000 m above the summit (±3,325 m above the level of the sea). The ash column was observed to be gray with thick intensity, oriented towards the South and South-West. At the time of writing, the eruption was still ongoing.
SEISMICITY OBSERVATIONS:
12 eruption/explosion earthquakes with an amplitude of 15 to 28 mm and a duration of 24 to 70 seconds.
124 emission earthquakes with an amplitude of 2 to 14 mm and earthquake duration of 6 to 45 seconds.
5 harmonic tremors with an amplitude of 2 to 8 mm and an earthquake duration of 45 to 75 seconds.
162 shallow volcanic earthquakes with an amplitude of 2 to 16 mm and a duration of 6 to 12 seconds.
4 distant tectonic earthquakes with an amplitude of 12-24 mm, and earthquake duration 65-140 seconds.
RECOMMENDATION
1. Communities around Mount Ibu and visitors/tourists should not practice activities within a radius of 2.0 km and a sectoral extension of 3.5 km towards the crater opening in the northern part of the active crater from Mount Ibu.
2. In the event of falling ash, people who carry out activities outside the home are advised to wear nasal, oral (mask) and eye (glasses) protection.
Source et photo : Magma Indonésie .
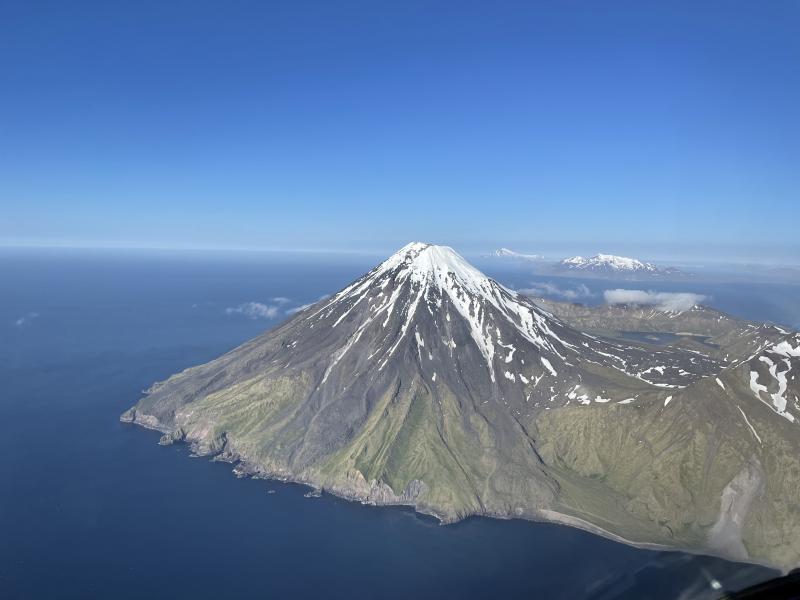
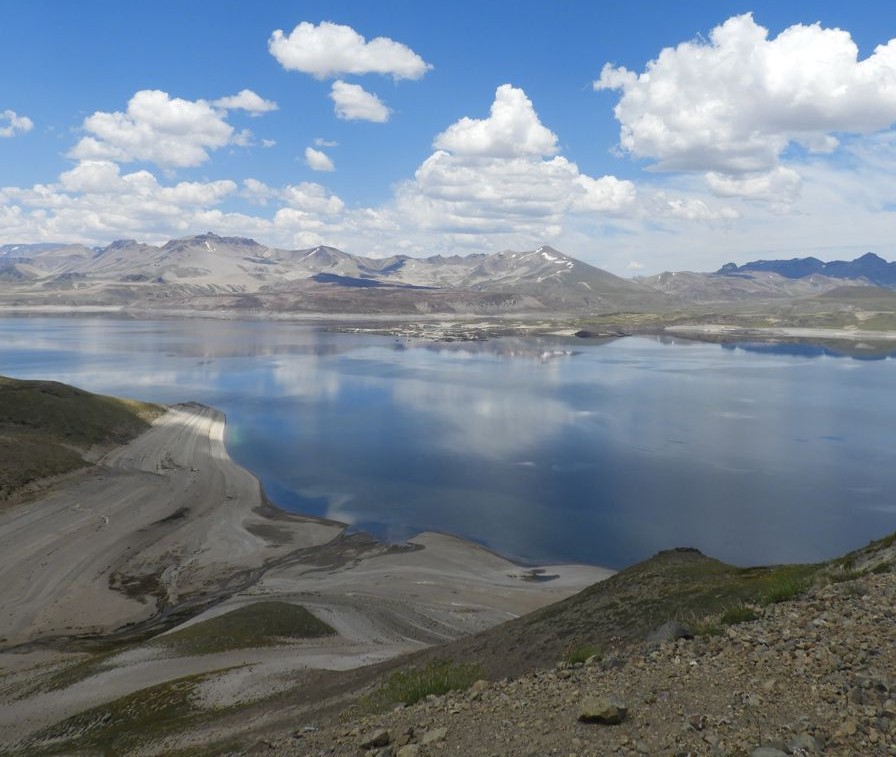
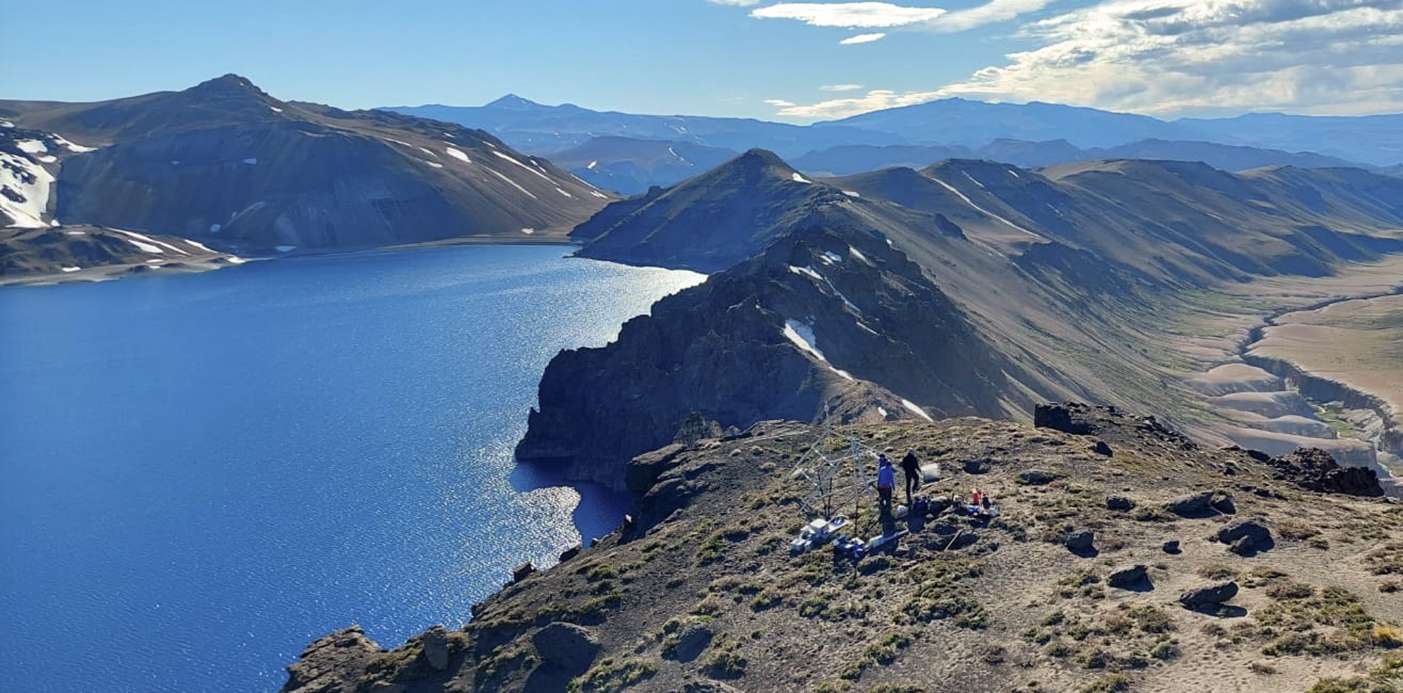
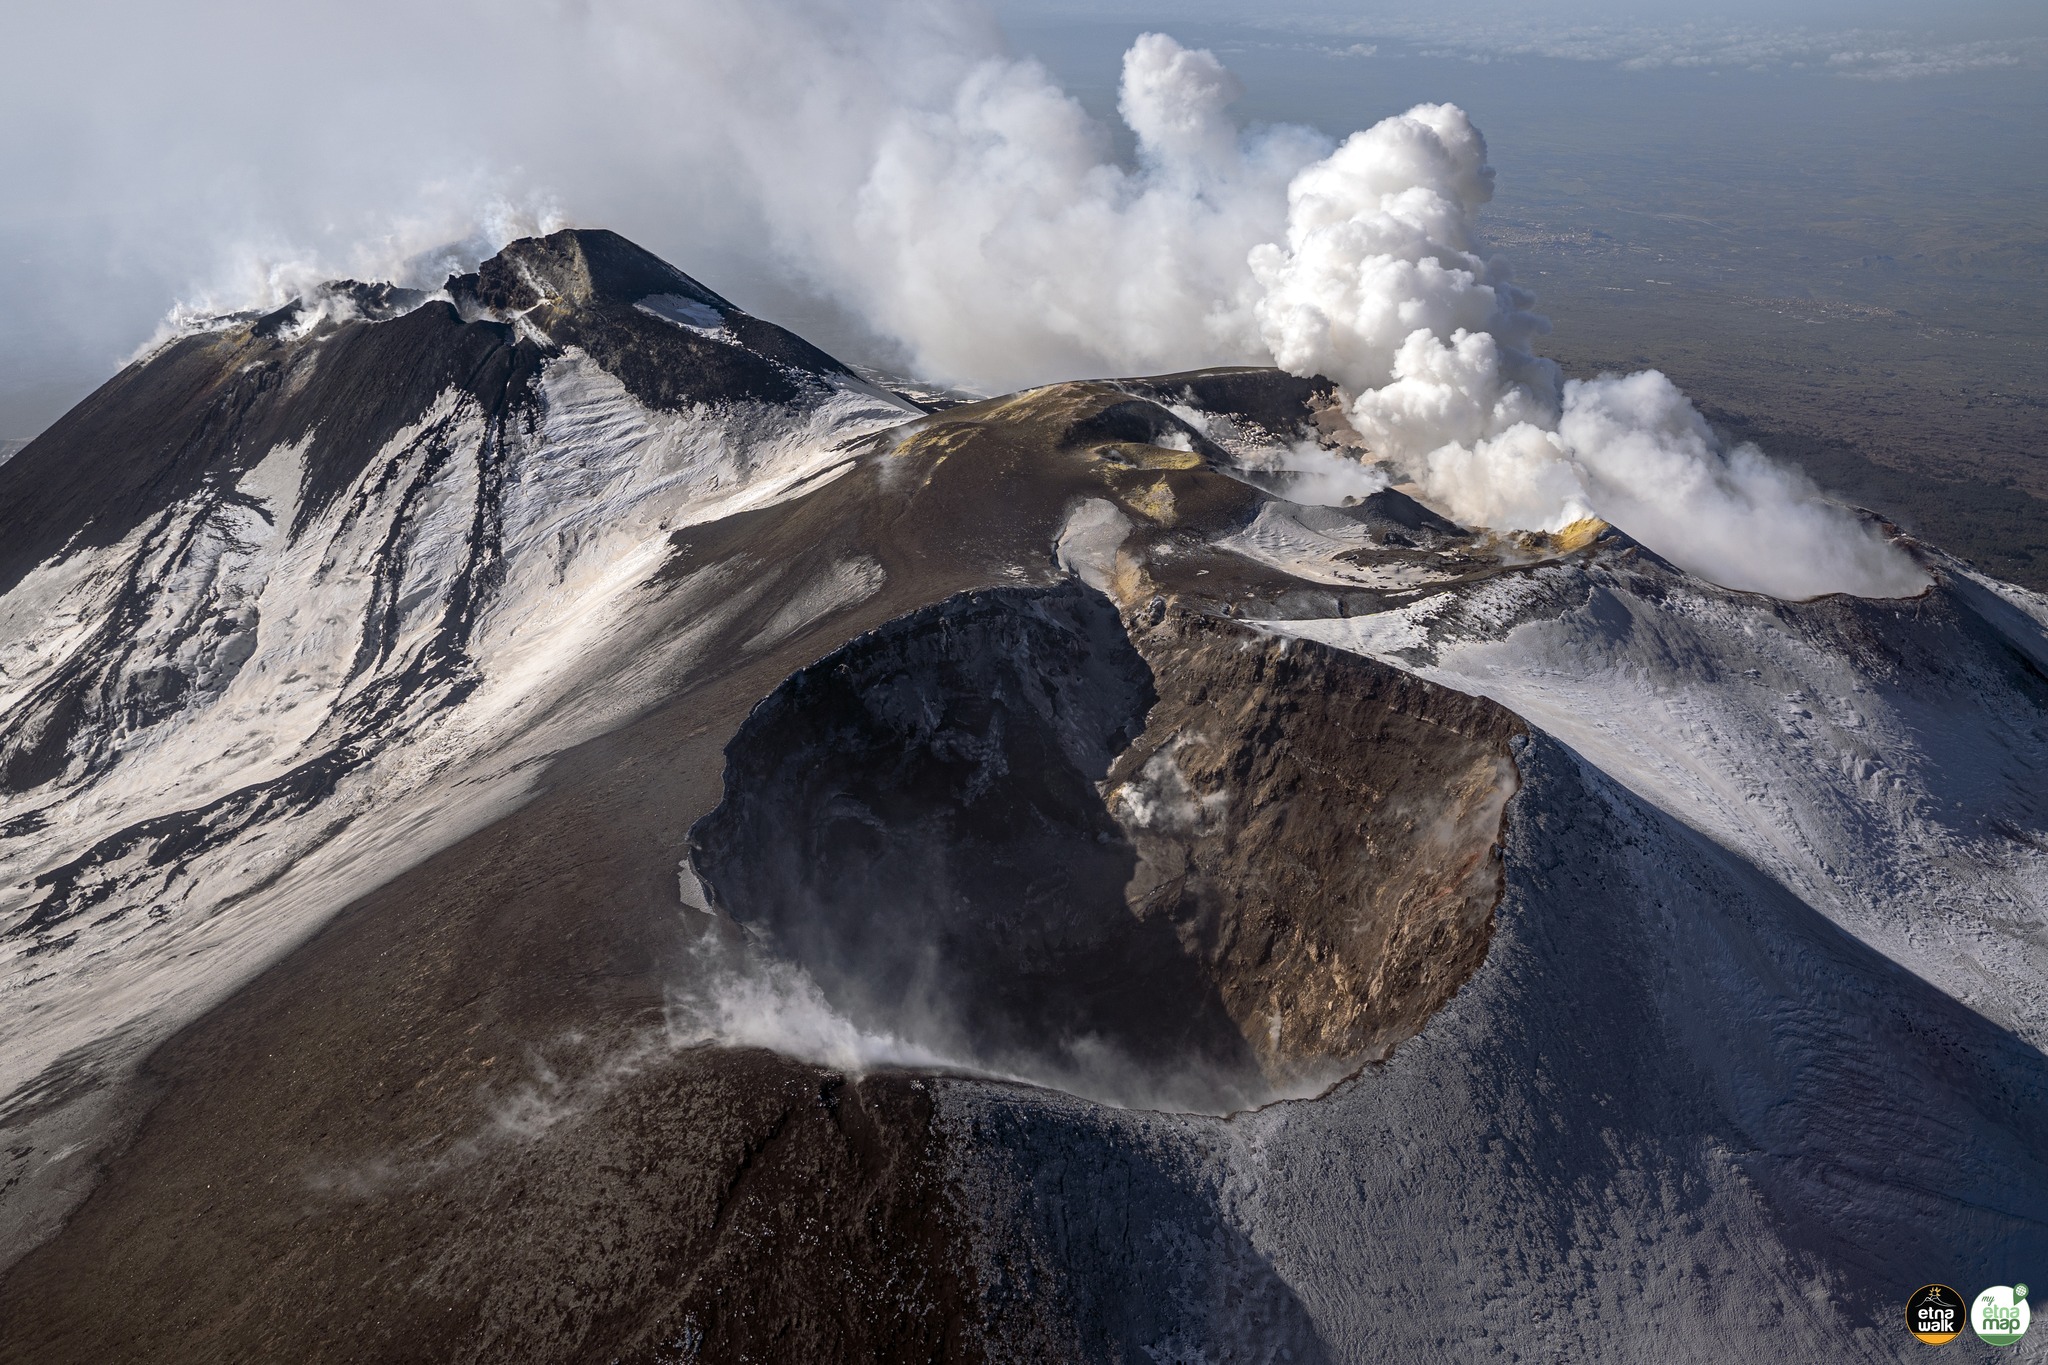
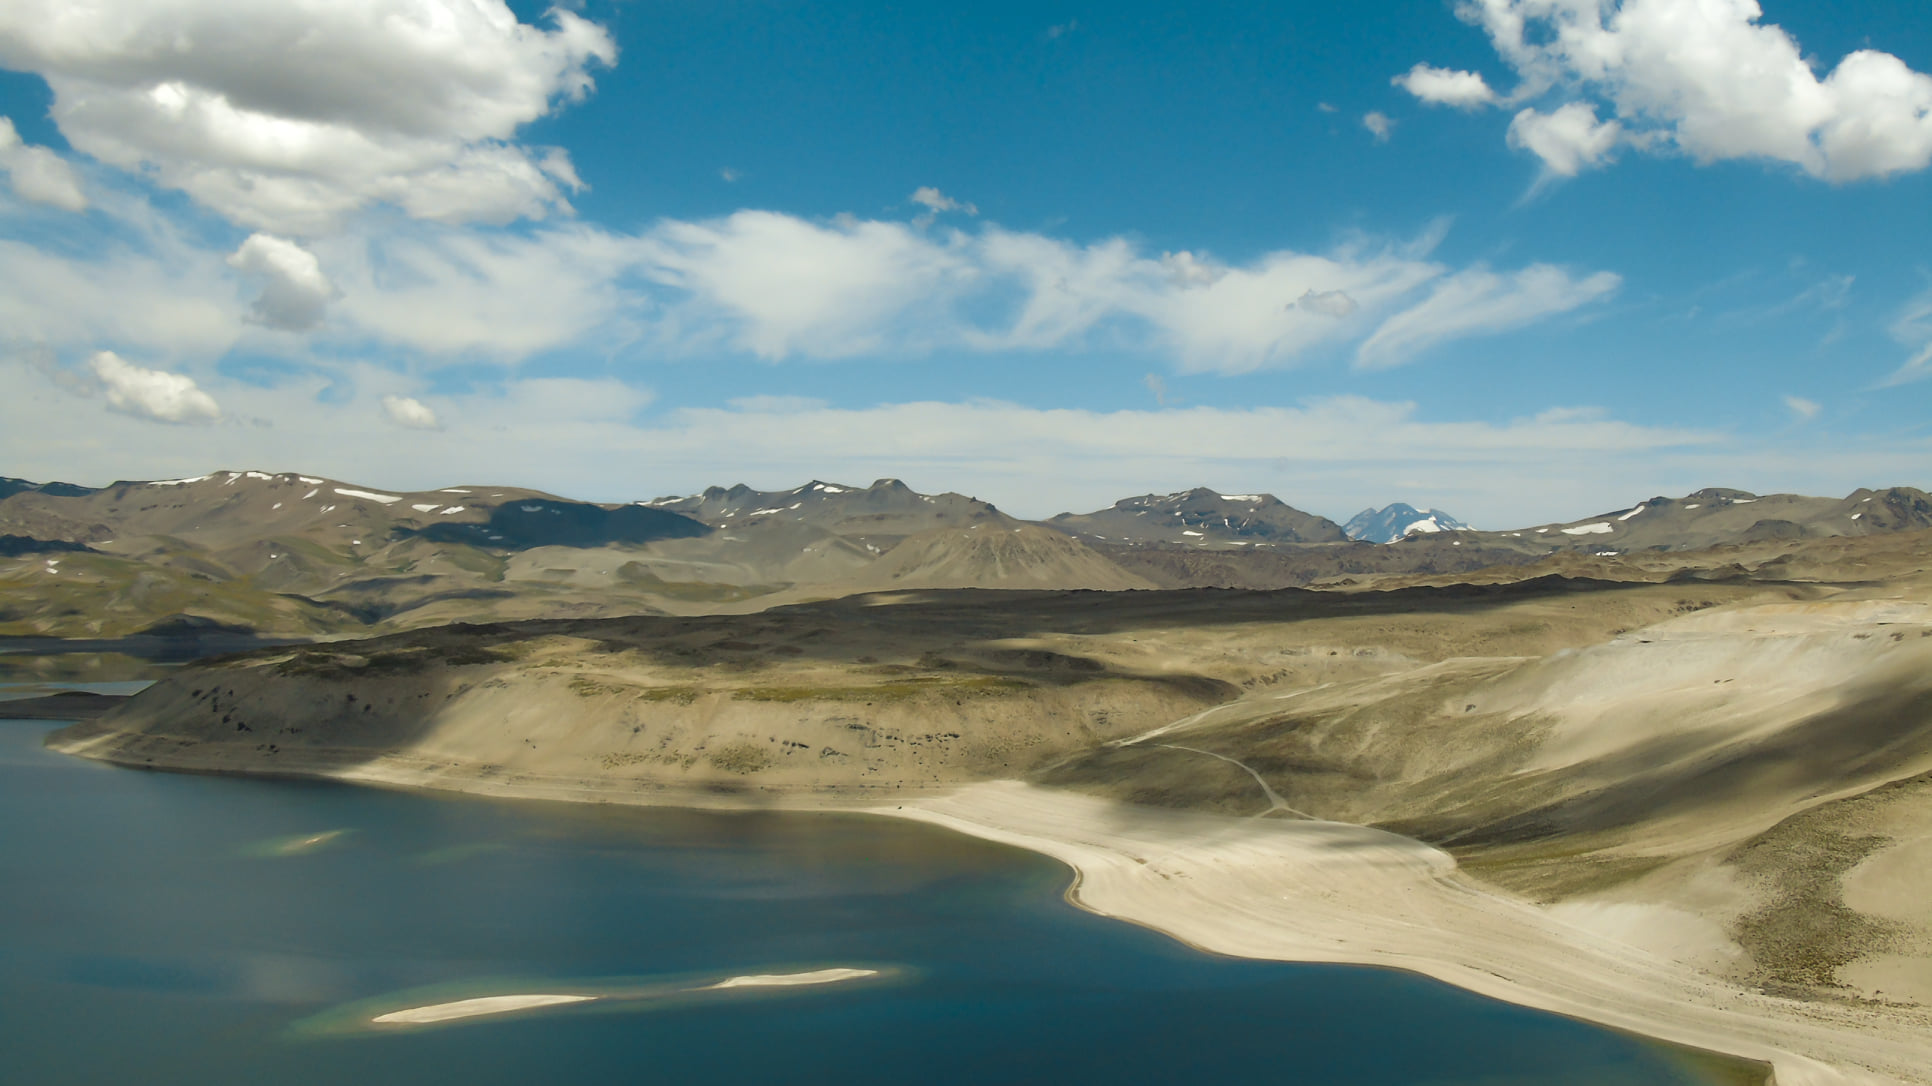
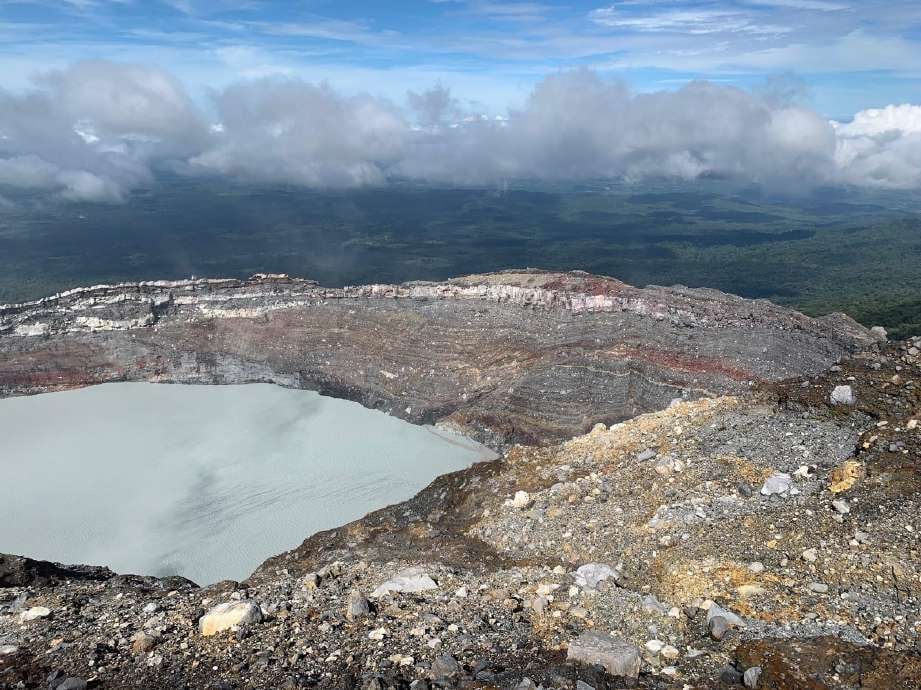
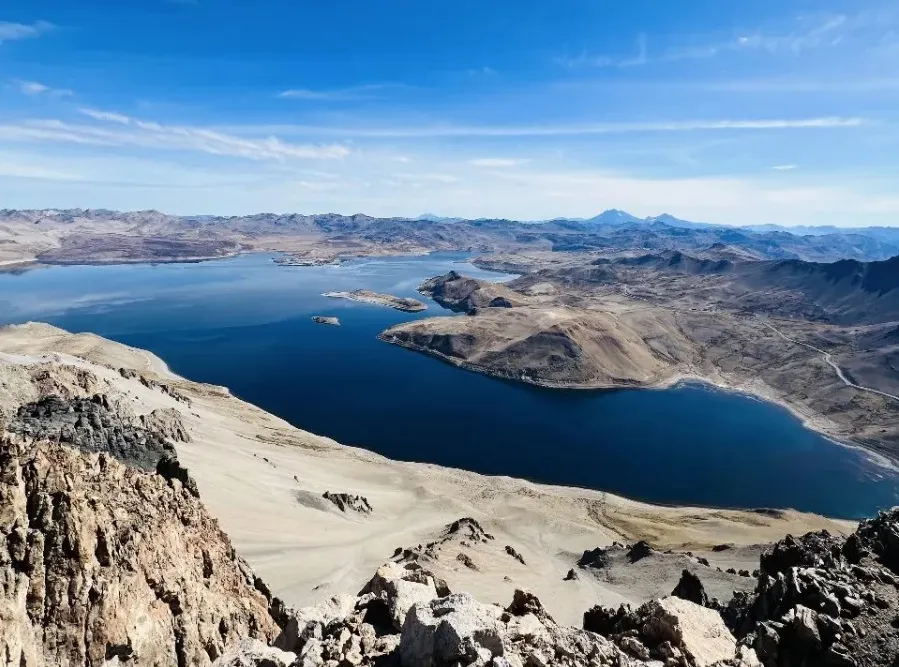
Chile , Laguna del Maule :
Seismology
The seismological activity of the period was characterized by the recording of:
682 seismic events of type VT, associated with the fracturing of rocks (Volcano-Tectonics). The most energetic earthquake had a Local Magnitude (ML) value equal to 2.1, located 6 km east-southwest from the center of the lagoon, at a depth of 5.8 km.
5 LP type seismic events, associated with fluid dynamics inside the volcanic system (Long Period). The size of the largest earthquake evaluated from the Reduced Displacement (RD) parameter was equal to 4.9 cm2.
1 TR type seismic event, associated with the dynamics maintained over time of fluids inside the volcanic system (TRemor). The size of the largest earthquake evaluated from the Reduced Displacement (RD) parameter was equal to 6.6 cm2.
Fluid geochemistry
No anomalies have been reported in the emissions of sulfur dioxide (SO2) into the atmosphere in the area near the volcanic complex, according to data published by the Tropospheric Monitoring Instrument (TROPOMI) and the Ozone Monitoring Instrument (OMI) .
Geodesy
From data provided by 7 GNSS stations, which monitor deformation in the volcanic complex, we observe that the inflationary process recorded since 2012 continues,
Particularly during the period evaluated, it can be noted that:
– The distances between stations maintain the trends and magnitudes compared to the previous period, with lengthening or shortening rates which do not exceed 1.2 cm/month.
– The maximum vertical rise remains in the central sector of the lagoon, with a speed of 2.1 cm/month for this period, recorded at station MAU2.
– The change in trend is evident in the vertical components of the stations located south of Laguna Fea, showing a vertical elevation of the area with maximum rates of 0.8 cm/month.
– Through the use of the InSAR technique, using Sentinel 1A satellite images, signals associated with deformation of a magnitude and pattern similar to those previously recorded in the complex are observed, with an area maximum inflation near the center of the lagoon. In particular, for this period, a clear decrease in subsidence is observed east of Laguna Fea in accordance with GNSS data.
The recording of VT seismic activity continues, although with an energy level and recurrence lower than previous periods, the seismicity is localized in three active sources located in the South-West, East and South- East of the center of the lagoon. We distinguish the recording of a tremor episode and certain LP signals, whose characteristics suggest the location of the source of this type of activity at deep levels. The process of cortical deformation continues to evolve at rates similar to those observed historically. On the surface, there are no apparent changes linked to volcanic dynamics. From the above, we conclude that the volcanic system always records internal activity with energy levels above its basic threshold.
In this way, the volcanic technical alert is maintained by:
YELLOW TECHNICAL ALERT: Changes in the behavior of volcanic activity
Source : Sernageomin
Photo : OAAV