
February 23 , 2018.
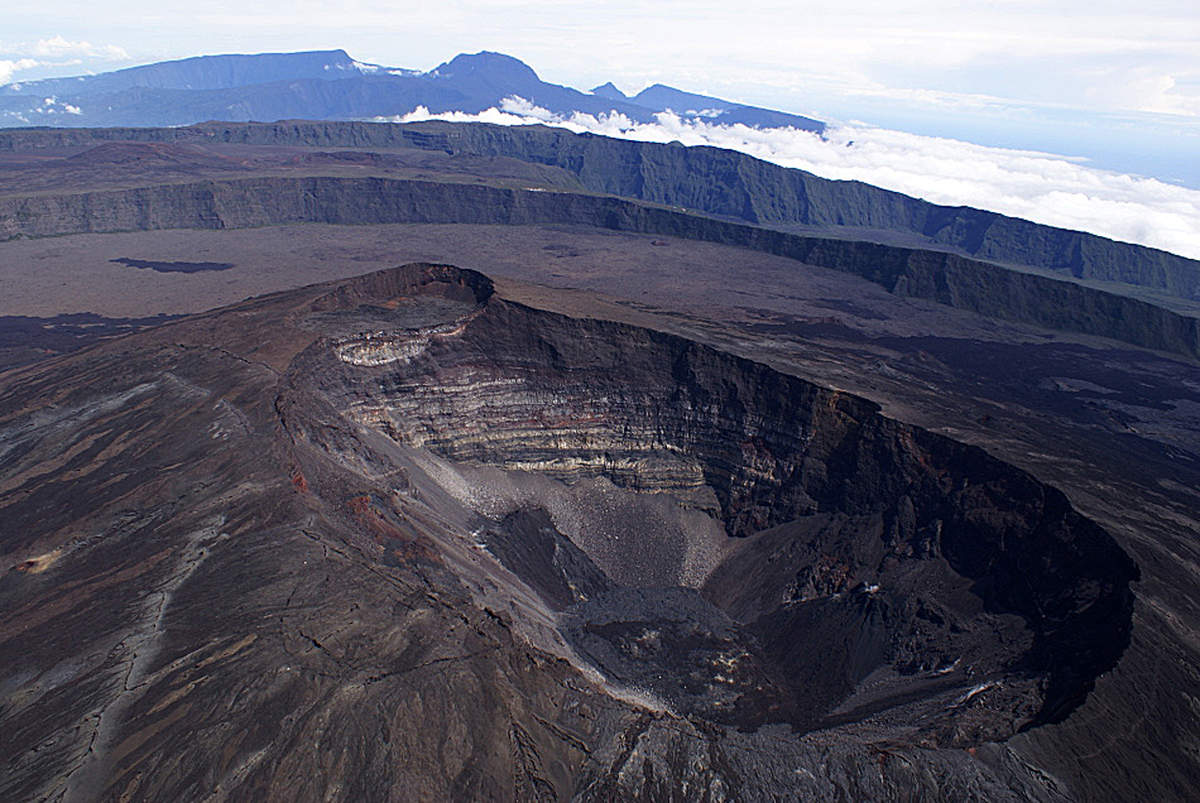
Piton de la Fournaise , La Réunion , Update 11h30 :
Activity Bulletin from Friday, February 23, 2018 at 11:30 am (local time).
Since 16 February 2018, a gradual increase in superficial volcano-tectonic seismicity (<2.5 km deep) beneath the summit craters has been observed. The daily number of such events increased from 2 on 16 and 17 February to 11 on 21 February (Figure 1).

Figure 1: Histogram showing the number of superficial volcano-tectonic earthquakes recorded under the summit craters between January 1 and February 22, 2018. (© OVPF / IPGP)
This increase in seismicity is accompanied by an increase in the CO2 concentrations recorded in the soil:
– Distal sector, region Plaine des Cafres / Plains of the Palmistes: Tendency to increase on intermediate values.
– Sector close to the Gîte du Volcan: Strong increase in emissions over the entire control profile of this sector; the measured concentrations are among the 3 highest anomalies measured since the beginning of the monitoring of this sector in 2015 (previous anomalies: March-May 2015 and December 2016-January 2017, Figure 2).

Figure 2: Average CO2 concentration in the soil at the Gîte du Volcan between September 2016 and February 2018 (the eruptions of 11-18 September 2016, 31 January-27 February 2017 and 14 July – 28 August 2017 are represented in red, and the injection of magma of May 17, 2017 is represented by a gray bar). In blue the raw data. In red the corrected data of temperature effects. Values are normalized to the maximum value recorded. (© OVPF / IPGP)
It should be noted that the SO2 fluxes in the air recorded at the edge of the enclosure are below or close to the detection threshold; even though since mid-January several small exceedances of the low intensity detection threshold have been recorded on the station of the western sector of the Enclos Fouqué rampart.
At the top of low concentrations of H2S (near the limit of detection) and sometimes of SO2 are always recorded.
This joint increase in seismicity and CO2 concentration in the soil follows several months of slow building inflation. This inflation is particularly visible on the stations located at the base of the terminal cone (extension of the order of 2-2.5 cm from the base of the terminal cone since the end of the last eruption, August 28, 2017; the pressurization of a deep source.

Figure 3: Illustration of the deformation since July 2017 (the eruption of July 14 – August 28, 2017 is shown in yellow). Here is shown a baseline (distance between two GPS receivers) crossing the terminal cone from north to south (in black the raw data, in blue the data smoothed over a week). An increase in the signal is synonymous with elongation and therefore swelling of the volcano; conversely, a decrease in the signal is synonymous with contraction and therefore deflation of the volcano. (© OVPF / IPGP)
Source : OVPF

No comment yet, add your voice below!