
January 26 , 2018.
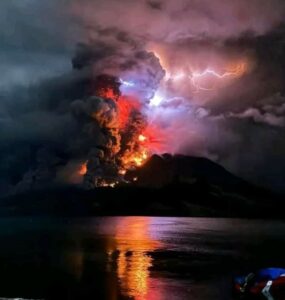
Mayon , Philippines :
MAYON VOLCANO BULLETIN 26 January 2018 08:00 AM
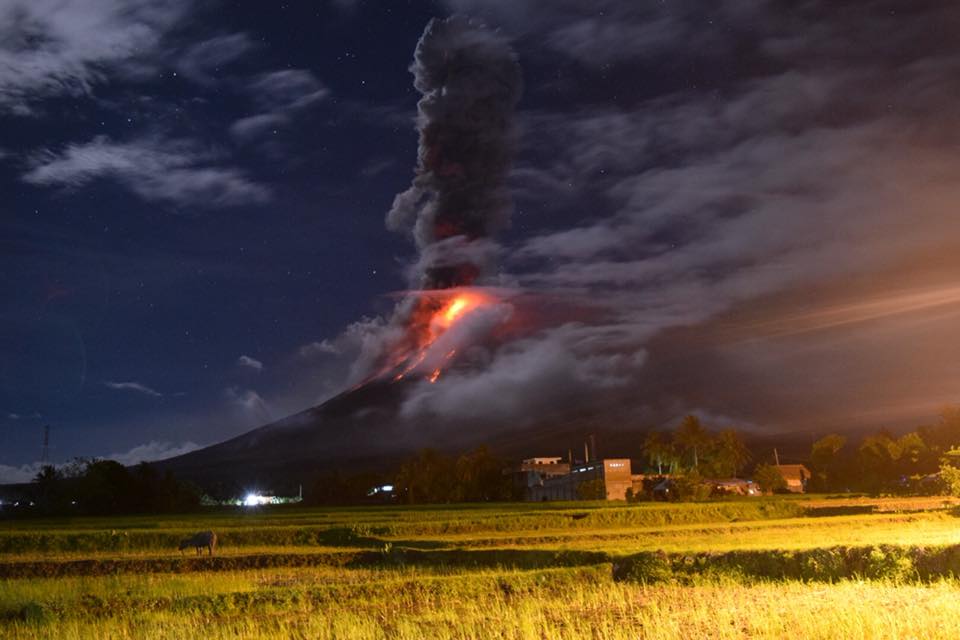
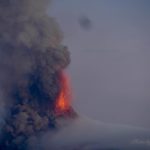
Between 06:11 AM yesterday to 02:31 AM this morning, seven (7) episodes of intense but sporadic lava fountaining from the summit crater lasting twenty six (26) minutes to fifty-seven (57) minutes occurred. The lava fountains reached 150 meters to 500 meters high and generated ash plumes that reached 500 meters to 3 kilometers above the crater. The events fed lava flows on the Mi-isi and Bonga Gullies, sprayed near-vent lava spatter, and fed incandescent rockfall on the summit area. Pyroclastic density currents or PDCs on gullies heading the Mi-isi, Lidong/Basud, and Buyuan Channels were also observed. The runout of PDCs on the Buyuan Channel is now exceeding 5 kilometers from the summit crater.
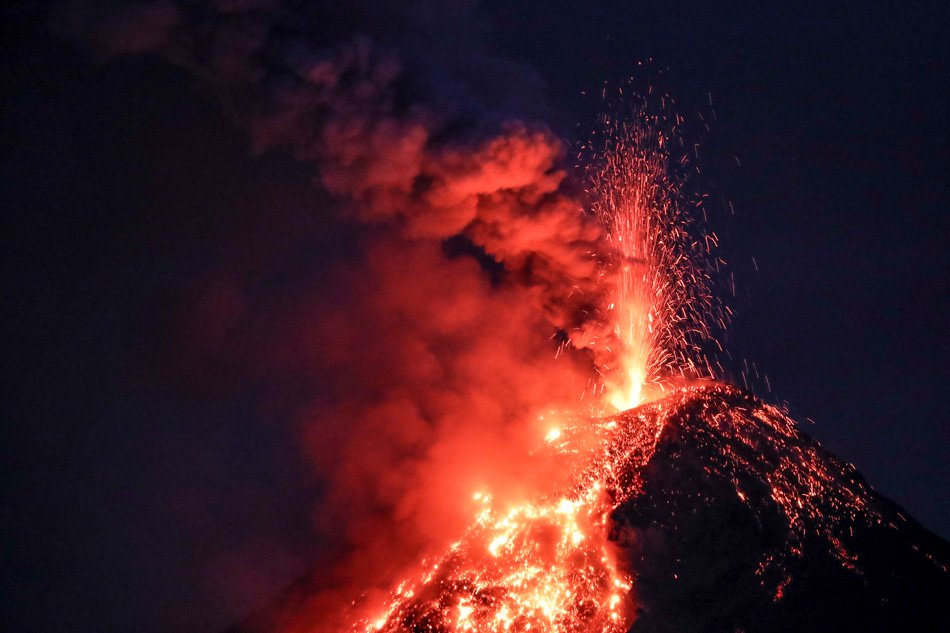
A total of fifteen (15) volcanic earthquakes, nineteen (19) tremor events, seven (7) of which correspond to the lava fountaining events, one (1) episode of pyroclastic density current or PDC generation from lava collapse, and numerous rockfall events were recorded by Mayon’s seismic monitoring network. Rockfall events were generated by the collapsing lava front and margins of the advancing lava flow on the Mi-isi and Bonga Gullies. Currently, the Mi-isi and Buyuan lava flows have maintained their advance to three (3) kilometers and one (1) kilometer, respectively, from the summit crater. Sulfur dioxide gas emission was measured at an average of 1916 tonnes/day on 25 January 2018. Electronic tilt and continuous GPS measurements indicate a sustained swelling or inflation of the edifice since November and October 2017, consistent with pressurization by magmatic intrusion.
Alert Level 4 remains in effect over Mayon Volcano. The public is strongly advised to be vigilant and desist from entering the eight (8) kilometer-radius danger zone, and to be additionally vigilant against pyroclastic density currents, lahars and sediment-laden streamflows along channels draining the edifice. Civil aviation authorities must also advise pilots to avoid flying close to the volcano’s summit as ash from any sudden eruption can be hazardous to aircraft.
DOST-PHIVOLCS maintains close monitoring of Mayon Volcano and any new development will be communicated to all concerned stakeholders.
Source : Phivolcs
Photo : Jonathan Cellona, ABS-CBN News, Manuel Soratorio III
Source : Phivolcs
Tungurahua , Ecuador :
Summary:
On January 11, 2018, the summit of Tungurahua volcano was climbed for thermal monitoring of the crater using direct thermocouple and thermal imaging measurements. The outer and inner fumaroles of the crater have temperatures equal to or lower than 85 ° C, unchanged from the last measurements made on March 5, 2017 (82 ° C). The apparent maximum temperature (TMA) of the crater floor is ~ 69.3 ° C. It also shows no change from the upward measure of February 17, 2017 (~ 68.6 ° C), and is significantly lower at the temperature measured during the ascent of November 11, 2009 (258.7 ° C). The TMA of the crater walls (45-53.4 ° C) also decreased significantly compared to the 2017 measurements (110.8-111 ° C). These parameters confirm the decrease in the internal activity of Tungurahua observed during the last 22 months.

In addition, a drone flyover was done to obtain an orthophoto and a digital surface model (DSM) of the crater with a high resolution (~ 5 cm / px). The results indicate that the crater area has changed significantly due to eruptive activity during the 2008-2016 period. The bottom of the crater is in the same geographical location as in 2008 but with a height difference of +47 m. The lower crater is 77 × 58 m in diameter and 15 to 30 m deep. The upper crater, 335 x 300 m in diameter and 72 to 148 m deep, is significantly larger than that of 2008 and 2011. The maximum accumulation of material in the outer crater is +17 m (edge NW) and +57 m (SSW edge) since 2008.
It is important to note that the new configuration of the upper crater could favor the pouring of lava flows and inflamed clouds along the northwest flank in case of new eruptive activity.
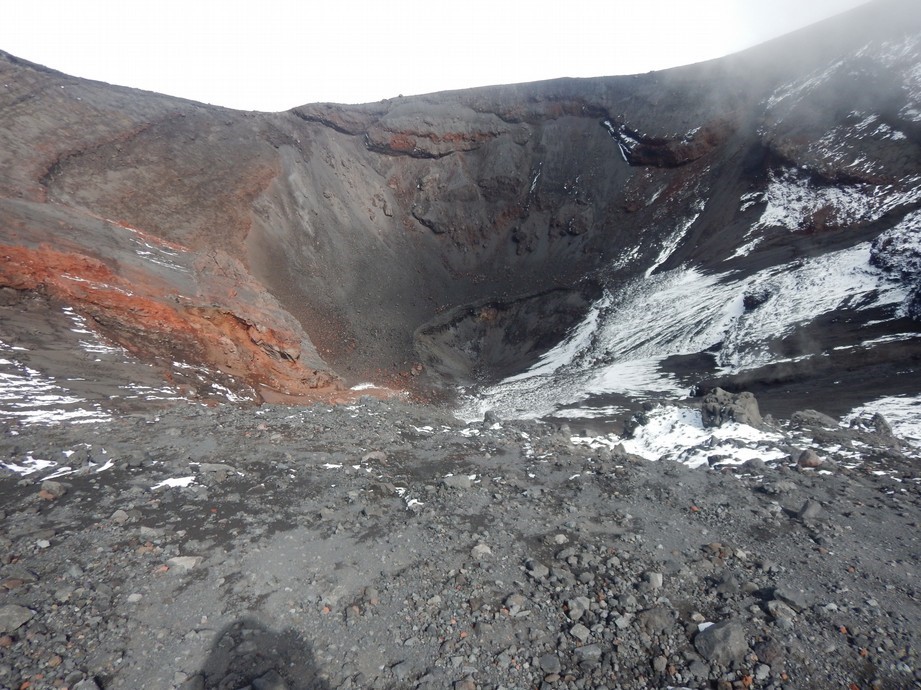
Figure 1. Tungurahua volcano crater (photo: A. Grouazel, 11/01/2018).
1. Thermal monitoring
1.1. Direct measures
The temperature of 16 fumaroles belonging to 2 fumarolic zones was measured: the North-East external edge (1 point) and the external crater (15 points from North-East to South). The temperature of the Northeast edge fumarole (F01 = 81.8 ° C) is similar to the values measured at the same location on November 15, 2009 (85 ° C) and March 5, 2017 (82.0 ° C). For the fumarolic zone of the outer crater (F02 to F16), values ranging from 72.3 to 85 ° C have been found, temperatures which barely exceed the boiling temperature of the water at crater height (83, 6 ° C). There was no smell of SO2 or H2S in the fumaroles.
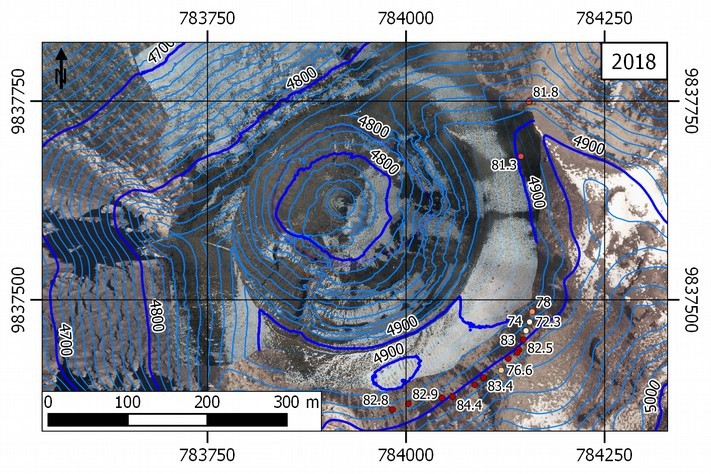
Figure 2. Temperatures (° C) of fumaroles in the outer zones of the northeastern edge and the outer crater (ortho-photo and DSM: B. Bernard).
1.2 Infrared Images
By analyzing the infrared images captured at different points of view on the edge of the crater, the maximum apparent temperature (TMA) values were obtained for 4 zones: 1) the southern interior wall; 2) the bottom of the crater; 3) the north inner wall; 4) the fumarolic zone of the outer crater (Fig. 3).

Figure 3. Photos and thermal images of the Tungurahua volcano crater (photos and images: B. Bernard, analysis: M. Almeida). The first photo is a vertical photograph of the crater taken with the drone with measurement sites.
2. The morphological changes of the crater.
A series of aerial photos of the upper crater was made using a drone flying 100 meters above the crater level. We obtained an ortho-photo and a digital surface model with a resolution of ~ 5 cm / px. You can clearly see several integrated structures that could define different craters. Of these structures there are two that define an upper crater and a lower crater. The upper crater has a semi-elliptical shape 335 m long and 300 m wide, elongated in the NE-SW direction. The lower crater has a more irregular shape with 77 m long and 58 m wide and is elongated in the direction NNE-SSW. At the bottom of the lower crater, there are two small sub-circular coalescing depressions that could match the volcano vent. These depressions are aligned in a N-S direction and are respectively 4.8 m (N) and 3.1 m (S). The bottom of the crater is 4761 m above sea level (s.n.m.) while the edge of the upper crater is between 4833 m s.n.m. (North-West edge) and 4909 m s.n.m. (SSW), which means a depth of between 72 and 148 m.
Compared with ortho-photos and digital terrain models made in 2008 and 2011, there is a clear morphological change in the crater. Systematic growth of the upper crater is observed (100 × 94 m in 2008, 244 × 218 m in 2011), a rise of the bottom (+47 m total) and of the edge (between +17 m NW and +57 m SSW) of the crater associated with a large accumulation of eruptive material that gives shape to an internal cone. Since 2011, the north-western edge of the upper crater almost coincides with the edge of the outer crater while in 2008 it was at a distance of 75 m. The bottom of the crater is 72 m below the level of the outer crater rim northwest, while in 2008 and 2011 it was 102 m and 82 m below the level, respectively.
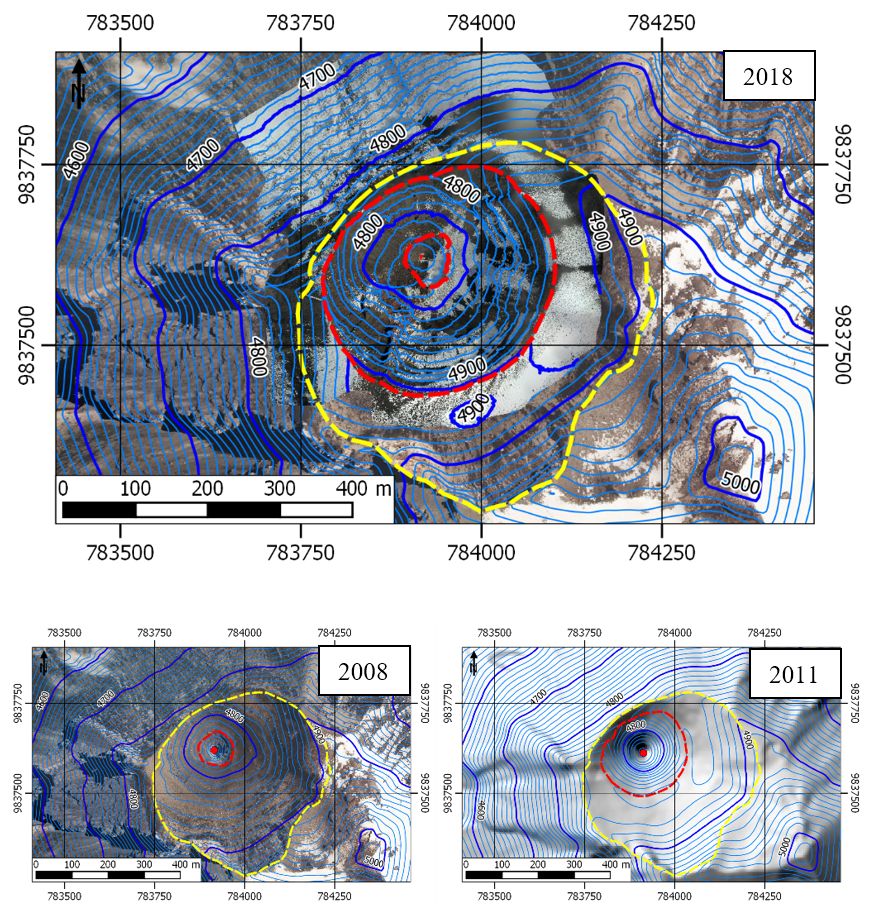
Figure 4. Temporal evolution of the Tungurahua volcano crater between 2008 and 2018. Ortho-photo and DSM 2018: Bernard B. Ortho-photo and Digital Terrain Model 2008: IDB Project. Digital Terrain Model 2011: SIGTIERRAS. Dashed red lines: craters; yellow dotted line: outer crater; Red dots: vents.
Conclusions.
Thermal monitoring results indicate that there has been no change in fumarole and crater floor temperatures since the last visits in February and March 2017, which are below the values obtained while the volcano was erupting. . However, a decrease in the temperature of the walls of the crater is noted. These results confirm the decrease in the internal activity of the Tungurahua volcano over the past 22 months.
Thanks to the new ortho-photo and the new digital surface model of the crater area, the current crater structure could be precisely defined and the difference with the 2008 and 2011 images. These morphological changes make it possible to quantify the size of the crater. growth of the internal cone to eruptive activity between 2008 and 2016.
It is important to note that since 2011, the northwestern edge of the upper crater coincides with the edge of the outer crater. In addition, the elevation difference between the crater floor and the northwest edge has been reduced. The new crater configuration may favor the discharge of lava flows and inflamed clouds (pyroclastic density currents) along the northwest flank in case of new eruptive activity.
Source : IGEPN , BB, AG, JG, MA, SS , Institut de géophysique , École nationale polytechnique
Photo : José Lus Espinosa Naranjo .
Nevado del Ruiz , Colombia :
Subject: Bulletin of activity of the Nevado del Ruiz volcano.
The level of activity continues at the level: Yellow activity level or (III): changes in the behavior of volcanic activity.
With regard to monitoring the activity of the Nevado del Ruiz volcano, the COLOMBIAN GEOLOGICAL SERVICE informs that:
During the last week, the various monitoring parameters show that the Nevado del Ruiz volcano continues to display unstable behavior.
The seismicity caused by the fracturing of the rocks that make up the volcano, showed similar values in the number of earthquakes and the decrease in loose seismic energy, compared with the previous week. The earthquakes were mainly in the southwestern sector and, to a lesser extent, in the Arenas crater and the northeastern sector, distal to the north, south-east, north-east and west- Southwest of the volcano. The depths of the earthquakes varied between 0.7 and 6.6 km. The maximum magnitude recorded during the week was 1.4 ML (Local Magnitude) for the earthquake of January 20 at 21:46 (local time), west-southwest, located about 6.0 km Arenas crater, 3.9 km deep.
The seismic activity associated with fluid dynamics in the volcanic structure has shown a decrease in the number of recorded earthquakes and values similar to the seismic energy released during the previous week. This type of activity is characterized mainly by the occurrence of earthquakes of multiple fluids, of type long periods and very long periods, as well as pulses of tremors. The earthquakes were located mainly in the vicinity of the Arenas crater and in the South-East areas of the volcano.
Volcanic deformation measured from electronic inclinometers, Global Navigation Satellite System (GNSS) stations and radar images show stability behavior without recording any significant deformation process of the volcanic structure.
The volcano continues to emit water vapor and gases into the atmosphere, among which the sulfur dioxide (SO2) is distinguished, as evidenced by the values obtained by the SCANDOAS stations installed on the volcano and the analysis satellite images. In monitoring the information provided by the MIROVA and NASA FIRMS portals, several thermal anomalies have been recorded near the Arenas crater.
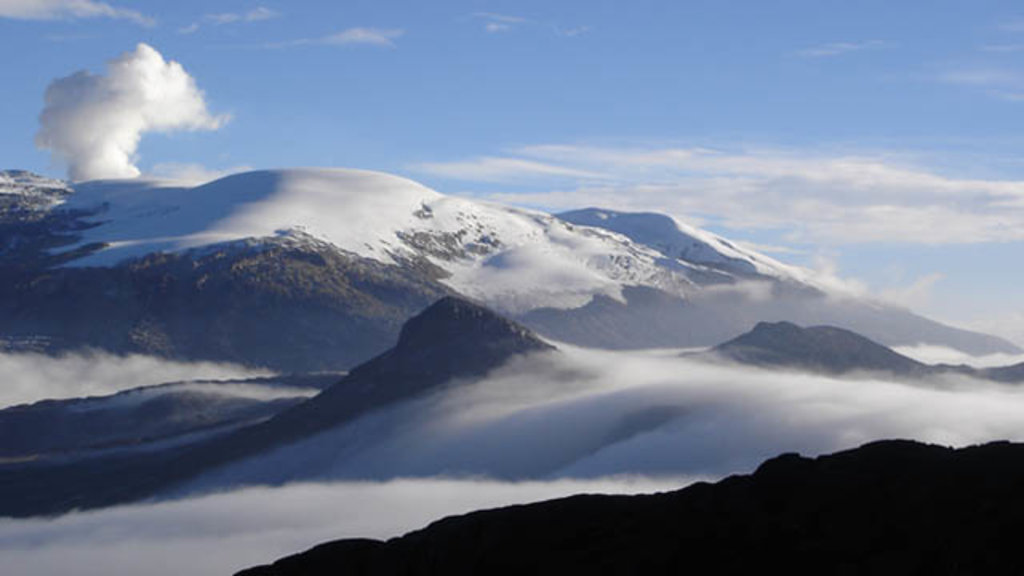
The column of gas and steam reached a maximum height of 700 meters measured at the top of the volcano, January 17. The direction of the dispersion of the column was governed by the direction of the wind in the area, which during the week prevailed to the northwest and southwest relative to the crater Arenas.
The Nevado del Ruiz volcano continues at the level of yellow activity.
Source : SGC
Kadovar , Papua New Guinea :
No RVO update today so it is presumed that the situation remains same as yesterday.
Date: 24th January 2018
Volcano: Kadovar, East Sepik. Papua New Guinea
Report Period: 23-24th January 2018
Current Activity:
The eruption continues, much the same as for the last few days.
The Main Crater produced weak to moderate light grey to brown ash clouds rising to less than 100 m above the vent and were blown to the west.
A weak glow was observed from the Main Crater at night.
The SW and W Vents were obscured by ash from the Main Crater. A continuous white steam plume is rising from the SE Coastal Vent to 400 m above the island and then blown to the west.

There was a fluctuating glow from the SE Coastal vent throughout the night.
The lava dome (rising out of the water) is now estimated to be 50 m high above sea-level and extends about 150-200 m out from the sea. The depth of the sea here is not known.
Ash plume: Mainly steam with minor ash is being emitted and is being blown to the west. The plume extends for a few tens of kilometres. Atmospheric cloud (weather cloud) at times hampers
Observations:
Areas affected by ashfall: Downwind areas are affected by light haze and some ash.
Seismicity: Seismicity is described as Low to Moderate.
There was only one High Frequency event recorded during this period. There were 12 significant Low Frequency events, together with ‘numerous’ small LF events.

Prognosis: The dome of lava at the ‘SE Coastal Vent’ glows red at night and is slowly extending outwards into the sea and growing in height. Continuing strong SO2 emissions, the continued seismicity and the ongoing eruptive activity would indicate that the situation is still dynamic but has settled into a reasonable stable situation.
There is a slight possibility that small tsunamis may be generated, but the situation is stabilizing.
Risk: Remains High on Kadovar
On the Mainland and other nearby Islands, A small risk of tsunamis.
Source : John Kawatt.
Photos : BJ productions , Deimos Imaging, an UrtheCast company

No comment yet, add your voice below!